LTCBTC (litecoin)hi dear trader
there are two take profit on this chart ... litecoin with btc pair
Litecoin might hit the $1000 price level by the end of 2025
Litecoin implemented a different algorithm that requires a lower hash rate for miners named Scrypt. As a result, Litecoin miners need less energy and effort to process transaction blocks, increasing the block times to about 2.5 minutes. For that reason, Litecoin is often called silver, where Bitcoin is gold.
What is the difference between a trader and a crypto holder?
Day trading is a short-term and high-risk strategy where crypto investors buy and sell cryptocurrencies on the same day to profit from rapid price swings. Hodling is crypto slang for buying and holding cryptocurrency to profit from its long-term value appreciation.
goodluck
Litecoin (Cryptocurrency)

LTC/BTC - Litecoin: Super Trend◳◱ On the $LTC/ CRYPTOCAP:BTC chart, the Super Trend pattern suggests a pause in volatility, potentially gearing up for a breakout. Traders might observe resistance around 0.002132 | 0.00227 | 0.002497 and support near 0.001905 | 0.001816 | 0.001589. Entering trades at 0.002031 could be strategic, aiming for the next resistance level.
◰◲ General info :
▣ Name: Litecoin
▣ Rank: 18
▣ Exchanges: Binance, Kucoin, Huobipro, Gateio, Mexc, Bittrex
▣ Category/Sector: Payments - Currencies
▣ Overview: Litecoin is a fork of Bitcoin's codebase with four times faster block times and a four times larger supply. The project considers itself complementary to Bitcoin as a silver to Bitcoin's gold. It is often used as a pseduo-testnet for Bitcoin, adopting new protocol changes before they are deployed on Bitcoin.
◰◲ Technical Metrics :
▣ Mrkt Price: 0.002031 ₿
▣ 24HVol: 110.878 ₿
▣ 24H Chng: 2.421%
▣ 7-Days Chng: 3.66%
▣ 1-Month Chng: 8.87%
▣ 3-Months Chng: -13.40%
◲◰ Pivot Points - Levels :
◥ Resistance: 0.002132 | 0.00227 | 0.002497
◢ Support: 0.001905 | 0.001816 | 0.001589
◱◳ Indicators recommendation :
▣ Oscillators: NEUTRAL
▣ Moving Averages: BUY
◰◲ Technical Indicators Summary : BUY
◲◰ Sharpe Ratios :
▣ Last 30D: 3.44
▣ Last 90D: -0.90
▣ Last 1-Y: 0.44
▣ Last 3-Y: 0.58
◲◰ Volatility :
▣ Last 30D: 0.36
▣ Last 90D: 0.49
▣ Last 1-Y: 0.74
▣ Last 3-Y: 0.97
◳◰ Market Sentiment Index :
▣ News sentiment score is N/A
▣ Twitter sentiment score is 0.52 - Bullish
▣ Reddit sentiment score is 0.57 - Bullish
▣ In-depth LTCBTC technical analysis on Tradingview TA page
▣ What do you think of this analysis? Share your insights and let's discuss in the comments below. Your like, follow and support would be greatly appreciated!
◲ Disclaimer
Please note that the information and publications provided are for informational purposes only and should not be construed as financial, investment, trading, or any other type of advice or recommendation. We encourage you to conduct your own research and consult with a qualified professional before making any financial decisions. The use of the information provided is solely at your own risk.
▣ Welcome to the home of charting big: TradingView
Benefit from a ton of financial analysis features, instruments and data. Have a look around, and if you do choose to go with an upgraded plan, you'll get up to $30.
Discover it here - affiliate link -

Litecoin LTC long medium-term trade #21Taking into account the fact that in the medium term we are more inclined to believe that the crypto market will grow, we continue to publish medium-term trades.
In order to continue the growth of the crypto market, we would not like to see a correction of the BTCUSDT price below $26950-27000 in the coming days:
In previous years, the LTC price was one of the first to start an upward trend and correction. This year, the "scheme" failed, the LTCUSDT price was one of the first to start correcting in July, but it still can't start growing, although the BTC price has been growing slowly for 2 months...
We will try "to push" the Litecoin price up a bit :) by entering a medium-term trade on the following conditions:
Entry: in the range of $60.21-62.51 (the desired average price is $61.36)
Stop: $55.99 (-8.75%)
Take profit: $83.80 (+36.57%)
P/L ratio: 4.2/1
We allocate $10,000 for LTCUSD trade,
In the event of a mistake, we will lose $875
If the trade will be a success, we will receive a profit of $3650

Ltc looking to movelitecoin looking good here, could see a nice move up
already long from the bottom but still a good price to get in on it

IGNORE THE FUDThere has been increasing Litecoin FUD lately, Ive noticed. I dont listen to it because Litecoin fundamentals have never been stronger, and compared to all the other garbage no one uses Litecoin is actually looking quite sexy to the investor who has eyes to see beyond the BS. Also for the LTC bulls go take a look at the top richest wallets. You will be able to see that the smart investors are the ones loading up as much as they can recently. It wont be long, usually there is a lot of FUD before a major move, and there are so many who are salty because they invested at the top and lost their shirts so now they hate LTC because of it. Ignore all that and know that this coin will be #2 again very soon. Charlie didnt sell his stash because he needed the money. Ho got a whisper in his ear back then about the securities issues that are about to delete 99% of all the crap out there. When that happens guess what will still be around :) Good luck and this is not financial advice, just my opinion. Thank you.

Litecoin Solid Buy Signal!LTCUSDT located at support zone, this zone is proven to be solid buy opportunity in following years 2017, 2018, 2020. Now 2 years later, LTCUSD consolidating in this zone again, and it just made a breakout! I am hop in this running train and waiting for nice income during the move.

LTC Large Move Pending!A Few observations for LTC right now:
Bullish
- Support above 21 day moving average
- Cup and handle formation
- Parallel channel with depth of cup breakout extending to top of channel
Bearish
- Could be a bear flag continuation to downside
- Look for a drop to ~175$

Litecoin Aiming at the $72 ZoneLitecoin exhibits less dynamism and activity. This can be attributed to the decreased interest in “older” coins from buyers, who seem to prefer new and developed blockchains like the Zkevm, the Layer 2 Blockchains like Cyber, Sei and the likes.
Nonetheless, LTC has come remarkably close to the resistance zone of $70.00-$72.87, opening up the possibility of breaking out of the sideways trend that has persisted for three months.
Should buyers successfully navigate through the current resistance zone, LTC could initiate an upward trend, aiming for highs at the $76 and $79 levels. These points serve as the initial targets for buyers in the event of LTC's growth.
A correction in the BTC chart might similarly impact the LTC price. At present, the relevant support zones are found within the ranges of $66.3-$67.6 and $63.2-$64.8. However, if Bitcoin falls by 5-10% in a short span, LTC could quickly plummet due to the apparent lack of buying strength in its chart (at least at the time of writing this review), easily breaking through all the existing support zones.

Entered a LTC/BTC LongI'm going to swing trade the current LTC/BTC position.
25% Profit expected
Longed 0.002
Target: 0.0025
Stop Loss: 0.00194

Litecoin LTC Dominance Broke DowntrendSomething no one is talking about is the Litecoin market cap dominance. It broke out of the multi year falling channel and has remained above. That I think is quite bullish for Litecoin. The LTC/BTC pair has been in a downward falling wedge since the beginning and now has reached the apex. I think big moves are coming for Litecoin, bigger than most would ever expect. Many people forgot about Litecoin, but its used more than 99% of the other cryptocurrencies out there for daily transactions. It has also gotten the green light from the SEC and the CFTC unlike 99.9% of the other cryptos. Once the hype dies down with all these other projects who do nothing, will never do anything, and no one ever uses, I believe that real world use case cryptocurrencies will make giant gains as money floods out of empty promise and junk no use case cryptos. Call me crazy I dont care, but I still believe that Litecoin will melt everyone face when it goes parabolic, while the current favorites and hype coins bleed out.
When you watch mainstream media when they talk about cryptocurrencies, what coins do you see on the screen? Its BTC, LTC, ETH almost every time. Sometimes they throw in the current hype coin but those three are ALWAYS on there. Also which coins did the SEC deem not securities? BTC, LTC, ETH, BCH.
Another thing is when you look at the wallets for Litecoin, you will notice whales have been stacking. They arent selling and why do you think that is? Its obvious to me whats about to happen, I just hope that others can read the writing on the wall.
September 2023
Litecoin is one of the few cryptocurrencies currently immune against scrutiny from the US Securities and Exchange Commission (SEC). The regulating body sees a handful of tokens, including Litecoin, as non-securities, protecting them from legal claims filed against adjacent tokens such as Ripple’s XRP.
Litecoin recently celebrated a new milestone as it saw a “50% increase in the percentage of use on @BitPay”.
Litecoin is on a course to further surge as the token partners with PayPal and Ledger to facilitate crypto trading for customers.
June 2023
EDX has a number of prominent Wall Street backers. In addition to Charles Schwab (SCHW) and Citadel, the firm’s investors include Fidelity and Virtu Financial (VIRT).
For now, EDX’s scope is limited. The exchange only trades Bitcoin, Ethereum, Litecoin, and Bitcoin Cash, rather than the hundreds of tokens that change hands on Coinbase and its competitor Binance. The firm plans
later this year to launch a clearinghouse to help settle trades.
Its entry into the market is a strong sign that the crypto market’s old way of doing business, where trading platforms profit from providing all those functions at once, is on the way out the door. Even as the SEC’s lawsuit against Coinbase could take years to play out, traditional firms are starting to bring the old rules to bear on the token market.

Parabolic ArchText book says "wait for the zones". This appears to be the beginning of a larger parabolic step formation. We can therefore expect four defined levels up which would put us into the 100s. "Traders view the parabolic formation as one of the strongest uptrend patterns that precede reversal."

Litecoin Macro Analysis : BIG MovesHi Traders, Investors and Speculators of Charts📈📉
From the charts; a macro view on LTCUSDT with Fibonacci Retracement, Cycle analysis and Time Frame analysis.
By taking a detailed look, you can clearly see that the next phase bound to happen is the bullish phase, and Litecoin is no stranger to parabolic upside movements. I hope your bags are packed because once LTC moves, it's hard to jump onto a moving train.
The bullish signs are:
✅ Consolidation under resistance zone / bullish
✅ Higher Lows - buyers are buying up dips
What's still missing:
✅ Bullish Technical Indicator (Weekly on CryptoCheck START v3.5)
✅ Weekly candle close ABOVE 70
Even thought the price may continue to trade just under the resistance for another while, the next big market cycle is clearly the bullish phase.
_______________________
📢Follow us here on TradingView for daily updates and trade ideas on crypto , stocks and commodities 💎Hit like & Follow 👍
We thank you for your support !
CryptoCheck
BINANCE:LTCUSDT

LTC/USDT Break Alert!! Upward Momentum for Litecoin ???💎 LTC has indeed seized our interest, breaking through the Symmetrical Triangle pattern with substantial volume and a robust bullish green candle. LTC successfully breached the resistance zone, which has now transitioned into a support level at $68.30.
💎 However, LTC has not yet initiated a downward movement for a potential retesting phase. At this juncture, LTC is poised to extend its upward trajectory, given the successful breakout from the resistance. It's LTC Probability could reach the supply zone and the bearish OB region.
💎 However, if LTC fails to uphold the support at $68.30 and compromises this level, it may retreat to the demand zone for a significant bounce. Should LTC descend to the demand area and fail to exhibit any bullish rejection or bounce, it risks forfeiting the demand zone, signaling a false breakout. Under these circumstances, LTC would be under downward momentum, potentially heading towards a lower support zone, and might even extend its decline to a critical support area.

LTCUSDT.Poday, the price of Litecoin stands at $64, backed by a 24-hour trading volume amounting to $234 million. With a market capitalization of $$4,735 billion. Over the past 24 hours, the LTC price has seen a 3.94% increase.
The LTC price analysis for 22 October confirms that bulls are attempting to prevent a downward rally as LTC price met a surge in buying pressure and is exponentially surging toward $66. Over the last few hours, LTC price flashed high buying pressure in an effort to meet buyers’ demand.
Analyzing the daily price chart, Litecoin price is currently experiencing buying activity as it made a buying pressure from the low of $60.
BE CLEVER AND CHOOSE YOUR SIDE THEN TRADE THE ADVICE .
If u want to have more our private idea text us.
Long position
🔻 Buy LTC
📌Entry: 62.50 - 62
🚫 SL: 59.50 - 59 ( -4.80 %)
🚫 TP: 70.10 ( +12.20 %)

Short idea on LTCAs I wrote earlier, I like Litecoin.
There will be a halving soon (people think it's time to buy)
The market is generally positive
I like the structure
*not financial advice (these are trading ideas myself)

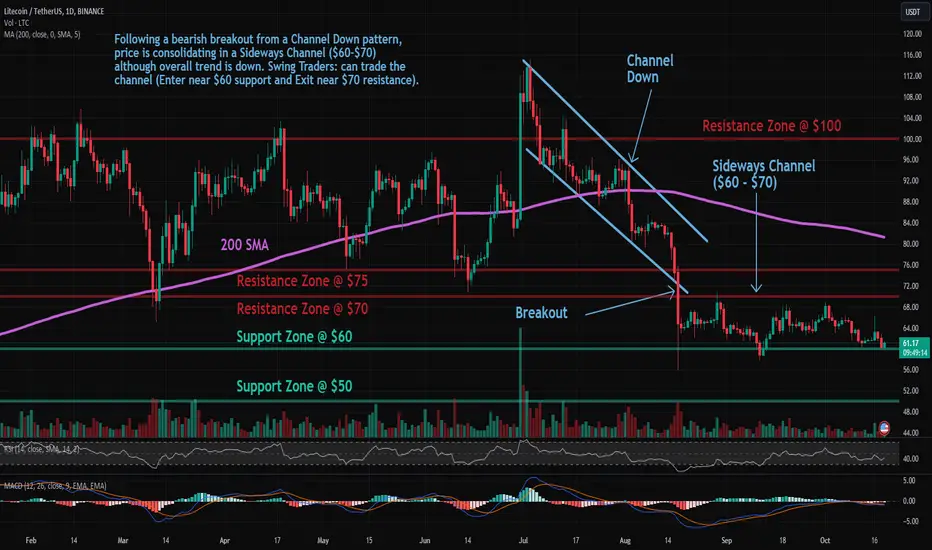
LTC: Sideways ChannelLitecoin (LTC) technical analysis:
Trade setup: Following a bearish breakout from a Channel Down pattern, price is consolidating in a Sideways Channel ($60-$70) although overall trend is down. Swing Traders: can trade the channel (Enter near $60 support and Exit near $70 resistance).
Pattern: Price is trading in a Sideways Channel , which is a neutral pattern (indication of market indecision). Trend Traders ought to wait for a breakout in either direction, although typically it breaks in the direction of the existing trend. Swing Traders can trade the range – Buy near Support and Sell near Resistance.
Trend: Downtrend across all time horizons (Short- Medium- and Long-Term).
Momentum is Bearish ( MACD Line is below MACD Signal Line, and RSI is below 45).
Support and Resistance: Nearest Support Zone is $60, then $50. The nearest Resistance Zone is $70, then $75.
LTCUSD ❕ declineTD Sequential has formed a reversal signal to the downside (4H TF)
Price broke down through 50EMA (1H TF)
RSI is moving in the sellers zone (1H and 30m TFs)
I believe that LTC will continue to decline.

LTCUSDT WILL FOLLOW A BEARISH MOMENTUMLTCUSDT created an bearish pennant followed by the bearish trend formed. Here we see a breakout and pullback on the key level where it still remains under the bearish pressure which is expected to revisit back on the highlighted support on the bottom.

LTC Under Pressure 📉, 24H & 1-Week Horizons Cloudy ☁️Cloudy ☁️, rainy 🌧️, and even stormy ⛈️ trading conditions lie ahead in the next 24 hours. This translates into a bearish market with downside risk for cryptocurrencies. Particularly Litecoin, Ethereum, Cardano, Uniswap, and Polkadot may come under pressure. Chainlink bucks this negative trend and has upside potential, according to ATTMO.
Over a one-week horizon, the bearish trend will continue to linger over the crypto universe, except for Bitcoin, Polygon, and Chainlink. Slightly bullish sun ☀️ will shine over this trio, indicating a possible upside in their prices.
Follow us for more crypto weather reports!

LTCUSDT at monthly support, likely to bounce soon.The price has been going down since it hit the monthly resistance MR1 a few months back. The price came back to monthly support and bounce from there. Now it is experiencing a pullback from that bounce and the price is currently trading at weekly support WS1 which is also close to monthly support MS1. I think the current setup is offering a good long opportunity on high time frame. The last monthly candle close has been bullish and indicates that the current or next monthly candle is going to be a green one. The price is also at the support level which is providing a good confluence. Some indicators are also indicating the direction for the price to be up side in the coming days. There can be a bit of dip into the MS1 but not necessary. Overall it is looking good for a long on high time frame.

Litecoin on weekly chart💥With the ever-evolving crypto landscape, it's easy to get caught up in the latest trends and tokens, but sometimes the most valuable gems are right in front of us. Litecoin, often referred to as the "silver" to Bitcoin's "gold," is one such cryptocurrency that has been quietly making strides in the digital currency world.
Here are a few reasons why Litecoin might be considered an undervalued asset:
Digital Silver: Litecoin is often referred to as the "silver" to Bitcoin's "gold" in the world of cryptocurrencies. It offers similar benefits but is primarily used for smaller transactions and everyday purchases.
Swift Transactions: Litecoin is known for its fast transaction processing. New blocks are generated approximately every 2.5 minutes, making it ideal for quick and discreet payments.
Strong Security: Litecoin uses the same cryptographic protocol as Bitcoin, ensuring a high level of security and protection.
Experienced Development Team: The Litecoin team consists of experienced developers who actively improve the network and work on new features.
Longevity: Litecoin has been in the market since 2011, and this longevity has added to its stability and trustworthiness.
Global Acceptance: An increasing number of companies and payment systems accept Litecoin, making it more useful for everyday transactions.
Ongoing Development: The crypto community continues to actively develop Litecoin, implementing new technologies and updates to keep it relevant.
Mined: Litecoin can be mined, making it accessible to those who wish to participate in the network and receive coins as a reward.
Useful for International Transactions: Thanks to its speed and low fees, Litecoin is an excellent choice for international transactions and money transfers.
Creative Applications: Litecoin is used for various applications, from digital collectibles to the execution of smart contracts.
As the crypto world evolves, it's essential to keep an eye on assets that may be overlooked. While Litecoin may not always grab headlines, its combination of speed, security, and adoption could make it a hidden gem in the cryptocurrency market.
What are your thoughts on Litecoin? Do you believe it's undervalued, or is there another cryptocurrency you think deserves more attention? Share your insights in the comments below!
Always sincerely with You,
Yours, Kateryna💙💛

LTC - 10/10 23LTC - 10/10/23
**Trade setup:**
LTC is trapped in between this supply and demand zone since the fall from $84, if it is broken there is a FVG to tap into around $72 a break of $72 will turn the trend bullish again!
If this DEMAND zone is broken it will head for the low it created 16th AUG!
