Litecoin longLitecoin bounced off the lower boundary of ascending channel. Bullish movement to resistance level at 102.8 is possible.
Litecoin (Cryptocurrency)

LTCUSD ❕ downward channelLTC is down under liquidity.
The price has fixed in a downward channel.
I expect the asset to continue to decline.

Litecoin Pre HalvingLitecoin Levels/Incline pre halving cheat sheet
Vertical Levels - Monthly Opens
Horizontal Levels - 1:1's and OB's
Incline is the range we're in.

W9.1-7 LTC BULLISH IDEA (HARMONICS BULLISH PATTERN)Potential Bullish Entry
Dow Theory In Place - Higher High and Higher Low Expected in Place
Formation of Harmonic Bullish reversal Pattern coupled with bullish divergence at potential reversal zone (PZR)
Entry at the new HH
SL & TP Levels are defined.

Unveiling the Secrets of LTC Patients: A Pitchfan AnalysisMethodology:
To analyze LTC patients, I used the Pitchfan tool to collect and analyze data on individuals with a history of Litecoin use or investment. My approach involved collecting data from various sources, including social media, forums, and news articles. I then used Pitchfan to clean and analyze the data, including identifying patterns, trends, and anomalies.
Tools:
For this analysis, I used Pitchfan in conjunction with other data analysis and visualization tools, such as Excel and Python. I selected Pitchfan for its ability to analyze social media and online content in real-time, as well as its intuitive interface and powerful analysis capabilities.
Findings and Conclusions:
Through my analysis, I identified several noteworthy trends and patterns in the data, including a growing interest in LTC among investors and a strong correlation between LTC investment and social media activity. I also found evidence of increased adoption of LTC as a payment method by businesses and individuals, as well as a surge in interest in LTC from younger investors.
Overall, my analysis provides valuable insights into the behavior and attitudes of LTC patients, as well as the broader impact of Litecoin on the economy and financial markets. While there are limitations to this analysis, such as the potential for bias in the data sources and the need for further research, I believe that these findings have important implications for investors, businesses, and policymakers in the years ahead.

LITECOIN 2023 ROUGH forecastLitecoin will in my opinion carry a look like this as we go through 2023 and the start of 2025. I would not expect any high prices or ATH for 2023 but you can expect at the very best 180-200 usd on LTC for 2023. The Early 2023 buy in is 33 usd respectfully.
2023 Summer 2023 TARGET is 180-200 usd
Halving is in August 2023 (Results in a sell off before it)
Trade carefully everyone!

🟢 BITCOIN : Time for LONG ? Let's SeeBy examining the recent analysis of Bitcoin, we see that as we expected, the price managed to hit all 3 targets that we had announced and fell from the range of HKEX:30 ,000 to HKEX:28 ,000! Note that the assumptions of the previous analysis are still valid (important demand levels).
Before :
After :
Previous Analysis : The range of 27800 to 28100 is one of the Strong and attractive demand zones for long position!!
Follow me for more analysis & Feel free to ask any questions you have, I'm here to help.
⚠️ This Analysis will be updated ...
👤 Arman Shaban : @ArmanShabanTrading
📅 04.21.2023
⚠️(DYOR)
❤️ If you apperciate my work , Please like and comment , It Keeps me motivated to do better ❤️

ArmanShabanTrading |🔴 BITCOIN : Short or Bull ?As you can see, in the 4-hour time frame, Bitcoin is preparing and heading for a price correction. If it penetrates and stabilizes below HKEX:29640 , we can expect a deeper correction of the price. The possible targets of this drop are HKEX:29 ,390, HKEX:28 ,590 and HKEX:28 ,080 respectively! The range of HKEX:27 ,800 to HKEX:28 ,100 is one of the Strong and attractive demand zones for long position!!
Follow me for more analysis & Feel free to ask any questions you have, I'm here to help.
⚠️ This Analysis will be updated ...
👤 Arman Shaban : @ArmanShabanTrading
📅 04.17.2023
⚠️(DYOR)
❤️ If you apperciate my work , Please like and comment , It Keeps me motivated to do better ❤️

LTCUSD Overlooking Indicators Pt.2The top cap indicator in red shows the prior bull run top for LTC in 2017 at roughly 350
We are now experiencing a similar bullrun so expect similar bull moves
Plotted bars pattern in green to the top of the top cap indicator

Litecoin - Looking To Sell Pullbacks In The Short TermH4 - Price is bouncing lower from a strong resistance zone.
Most recent uptrend line breakout.
No opposite signs.
H1 - Bearish divergence followed by a strong bearish move.
Currently it looks like a pullback is happening.
Until the two strong resistance zones hold my short term view remains bearish here.

LITEcoinLTC's current structure is also consolidating for a move up . keep a eye out for the breakout
Prevailingnine 4.1.23

LTC pump ?looking for respect of this current cloud and ema for another move up the STOCH/RSI also shows it as a probability
Prevailingnine 4.12.23

LTC LONG SETUPHi, dear traders. how are you ? Today we have a viewpoint to BUY/LONG the LTC symbol.
For risk management, please don't forget stop loss and capital management
When we reach the first target, save some profit and then change the stop to entry
Comment if you have any questions
Thank You

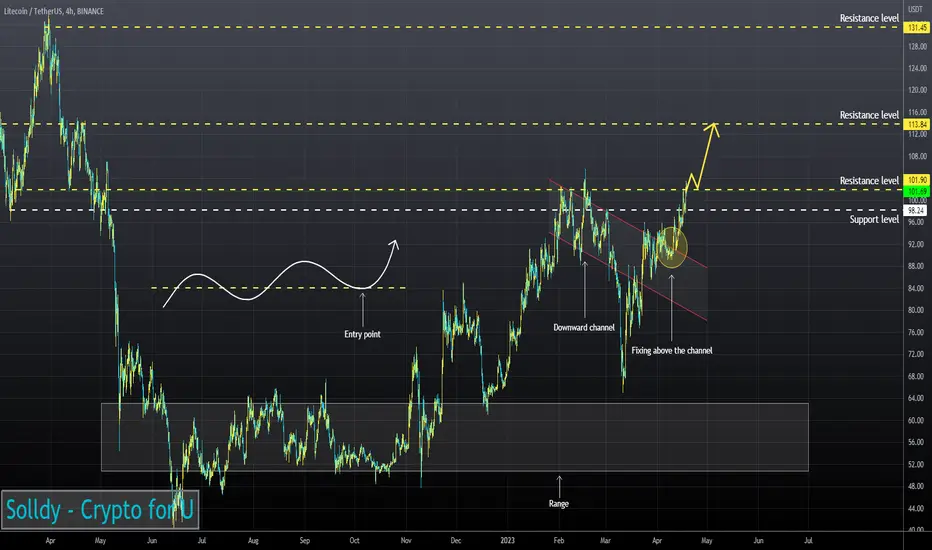
LTCUSD ❕ fixed above the downward channelThe RSI indicates the dominance of buyers on the 4H Timeframe.
Trading volumes continue to indicate the market's interest in price growth.
I believe that LTC will continue upward movement after fixing above resistance.
LITECOIN BITCOIN IS GOING TO EXPLODE! The Litecoin to Bitcoin ratio has been in a massive multi year falling wedge due to all these junk coins coming out and flooding the market. This caused Litecoin to fall on the back burner as many people are stuck on the hype of all the new junk out there. Non the less Litecoin is what it is and its true value is about to show. This wedge has broken after many years and for the first time a golden cross is about to happen which will rocket Litecoin to its proper LTC/BTC valuation. Also if you go look at the Litecoin wallet rich list, smart money has been accumulating millions of Litecoin for the past year in preparation while all the lemmings are buying Shib, XRP, and the like. Litecoin will lead this next Altcoin rally in gains and in adoption as people fly out of their shltcoins and get into assets thats are not securities. So many people are delusional in this space and believe all the hype around the crap that has come out recently as far as new cryptos. Almost nothing will survive the coming SEC purge of the crypto space except for Litecoin and Bitcoin and possibly a couple more. Dont listen to the haters, they are emotional because they are holding bags of dirty diapers and they think they will get rich when in reality they will all lose their shirts unless they get out before the herd and into the proven cryptos like BTC and LTC. Hold strong Litecoin fam, the day of reckoning is coming and we will surely be rewarded for our patience. This is not financial advice this is just my opinion. Thank you

LITECOIN LTCUSD IS GOIN TO $10,000 WITHIN THE NEXT YEAR!Litecoin has been in this Bull pennant formation for years and a break if this pennant will give a measured move to about $10k. This will happen extremely fast and will literally shock everyone in the cryptosphere. Lots of haters out there for Litecoin but thats ok they just dont understand how things work in this space. Let them buy their Shib, Doge, Matic, XRP, BNB, blah blah because at the end of the day they will be the ones to provide us Litecoin and Bitcoin holders with the blowoff and the liquidity to dump on their chins at the top when they mass exit out of 99.9% of the cryptos out there. The chart is undeniable, the pattern is undeniable and I am confident that Litecoin will be right under Bitcoin in short order. All these unregistered securities the noobs are holding are going to evaporate. The SEC will drop the hammer on all of them. Once XRP (the head of the snake) loses the lawsuit there will be a flight to safety within the Crypto space out of all those unregistered securities into cryptos that are not securities. Right now I can only think of two maybe three. Bitcoin, Litecoin, and possibly Digibyte but that one is debatable. Charlie Lee knew exactly what he was doing when he sold his bag of Litecoin. He knew the regulations that were coming. I also think Charlie Lee is the creator of Bitcoin as well or at least knows who it/they were. This is not financial advice this is just my opinion.
