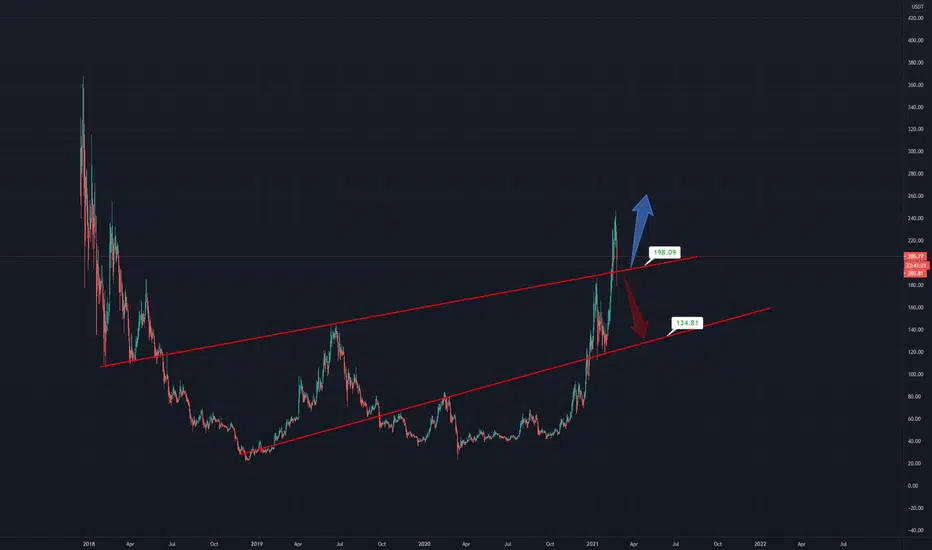
Litecoin Bears Are Heading For $130 Litecoin topped at $247.82 and it made a sharp decline which fits for an impulse wave (a) of a zigzag pattern. According to the Elliott Wave principle, a three-wave correction in opposite direction follows every impulse pattern before the price continues in the direction of the impulse move.
That three-wave correction is the short-term rally that took the price to $205.54 in wave (b). Now we expect the price to continue in the direction of the impulse in wave (c).
In a zigzag, wave (c) used to equal in size as wave (a), so targets below $130 area are plausible in wave (c).
What's your view on LTCUSD? Let me know in the comment.
Thanks for reading!
Veejahbee.
Litecoinforecast

LTCUSDT Litecoin comeback time!!! Experts please clickLet me know what you think about this. I got myself convinced, Litecoin new all-time high by or before May 01 of this year. Join the lite side folks, together we will contest Bitcoin. Not real financial advice, in fact I am still very new to all this, just here to dabble my feet and try to learn from you all. That being said, please leave any comments, questions, concerns, ideas, or anything you come up with in the comments. I love to hear back from you guys, I need critiques.

Litecoin - The good scenario and the badOur updated chart with very simple but major support and resistance levels. Price will soon pick a direction, either support and higher or very simply lower to previous support.
Hope it helps
Litecoin LTC Prepare For SellOffThe crypto market is living its last bubble days.
The prices do not reflect any fundamentals.
Cryptos are pure retail investments gambling at this point.
LTC Litecoin Market Cap $18,993,843,023
vs
Biggest German Bank, Deutsche Bank 23.864B Market Cap
Moderna - saves the world from Covid-19 - 69.146B Market Cap
Ebay - Market Cap 42.174B
FORD - 42.174B MARKET CAP
When you buy stocks of a company you own a part of it, you have the right to vote changes in the company and you receive dividends.
When you buy crypto you own nothing! You buy thinking that at some point another person will be willing to pay more than you on that piece of nothing.
If you want to own the BUY and SELL indicator in the chart, that can prevent you from the big crypto selloff, just leave me a message for a 7 day trial.

LITECOIN/USD: The price will GROW more inside its RISING WEDGE!Hi traders and welcome to my channel, if you enjoy my FREE Technical Analysis 📈 and Trading Tips 📉, support the idea hitting the LIKE 👍 button and don't forget to SUBSCRIBE ✔️ my channel, you won't miss anything !
🟢 Forex Pair :
LTC/USD
⚪ Technical Analysis :
Since February, the price has been following a clear uptrend, moving just around its EMA 200, forming an interesting rising wedge pattern. (See the rejections on its dynamic lines)
On the 20th of the same month, the price got a nice rejection once it reached its dynamic resistance line, falling quickly down until a support zone at about 221.25.
It is creating lower highs and lows, so there is a possibility of market's weakness, but don't forget that overall, the market is still bullish and the h1 time frame is full of noise!
It is currently consolidating between the two levels 221.5 and 231.1, almost closing its 4h session with a bullish hammer, so I'll be looking for a breakout of its resistance zone.
🔴 Conclusion :
Considering the bullish market, I'll be looking for a long position on this trade, so eventually I'll see a proper breakout of the resistance zone, with a closing upbar at about 233.8, I'd definitely entry long.
My target profit would be the level at about 257, up to its next resistance zone and the dynamic resistance line;
My stop loss would be at about 219.50, just below the support zone and its last low.
If the price will break down breaking through the support zone and the rising wedge pattern, this setup wouldn't be valid anymore.
Stay tuned for Updates and Trading Signals !
What's your opinion? Share your idea writing a comment!
⚠️ Please note the views are not investment advice and should be used only for educational purposes ⚠️
Trade Safe and Responsibly ,
Gianni

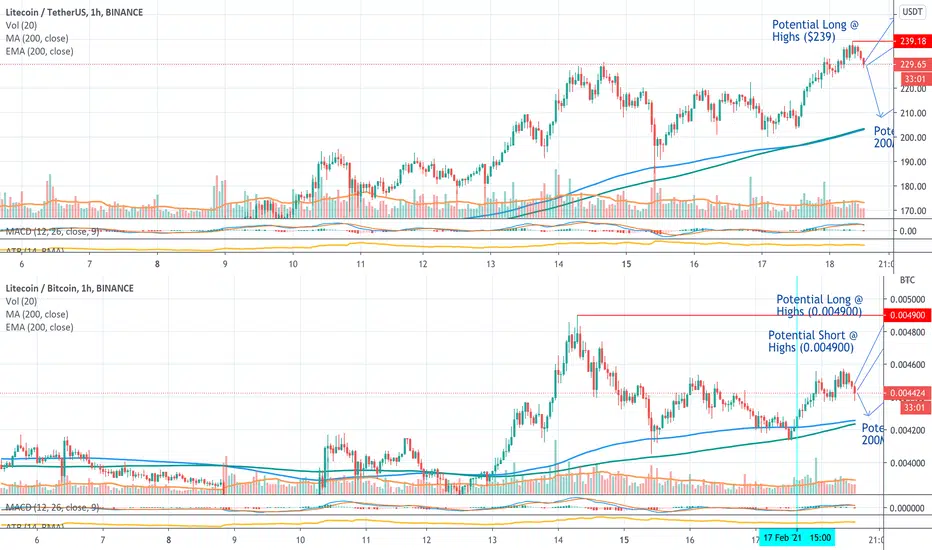
LITECOIN (LTCUSDT/LTCBTC) Daily Trade Setups 2021/02/18Hi guys! I will be sharing the trades that I take in real time, follow to see how my trades work out!
If you like this post, please support me by clicking the like and follow buttons. Also feel free to share your thoughts and analysis in the comments below!
And don’t forget to check out my daily analysis on Bitcoin & Ethereum!
Trade Setups
Below are the potential trade setups that I would be interested in trading:
LTCUSDT
Long Trade Setup #1: Retest and Continuation (200MAs)
1. Price Action: Price needs to move back down to the 200MAs, currently projected to be @ $205 by the time price reaches it, and bounce back up.
2. Trade Entry Confirmations: Bullish candlestick pattern, above average volume, MACD bottoming
Long Trade Setup #2: Breakout and Continuation
1. Price Action: Price breaks above and falls back down to $239 and bounce back up.
2. Trade Entry Confirmations: Bullish candlestick pattern, above average volume, MACD bottoming
Long Trade Setup #1: False Breakdown
1. Price Action: Price breaks below the then rapidly climbs above $239, forming a bear trap
2. Trade Entry Confirmations: A breakdown candlestick followed by a reclaiming candlestick, above average volume on both breakdown candle and reclaiming candle, MACD bottoming
LTCBTC
Long Trade Setup #1: Retest and Continuation (200MAs)
1. Price Action: Price needs to move back down to the 200MAs, currently projected to be @ 0.004300 by the time price reaches it, and bounce back up.
2. Trade Entry Confirmations: Bullish candlestick pattern, above average volume, MACD bottoming
Long Trade Setup #2: Breakout and Continuation
1. Price Action: Price breaks above and falls back down to 0.004900 and bounce back up.
2. Trade Entry Confirmations: Bullish candlestick pattern, above average volume, MACD bottoming
Long Trade Setup #1: False Breakdown
1. Price Action: Price breaks below the then rapidly climbs above 0.004900, forming a bear trap
2. Trade Entry Confirmations: A breakdown candlestick followed by a reclaiming candlestick, above average volume on both breakdown candle and reclaiming candle, MACD bottoming
About Me
I started trading in 2008, first got introduced to bitcoin in 2009, and have been actively trading cryptocurrencies since 2016.
I have worked on Wall Street trading bonds, stocks, and options.
I have taken hundreds of live trades, each recorded with over 50 data points, all meticulously analyzed, using data analysis and modeling to optimize win probability and risk reward.
Why Follow Me
Daily analysis on the latest market movements and price zones for high probability trade setups.
Sharing of live trades that I take.
A great place to help each other, learn from each other, and grow together.
Trading education including a comprehensive cryptocurrency trading eBook, personal advice, and other educational materials
Constantly testing and adding new trading strategies and refining battle-tested ones.
DISCLAIMER: I am NOT a financial advisor and this post is NOT financial/investment/trading advice. I will not be responsible for any actions you take based on the analysis and comments that I provide. I am simply sharing what I am doing, and is not meant to be investment or trading advice. What you choose to do with the information that I provide is your own sole responsibility! The cryptocurrency market is extremely volatile, and you WILL lose all your money if you are inexperienced! DO NOT risk any money that you cannot afford to lose and always be cautious and manage your risk!
Please support me by liking and following, and sharing your ideas and analysis in the comments! Thanks!
[17 Feb] Litecoin On The Run...Bullish ContinuationWe managed to see a rejection off a resistance level@228.80. I am expecting litecoin to make a short BEARISH retracement till 78.6 fib level (or touching my moving averages) before seeing a BULLISH continuation. This will be a BULLISH push for litecoin as it is building strength for a potential breakout, continuing its upward climb. I will be eyeing a 161.8% fib level as my TP level as of now as. This is subjected to changes as we head closer to the level. I will be updating on this post so do keep a lookout.
I will like to let you guys know that YGForex will be working towards providing cryptocurrency signal here for all of you guys. I will update daily and share my thoughts on it. This is provided we have opportunities to enter. Do follow our signal at your own risk. Do also keep in mind that we are not providing any professional financial advice.
Kindly hit the LIKE Button if you agree with my analysis and feel free to COMMENT your idea below. As for those who are keen to get daily updates and analysis from me feel free to FOLLOW me. Cheers and Happy Trading!!

LTC - 2h. Buyers kept of $192-196. The next target is $260After updating the local high on February 14 and testing the mark of $230.77, the LTC price began to correction. Buyers received a major blow in the range of $192-196. It is in this range on February 15 recorded large volumes, which sellers wanted to push the price lower.
However, as we can see in the chart, buyers were quite interested in this range . Completely depleted of sellers, buyers began a new attempt to grow within the black local channel. Confirmation of the continued rise in the price of LTC will be a retest the mark of $217.
If buyers can keep this mark, we expect to continue to grow to $250-260.
In addition, the positive dynamics in the BTC market contributes to the growth of LTC:
The critical point of this scenario is the range of $192-196. If buyers do not keep it on the LTC market, a deep and protracted correction will begin.
_____________________
We create both short-term ideas (for a local understanding of the market situation) and medium-term forecasts of price movements.
Subscribe to us and get daily concise analytics!

Litecoin want ATH LTC / USD
aiming at previous ATH
Last drop was very good retest at weekly demand in 185$-170$ area
I hope we hold weekly above that level so we can go to ATH soon and may be more++

LTC/USDT - the wake up of the Litecoin - potential 61% movementHello, Traders!
The asset has entered an uptrend.
The RSI on the daily timeframe got out of the overbought zone.
Consequently, we can expect a final wave of growth.
The entry in this wave of purchases can be looked for in the range of $ 190-200.
Place SL near under the price level of $165
Target prices will be Fibo levels:
$221
$235
$272
$309
Good luck and watch out for the market!
P.S. This is not a piece of financial advice but only a trade I would be following myself

LITECOIN - Our support levelsHere is our updated chart on Litecoin.
Support at 209 (mild) and 192 (Huge one).
Litecoin exists because of Bitcoin. If Bitcoin is Gold, then this is your Silver.

Litecoin & Tom Lee are about to explodeHi,
Take a look at this bullflag not bad
Market makers will probably leave Link or AAVE on the side a little !
Important thing to notice is that LTC confirmed support on the neckline and his ready to breakout soon.
Very very nice W pattern, juste take a look at your M Chart !
2013 bullrun hit 55$
2017 bullrun hit 421$ (4 years later)
2021 will go where? (8 years later) Mr Fibonnaci say around 1360$ (361.8%)
2025 will go where? (12 years later)
Neckline betweeb 121 and 146$
Take a look at LTCN new Grayscale Litecoin new products!

Litecoin - The Comeback of LTC Part I - BULLEESHHH PRICE FORCASTLTC, like before, has watched ETH and BTC moon without it. It wants some of the limelight. It is Litecoin's time to shine. I am going to send it from here- but do not let any freak pullbacks shake you out- as long as MTF trend confluence continues- This BEAST WILL RIP!!
Sincerely,
- SKYLOBSTER
*** This, as with any other content produced and shared on trading view, is not financial advice. Hell- In fact I wouldn't take financial advice from myself.
I did not like Trump very much, but sheesh WE CANT LET CONFEFE DIE.

LTC - PARABOLIC IN THE NEAR FUTURE !? Good evening,
I`ve been holding, trading, using, transfering, buying and loving LTC for the last 5 years, and I feel that I owe LTC some bullish cred. ! :
1. LTC seems to be very undervalued in the bullmarket we are experiencing right now.
2. It has all the fundementals of a proper cryptocurrency ,- and since both ETH and BTC ( from the original top 3) has set ATH it would be very likely that we will see LTC getting a significant boost in the near future.
3. The trendlines speak for themselves, and with LTCs seniority in this market it would be weird if traders and holders don`t appreciate it more in value as one of the leading cryptocurrencys that has done so much crypto-community.
Hopefully the trend continues so that LTC can get back to were it belongs - at 3rd place of the biggest cryptocurrencies !
Have a nice weekend, and good luck with the trading !!

Holding LITECOIN for the x2.36 profits this year! $500 per LTCPrice of litecoin making strong uptrend, but overall performance is quite smaller than other alts and btc.
On the chart I've found potential great opportunity for holding ltc for this year. I have compared performance with ethusd and look at the 3 horizontal lines
These 3 lines represent resistances and ETHUSD making moves ahead of the LTC, which makes me think we are still in the early entry for LTC.
So according to these lines, we going to see new All time High for Litecoin during 2021.
Also take a quick look at Moving Averages, they crossed on eth and it made the move, now on ltc same picture, moving averages crossing before the move...
Happy Hodling, make sure you following the risk management.
Stay safe
Artem Shevelev

LTC - Sorry love, I am out till you break this resistanceI am the type of guy who listens to the chart yet and then anything else.
I am out of Litecoin until it can break this bloody resistance.. Chart is self-explanatory
I rather wait and buy it again later. xx

LTC - 4h. Below $178 sellers will start the correction.The wave of rising LTC prices on January 27 gave LTC investors the opportunity to take 75% of the price movement. Buyers have managed to break the critical range of $178.5-181, but we are not sure that they will have enough strength to hold it.
This range is importan t because it started a powerful wave of falling LTC prices on January 10.
By the way, the goal of our previous idea was achieved:
Given that BTC updated its historical high and yesterday the producers showed that they are ready to keep the price, there is a high probability of the beginning of the correction in the LTC market .
The first target in this scenario is the range of $145-150 . The main condition for this scenario will be to fix the price below $178.5. The ultimate target of the fall is $124.
However, even in this scenario, the growth trend will continue. The correction will help buyers gain strength at more attractive prices
P.S. our global idea:
_________________________________
We create both short-term ideas (for a local understanding of the market situation) and medium-term forecasts of price movements.
Subscribe to us and get daily concise analytics!
.

#Litecoin - Looking for entry #LTCUSD #tradingviewLook for an entry point for the next upward movement.
Here is my view on this.
Watch carefully and make the best of it.
Have a nice start to winter, at least the first in 8 or 9 years here in Hanover.
Snowy and slippery greetings
Stefan Bode

A cup&handle seen in 1hr TF of LTC to go to MoonA cup&handle seen in 1hr TF of $LTC that could move it up to new ATH!!!
This scenario might only happen if #LTC will follow my chart idea...
Trade at your own risk !
This is just a chart idea...

LTC A Big Bull FlagThe price action still moving within $170 resistance and $140 support levels.
On the weekly chart, the price action has formed a big bull flag.
Within a bull flag, on the small-time period 4-hour chart, the price action of LTC is forming different harmonic moves, and as it has reached at the end of bull flag which is in fact a symmetrical triangle, therefore, a breakout can be imminent.

💡 Don't miss the great buy opportunity in Litecoin/TetherUSTrading suggestion:
. There is a possibility of temporary retracement to suggested support line (139.0). if so, traders can set orders based on Price Action and expect to reach short-term targets.
Technical analysis:
. Litecoin/TetherUS LTCUSDT is in a range bound and the beginning of uptrend is expected.
.The price is above the 21-Day WEMA which acts as a dynamic support.
. The RSI is at 55.
Take Profits:
TP1= @ 157.0
TP2= @ 166.0
TP3= @ 185.0
TP4= @ 200.0
TP5= @ 228.5
TP6= @ 255.3
SL= Break below S2
❤️ If you find this helpful and want more FREE forecasts in TradingView
. . . . . Please show your support back,
. . . . . . . . Hit the 👍 LIKE button,
. . . . . . . . . . . Drop some feedback below in the comment!
❤️ Your Support is very much 🙏 appreciated! ❤️
💎 Want us to help you become a better Forex trader ?
Now, It's your turn !
Be sure to leave a comment let us know how do you see this opportunity and forecast.
Trade well, ❤️
ForecastCity English Support Team ❤️

My love and personal plan for LitecoinHey folks, I'm sharing my plan for LTC
First I'll go into why I'm holding for the long term and then I'll
dive into my thoughts of the current markets and my short term set up.
First let me state Litecoin is one of my absolute favorite ALTs.
I've held a position in LTC since the 55$ level. LTC doesn't typically get
the hype/attention (or growth) like BTC or ETH but I believe it still has tremendous potential.
Why? Well gather 'round kids.
It's appealing to the new investor with the all too common "unit bias" issues with BTC.
It has practical uses, speed, support and a generous but limited supply double that of BTC.
While many coins have approached and surpassed their ATH, LTC has not
So new Litecoin investors will be happy to find themselves "in" early.
LTC is 140$ currently and that is still LESS THAN HALF of its ATH from $360 in 2017.
People looking for a little less volatility and a little more sustained growth I think will
find the community and supporters of Litecoin with open arms. And I only hope that LTC
won't come prey to these pump n' dump scams although.. it's a very real probability.
In this case I would stay very vigilant with dynamic stop losses as it goes parabolic.
To be honest If I see an enormous and quick rise in LTC I would likely transfer the position
over to bitcoin as the LTC/BTC market spikes for safe keeping rather than back into USD.
Now will LTC hit $360 this month?!?
Perhaps, but imo it's doubtful. But will it hit it's ATH gradually over this year or the next?!?
Well now we can start taking some small, but meaningful longs as the dips allow.
Slowly, but surely increasing positions and generating money that works for
you rather than explodes and vanishes....
I know DCA isn't the most exciting thing, but it works very well over time.
Now for the short term.
Currently Litecoin is trading at 140$ trying to push out of its weekly channel.
If LTC rejects the 150$ level I expect it to continue to oscillate between the $148-120 parallel channel pictured.
If my time allows I would sell partial positions to try and buy back in at the support. But I do plan on holding 85%
of my coins as day trading these levels could prove profitable however missing the breakout could negate these trades...
The support it holds at the $115-120 area is over a month long and well tested. Dips into these areas push me to
further my long position in small increments. Multiple candles below the $115 mark would to me signify a larger
push down to about a $100 and even less. I do not think this will be the case near or long term however it never
hurts to be prepared. My stop loss hovers near the 100$ mark which would still about double my initial investment.
These are my personal viewpoints and they remain flexible.
I hope you found them just a bit informative.
Cheers & Stay safe friends.
-Bruce

LTC is going to break the channel + PRICE LEVELSLTCUSD is waiting for the movement. If we break the triangle, we can go higher to $147 -$170. Be aware of false break out.
