LTC on the verge of a Breakout!!!!!Litecoin is in an ascending triangle and will soon see a breakout, watch carefully!
Litecoinforecast
Golden Cross of Litecoin ! #Litecoin #LTCHi guys, I know I have been mentioning Litecoin a lot in the past few analysis ,but I really see a Huge Potential here.
Lets keep it simple; EMA 20 is going to cross over MA50 very soon on 4hr time frame. When you look past the most recent month, there is about %10-%50 potential upside after this golden cross.
Make your own judgement. Some smart traders will join this ride pretty soon. Write this down my friends.
#Litecoin
COINBASE:LTCUSD BINANCE:LTCUSDT

Litecoin ready for the Bull Run. Are you ? ;) #Litecoin #LTCUSDLets get the Bull Run Started for Litecoin ! COINBASE:LTCUSD

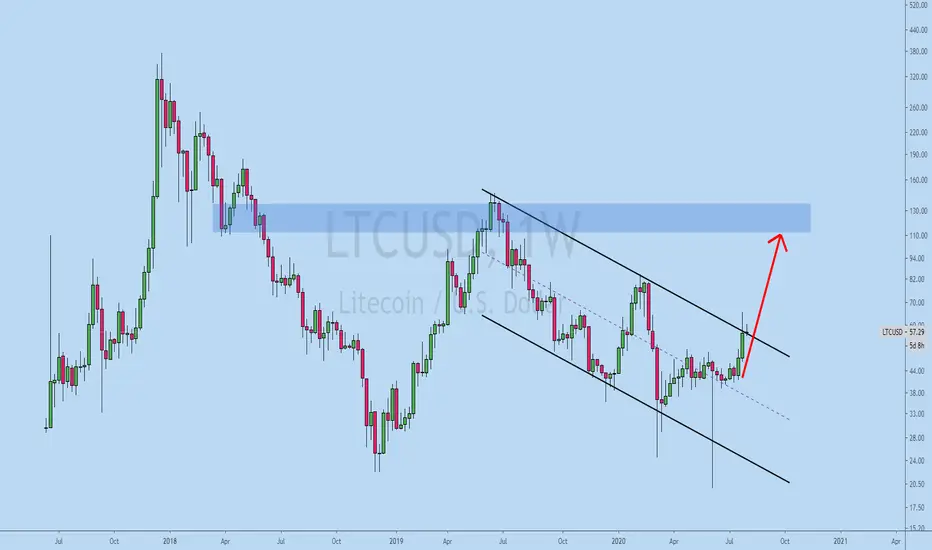
LTC USD Could easily triple from here LitecoinAs long as LTC stays above 49 dollar I can see LTC easily triple from here. The chart pattern isn't that bullish, and it needs to crack the trendline with a higher high. But LTC will be pulled up as soon as Bitcoin will make new highs aswell. Therefore I expect LTC could easily triple in the coming months.

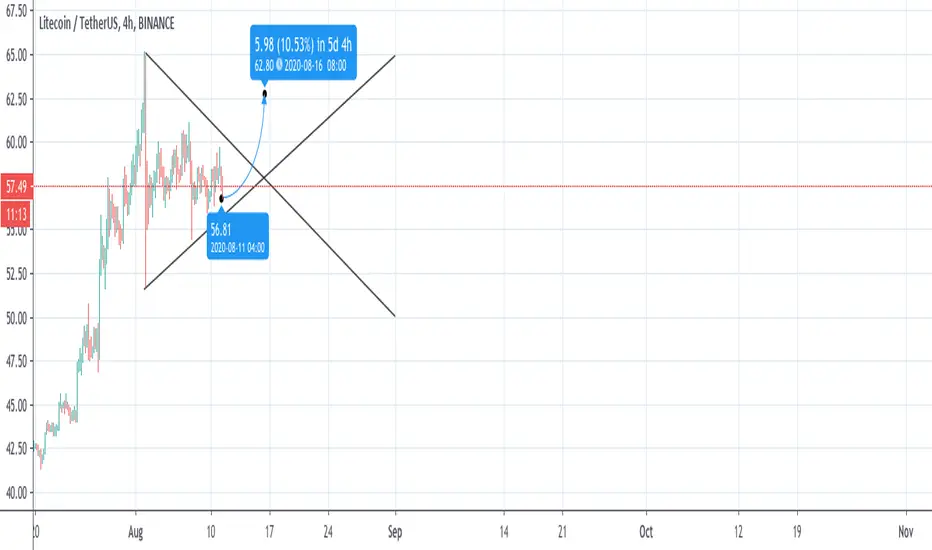
Litecoin RSI divergence signals uptrend 56 USD has been well defended and there is an RSI divergence in 4hr time frame. Time to push the price up Litecoin Marines :) Past 58.5 USD we will see a lot of shorts getting liquidated ;)
BINANCE:LTCUSDT
#Litecoin

Litecoin lagging behind but impulsive wave will follow very soonLitecoin has broken the daily descending structure so no more downside IMO.So If we consolidate above the market and don't go back into the structure we are totally fine.
The probability of going upward is quite high compared to a downside option but we always stay cautious of the bitcoin move so if bitcoin doesn't ruin the show, Chances of Litecoin to make an impulsive move is very high, keeping in mind the last time bitcoin was above 10,000$, Litecoin was above 80$.
So A 100$ Litecoin is on cards.
Short term Targets are
70$
84$
120$ BINANCE:LTCUSDT

Looking for the next Link right ? Hey guys, those who followed my previous analysis made quite a lot of profit. Especially on the latest Link Bull Run.
Now we are looking for the next alt which will return similar size profits to us. When I check Litecoin chart, all technical analysis give sign for significant a bull run. Here are my thoughts below:
Super Trend is Long in the daily time frame,
The price is pushing up in 4hr time frame and about to break up the Ichimoku cloud
There is a clear flag formation in daily time frame and close above 58.5 USD will break this flag up
I expect a good bull run to new ATH after this break out.
BINANCE:LTCUSDT #Litecoin

Litecoin given Long Signal !BINANCE:LTCUSDT has given Long signal in 1hr time frame. All techicals looking good. If momentum kicks in we will see 65 USD pretty soon !

Litecoin | Descending Channel Breakout..!!#LTCUSD (Update)
In Weekly Time frame Chart, LTCUSD Breaking the Descending Channel Pattern.
So far Bulls Looking Strong & If Weekly Candle Closed Above 60$ or Descending Channel Upper Trendline, Litecoin Might Boost Soon.
In Midterm (Bullish Case), It Might test the Major Resistance Area (Mentioned in the Chart)
Please like the idea for Support & Subscribe for More ideas like this and share your ideas and charts in Comments Section..!!
Thanks for Your Love & Support..!!
LTC/BTC LONG*Disclaimer* This is just my personal opinion on the market. Please due diligence before investing in highly speculative assets. Not financial advice.
With BTC reaching heavy resistance, we are starting to see a lot of money flow back into altcoins. Litecoin's RSI is currently trending upwards towards the mid-level which has formed a weak bullish divergence. Stock RSI also trending upwards. A weekly close above the moving average will likely bring in the necessary volume to move up quickly.
Feel free to follow me on my Twitter for the latest updates @psychedcypto, I actually entered LTC a couple of weeks ago but decided to post it on here as well since it began playing out excellently.
If this benefitted you please consider leaving a like and following for more to come soon.
Cheers, PsychedCrypto

LITECOIN GETTING READY FOR MASSIVE BREAKOUT BEFORE 2021Yeah, really, i hope you are ready for this move.
Looks like end of 2020 will be massive in crypto-gains.
Do not forget to buy low and sell high.
My personal levels for sell are on the chart.
chart patterns looks very attractive, you may notice how price forming triangle shapes on the way and creating one giant triangle for last year.
Current prices are quite good for buy and hold.
Using stop loss is recommended. DO NOT RUN IN BIG RISK. Trade wisely.

LTC/USDT: Daily Breakout Analysis 1D (Aug. 01)X Force Global Analysis:
If you find our analyses to be helpful, make sure to support us by dropping a ‘like’
In this analysis, we explore Litecoin's daily chart in order to assess its breakout pattern and potential targets by identifying resistance zones and using the Elliott Wave theory.
Analysis
- To begin with, Litecoin has broken out of a bullish descending wedge formation, similar to EOS
- Litecoin has been consolidating within this pattern for weeks before breaking out with immense bullish momentum
- The Exponential Moving Average (EMA) Ribbon shows a golden cross as Litecoin broke out
- Counting Elliott Waves, we can see Elliott Impulse Waves (12345) leading up to the descending wedge
- Within the wedge pattern, it consolidated in Elliott Triangle Waves (ABCDE)
- Having broken out from the pattern, it's anticipated that Litecoin would form bullish impulse waves once again
- While the trend is extremely bullish, there are some concerns as well
- Litecoin faces major historical resistance around 63.13 USDT
- The Relative Strength Index (RSI) is also extremely overbought
- The Moving Average Convergence Divergence (MACD) shows decreasing bullish histograms as it looks to potentially form a death cross
What We Believe
While the outlook on Litecoin remains bullish, based on current technicals, a small corrective wave is highly probable, considering the steepness of the rally. However, we believe that the bullish trend will remain intact, given that the degree of correction is not too severe.
Let us know what you think in the comment section below
Trade Safe.

LTC/USDT: A Slow and Steady Uptrend 1H (Aug. 01)X Force Global Analysis:
If you find our analyses to be helpful, make sure to support us by dropping a ‘like’
In this analysis, we explore Litecoin's hourly chart to assess its slow and steady uptrend, as well as significant support and resistance zones.
Analysis
- To begin with, Litcoin is trading within an ascending parallel channel
- Prices are hovering above the 20 Simple Moving Average (SMA), which is located above the 50 and 100 SMA consecutively
- There is strong support at 57 USDT, and 55.85 USDT
- Given that prices remain intact within the ascending parallel channel, we could expect a continuation of the current uptrend.
What We Believe
Just as many other altcoins, Litecoin is on an extremely steady rally, looking to potentially break through new highs. Technicals on the shorter time frames show signs of a steady yet bullish trend.
Let us know what you think in the comment section below
Trade Safe.

LTCBTC will tank again before sharp riseSomeone asked me if I could do an LTCBTC analysis, and here is my view.
LTCBTC has been historically on the decline. Ever since LTC was created, it kept falling behind.
At first it was the number 2 coin after bitcoin in marketcap, but it has been replaced by other coins.
And since LTC unfortunately does not have very unique features, I think this trend will continue.
So now that BTC starts its historic rise to 100-200k, what will that mean for LTC?
We will see a small rise now, but as BTC really picks up steam later in the year and early next year, LTCBTC will tank again.
LIke it did during the last two rallies.
It will make new lows. I looked at the historic chart all the way back to 2012, in LTCBTC it just keeps getting lower and lower, unfortunate, but that's how it is.
So now, we'll probably make a new low in the next 6-12 months, before the usual super sharp altcoin pump rise at the height of the bitcoin rally.
Hope this helps!

LITECOIN BREAKOUT|STUCK IN THE RANGE?
Litecoin has had its own breakout against the dollar, just as every other asset, as the DXY is falling like a rock.
However, as this breakout is universal, that means that it is a sign of the dollar weakness, not a sign of any particular strength of any asset per se.
That means that as soon as the dollar finds its bottom, Litecoin, having broken the resistance, might have a chance to get stuck in a range outlined on the chart.
Currently, following the range logic, the decline might proceed till the first minor support. Then LTC either bounces to retest the resistance, or the support fails and we get to see how the green line stands.
A possible long near the support line, a certain long at the green line, possible short at the red line.
Always try to wait for a confirmation.
Thank you for reading, like and subscribe and have a nice day.

LTCUSD has bounced from the supportHey guys and gals hope you are doing well and welcome to the new update on Litecoin. In my previous post I was expecting that the price action has completed the final leg of bullish BAT pattern. But the final leg retraced little bit more down up to 1.281 retracement level and changed its pattern from BAT to bullish Crab pattern. After entering in the potential reversal zone pirceline moved up by 15%.
Previouse post:
Current Crab move:
Finally priceline is moving up from the support of channel:
The priceline of Litecoin has also formed in up channel after the mid of March 2020. And since 26th of June the priceline was moving at the support. Now finally the price action has started upward move and likely to make another attempt for the break out.
Descending triangle and volume profile:
If we switch to the long-term weekly chart then LTC coin is also moving in a descending triangle. After taking bounce from the support on 9th of March 2020 the price action is moving at the centre of this triangle. After placing the volume profile on the complete price action moving within descending triangle we can get the reason why the price action is moving at this level. And it can be clearly observed that the point of control of the volume profile is at this level. Therefore the priceline is moving around this point of control. However, if we watch the trader’s interest as per volume profile then it is at $85. Therefore it will be easy for the priceline to move up to this level. And in order to reach at this level the price action will need to breakout the resistance of this triangle.
Conclusion:
As the price action has already bounced from the support of the descending triangle and also has taken bullish divergence from the potential reversal zone of Crab pattern. Therefore we can expect that the priceline of Litecoin can make further upward move to reach at least up to the resistance of the triangle. However, we should set our stop loss point at the support of an up channel that is formed on the daily chart. Because if it will be broken down then priceline can start a downward rally.

Litecoin may finally catch upIf you remember the recent crash, you would also remember that Litecoin was one of the main "Large-cap Altcoin" to bounce very strongly. Ever since then it has been rather laggard.
At the moment we have an interesting situation with LTC and it presents a trade. We are currently moving inside an ascending triangle on the Daily Chart which I expect to play out in order for this trade to be successful.
Entry: 46.91
SL: 41.11
Target 1: The Yellow downtrend trendline (Take 25% off here if in case we encounter strong resistance there. Move SL to entry.
Target 2: 68.14 Close the remaining position here. I suppose it will be a fast ride if we break through the downtrend line.
This is my swing position for this month. I will update if we reach targets or hit SL. Cheers and Good Luck!

LTCUSD a bullish reversal pattern is appearedHi friends hope you are well and welcome to the new update on Litecoin. The LTC coin is again at the support of the channel therefore in today’s post we will try to see whether it will break down the support or not and what the price action can do next.
Harmonic moves with consistency and continuity:
In my previous article we have seen that on the daily chart the priceline of Litecoin Is forming different harmonic patterns with consistency and continuity. 1st the price action formed a bearish Butterfly then the priceline of LTC formed a bullish BAT and after the completion of this bullish BAT the price action fromed another bearish BAT pattern and now the price action has again formed another bullish BAT pattern. At the moment the priceline is moving in the potential reversal zone since 11 June 2020. But we should set the potential reversal zone as our stop loss strictly because if the PRZ level will be broken down then the price action can move more down to form bulish Crab pattern.
The support of all SMAs are broken down:
If we watch the different simple moving averages with the time period of 25 50 100 and 20. Then it can be easily seen that the priceline of Litecoin has broken down all the simple moving averages and has no support of any SMA below the candlesticks. Therefore I would repeat again that we should take care of our stop loss and you can set your stop loss point at the maximum extent of potential reversal zone of BAT pattern.
Movement in up channel and EMAs:
Since mid of March 2020 price action is moving in an up channel and during this movement it is using the exponential moving averages with the time period of 10 in 21 as good support. At the moment price action of LTC has broken down these two exponential moving averages but having a strong support of up channel. If this channel will be broken down then a new bearish rally can be started that will take the price action more down.
On the long term weekly chart I am waiting for the formation of bull cross between 50 and 100 simple moving average. If we take a look back at 2016 to 2017. Then after the formation of the this bull cross if a strong bullish rally was started that led the price action to $370. And this is the highest price ever.
A bull flag between 50 and 100 SMAs was formed in Feb 2020. And after this cross we witnessed a powerful bullish rally in that month. But that cross was formed above the price action the difference between this bull cross and the previous cross is the previous bull cross between 50 and 100 simple moving averages was formed blow the candlesticks but current cross was formed above the candlesticks. If we want to see a powerful bullish move like we have seen back in 2017. Then we need this cross below the priceline. At this time the distance between the candlesticks and moving averages is very small. Therefore at anytime price action can cross up the moving averages and we can see a bull cross formation below the candle sticks.
Conclusion:
Even though the distance between the moving averages and the candlestick on weekly chart is very small but this is a fact that at this time the priceline has no support of any moving average on the daily chart. Therefore we should take care of our stop loss. However the BAT formation can save the priceline to break down the channel. And if the price action will take the bullish divergence from the potential reversal zone of the BAT then the price action can move up at least up to the resistance of the channel and that is at $50.

🔥 LITECOIN CAN GROWTH 🔥Hi, guys💓 Let's see Litecoin in the medium term ⏳
The price moves up in the channel.☝🏻
I think we can expect rise of the price up to $52 in mid-term perspective.
If you are interested in technical analysis, you should like my training ideas. 👇🏻👇🏻👇🏻
🧡Stay with me friends !!!🧡
I try very hard to be helpful for you, friends !!!😘
💎Stay with me dear💎.
Your Rocket Bomb🚀💣
My EDU posts👇🏻👇🏻👇🏻

LTC/MXN - LitecoinEsperando última bajada para entrar largos. A ver si me sale el conteo, si sale será un buen trade.
Vamoaver 🤓😜

Litecoin - Let's Long After Selling at $200 - LTC Silver HedgeBitcoin got its golden cross so Litecoin should follow. In 2017, Litecoin reached $80+ before Bitcoin reached $5,000. Bitcoin is now $8,800 after touching $10,000 so Litecoin should follow. If you trade BTC pairs, you know what is up. Mining BTC has become inefficient due to the halving. ASICs are now dedicated toward LTC. Once they have completed their accumulation process, they will use their Bitcoins to pump up Litecoin in the BTC pairing markets, triggering algorithms to buy LTC with fiat. Silver is already super bullish and forming a new base, let's start accumulating again. We probably won't be sell it again for $200+ like in 2017 since there is no more crypto frenzy, but since you can buy this in Robinhood, the stimulus checks may fuel the pump. The same traps from 2018 are still being played. This week, the institutions decided to release news about the Hong Kong protestors, making Bitcoin futures contracts super attractive on May 22, 2020. They then proceeded to dump Bitcoin during the weekend when nobody can close their position for profit. Now they will slowly prop up Bitcoin back over $9,000 as Asian Exchanges get propped back up through seeing the strength of Bitcoin. Once Wall Street opens, Bitcoin pumps and destroy all down contract buyers. No wonder Trump is so at ease and golfing so much during this weekend.

☆ LTC / USD — Litecoin Trading ☆Hello Litecoin traders and holders!
This forecast of possible positions for Friday 22 May.
Price of Litecoin possibly will rebound near $45 before move to $42 zone.
Do not forget, the best "Thank you" is ♥️Like and 💬Comment on this post.
On my opinion there will be good buy entry near support zone, and possible breakout from Dynamic Resistance over next week or sooner.
Thanks for reading, let me remind you about risk management:
DISCLAIMER: If you following somebody with good Risk/Reward and Win Ratio.
Without risk management and allowing yourself to lose some trades, you won’t be good trader/investor.
Please don’t follow any analyst blindly on this website.
Always use stop loss to prevent yourself from losses.
Make sure you understand and afford the risk. Please.
ATTENTION: Dear followers please consider to appreciate my ideas on tradingview with your likes, this will help bring more quality content in next trading ideas. And if new to my work, and you like it, you can Follow my page to receive ideas in your Ideas Stream. Thanks 🤝😊
Stay tuned to Artem Crypto

LTCBTC 1DAY: LITECOIN next desicion area or support/resistance?Hello my friends!
Right now the support is not yet confirmed. We can go siteways. At the end i see a target at 0.007200. The middle lines (orange and blue) has to be touched next.
Please press the LIKE button and give support by following me. Always do your own research before you trade!
--
To understand my chart here is a short explanation of my approach. I use self-developed indicators and combine them: 1. Blue Band: The blue band is a kind of Bollinger Band just advanced. The blue bands show the resistance resp. support areas. It is based on ALMA. Here, we trade from edge to edge over the middle line. And within the upper and lower area from edge to edge. 2. Orange Band: The orange band identifies dips and trend. The more the price moves to the outside, the more likely it is to be a dip. 3. Visible Range: In combination with VR, this allows the identification of the critical areas.
--
Let's see what happens.
Happy trading. :-)
--
