LTC/USD, trading Plan.You will learn the best place where we can trade Litecoin at low risk.
Write in the comments all your questions and instruments analysis of which you want to see.
Friends push the like button if you like the idea - that would be the best THANK YOU.
Thank you for your support, I Love it.
P.S. I personally will open entry if the price will show it according to my strategy.
Always make your analysis before a trade.
Litecoinforecast

Falling Wedge breakoutLitecoin has broken out from a falling wedge on the hourly chart
Looks very bullish
Litecoin long term symmetrical triangleLitecoin is in a long term symmetrical triangle, this pattern is decreasing the price range and volume. Usually symmetrical triangles break within 70% of it's body. We should look closely to this triangle as the price moves, chart is in log scale.

LTCBTC MACRO SUPPORT BROKEN?!?! POTENTIALLY NEW ATL'S IMMINENT!Things are looking VERY bearish for LTCBTC at this moment, with BTC having its pre-halving rally yesterday we have seen LTCBTC break its macro HTF Major support level at 5500. Looking left we have only ever broken & closed below 5500 SAT's on the weekly TF once in the history of LTC
If confirmed on the weekly TF, LTC may be looking to fall back further into the dirt potentially testing weekly order block between 3700->2800 SAT's
Previous prediction of LTCBTC bouncing off major support unfortunately did not play out. So looking at the next plays, once major support at 5500 is confirmed to be broken I will be looking for short opportunities once we retest that level of 5500 SAT's & confirm it to be new macro resistance.
Taking into consideration all possible indicators, although we have bullish divergence on CCI on 4HR TF, this data is potentially useless as it would be pending BTC's movement. Looking at past data any volatility from BTC in either direction usually means alts take a dumping.
Will be updating this chart once 5500 SAT is confirmed to be broken,
LEARN TA! At MBA we teach technical analysis from the basics up, learn to trade with our veteran traders with a community of 200+ other traders;
Link in profile description!

LITECOIN NEARING END OF MID-TERM BEAR TREND?!?! After a 31% Drop, looking for key structure changes in order to take optimal LONG positions!
IDEAL bull entries would be change in market structure, breaking of 4HR downtrend, retesting downtrend as support then consistent HH, HL's forming
Short term play is also possible looking for short entries at the top of the downtrends, remember trend is your friend until it breaks.
If long play is confirmed TP's on way up by looking left at previous structure would be 5945, 6000, 6150 & final TP's within daily order block between 6275-6400
Will re-assess with more analysis once market structure changes & price starts getting close to order block,
LEARN TA! At MBA we teach technical analysis from the basics up, learn to trade with our veteran traders with a community of 200+ other traders;
Link in profile description!

LTCM20 LONG Setup Perfect Entry: FOR 1:6 RRHello everyone welcome to this update.
I'll keep it short.
LTC Just broke out of the falling wedge channel which is bullish in nature We are witnessing a perfect retracement on the resistance turned Support trendline.
We can take a safe trade here.
#LONG ENTRY:
0.005905 TO 0.005915
TARGET:
1. 0.006054
2. 0.006120
3. 0.006206
4. 0.006285
STOP LOSS: 0.005840
Risk: Reward ==> 1:6 (Highly profitable)
Period of trade: 2 to 7 days
Portfolio Allocation: 2 to 5%
A perfect trade IMO.
Please hit that like button if you agree with this setup.
All the best.
#Peace

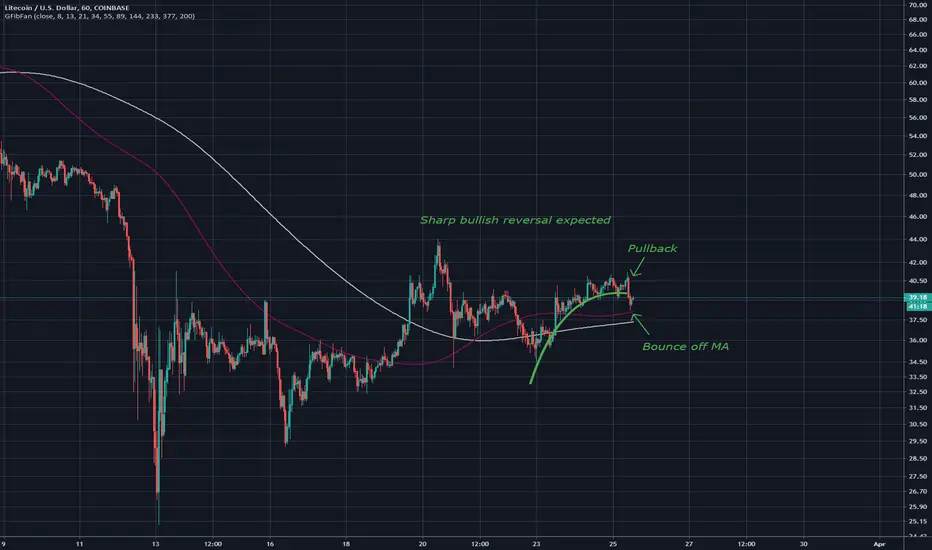
Litecoin: Parabolic Support Analysis 1H (Apr. 23)X FORCE GLOBAL ANALYSIS:
Litecoin has been showing a very steady price move lately. In this analysis, we assess the technicals for Litecoin (LTC) and its bullish and bearish probabilities.
Bullish Evidence
- We have formed a parabolic support on the hourly chart
- Prices initially created lower lows, until it transitioned into creating higher lows
- The Relative Strength Index (RSI) showed a series of uptrends and downtrend, and it has recently shown a breakout
- The Moving Average Convergence Divergence (MACD) shows decreasing bearish histograms and a potential golden cross
Bearish Evidence
- We are still creating higher lows on the price
- Should we break down the parabolic trend line support, the bullish case would be negated
What We Believe
Given that the parabolic trend line remains intact, we believe that we could see higher lows, and the formation of potential higher highs as well.
Trade Safe.

#LTCUSD ANALYSIS.. BROADEN THE PERSPECTIVE.. Big picture in #LTCUSD may be giving us important clues about price movements in the future.. I think it is meaningful to diversify approaches especially in the process we are in..
In the #LTCUSD monthly chart, Tom Demark has closed the red 2 last month, we can clearly see how the TD indicator has produced signals in similar situations from past to present, we can easily say that it is not positive for the medium-term.. Furthermore, Litecoin is below monthly ma20, this is also bearish.. In the chart, I expressed the price movements likely to occur within the descending triangle and falling channel.. My expectation is that the price will drop to $ 13 in the medium term.. We will wait and see..
You can find my thoughts about Btc and Eth in the link below..
Sometimes you need to break your knees a bit more to jump higher..
Disclaimer: I am not a financial advisor.. Please do your own due diligence when it comes to crypto-investing.. Never put in money that you cannot afford to lose.. Invest at your own risk..
I wish you all the best..

Long on LitecoinGood day everyone.
I like to keep it simple but as you can see, simple analysis is often the best. LTC/BTC is coming into some key support as shown on the chart.
The Simpleman, the Gatekeeper

LTCUSD Bearish Head&Shoulder Short OpportunityMore conflict move by BTC should dictate the direction this pattern will go.
disclaimer: Arrows in this chart don't necessarily uphold to it's wave.

Litecoin, Catch the Move!Best place ever you can catch to Buy Litecoin is the Range between 25-35 dollars per one LTC. I believe the bottom we will have in a few days. It's a strong and stable Cryptocurrency with a bright future! Invest now, take profit later.

LTCUSD forming bullish Shark | A good long opportunity aheadFormation of new Shark pattern:
On short term hourly chart the price action of Litecoin is forming bullish harmonic Shark pattern and soon it will be entered in potential reversal zone.
Buying And Sell Targets:
The buying and sell targets according to harmonic Shark pattern should be:
Buy between: $41.14 to $40.69
Sell between: $41.66 to $42.70
Stop Loss:
The potential reversal zone area which is up to $40.69 can be used as stop loss in case of complete candle sticks closes below this level.
Possible profit and loss ratio:
As per above targets this trade has the profit possibility of 4.93% and as per above mentioned stop loss, the loss possibility is 1.1%.
Note: This idea is education purpose only and not intended to be investment advice, please seek a duly licensed professional and do you own research before any investment.

LTCBTC forming bullish Gartley | A good long opportunity aheadPreviously on 8th Jan I posted an article where on 12 hour chart the Litecoin with Bitcoin pair was forming bullish Shark then finally the price action of LTC entered in PRZ area and produced more than 45% gains.
Formation of bullish Gartley:
This time on very short term 2 hour based chart the price action of LTC with Bitcoin pair is forming bullish harmonic Gartley pattern and soon it will be entered in potential reversal zone.
Buying And Sell Targets:
The buying and sell targets according to harmonic Gartley pattern should be:
Buy between: 0.006284 to 0.006260 sats
Sell between: 0.006303 to 0.006350 sats
Stop Loss:
The potential reversal zone area which is up to 0.006260 sats can be used as stop loss in case of complete candle sticks closes below this level.
This idea is for short term traders not a long term idea; I will be keep posting more trading ideas.
Note: This idea is education purpose only and not intended to be investment advice, please seek a duly licensed professional and do you own research before any investment.

LTCBTC formed bullish BAT | A good long opportunityHi folks hope you are doing good, in my previous idea of Litecoin with Bitcoin pair we have seen that the LTC had formed a complete bullish Shark pattern 12 chart. The formation of that pattern was started on 26th Dec 2019 and completed in 8th Jan 2020 and we have seen that on 8th Jan 2020 the price action moved up with the powerful divergence and produced more than 45% gains.
Another bullish harmonic pattern.
This time on 1 hour short term chart after successful formation of previous bullish Shark pattern the Lite coin has formed another bullish BAT pattern and entered in potential reversal zone and ready to move up at any time.
Let’s dig the pattern deeper to see how perfect it has been formed.
After initial leg (X to A) the A to B leg is retraced between 0.382 to 0.50 (here i have ignored extra spike) Fibonacci and then B to C leg is projected between 0.328 to 0.886 Fib of A to B Fibonacci projection area and last leg (C to D) is retraced between 0.786 to 0.886 Fibonacci and now entered in potential reversal zone.
Buying And Sell Targets:
The buying and sell targets according to harmonic BAT pattern should be:
Buy between: 0.006246 to 0.006225 sats
Sell between: 0.006297 to 0.006375 sats
So this very short term trade can be a good long opportunity.
Stop Loss:
The potential reversal zone area that is up to to 0.006225 sats can be used as stop loss in case of complete candle stick opens and closes below this level.
Note: This idea is education purpose only and not intended to be investment advise, please seek a duly licensed professional and do you own reaserch before any investment.

LTCUSD has completed bullish setup for big bullish rallyA powerful bullish signal 2nd time appeared in history of LTC:
In June 2016 there was first time in the history of Litecoin the 50 simple moving average crossed up the 100 simple moving average on weekly chart. And this golden cross produced really very powerful bullish rally upto 8000%. This year in Feb 2020 second time in the history we have received the same strong bullish signals that the 50 SMA has formed the golden cross with 100 simple moving average but there is some difference between the both golden crosses. When the 50 simple moving average formed the golden cross with 100 SMA in 2016 at that time this cross was formed beneath the price action therefore the candlesticks did not have the resistance of 50 and 100 simple moving averages above them. But this time the golden cross has been formed above the candlestick therefore we the priceline had a very strong resistance of these two moving averages and eventually the price action could not break out this resistance level and dropped down again. But there is a very strong positive sign that so far the 50 moving average did not form a death cross with the 100 simple moving average and both simple moving averages are moving sideways. But if the 50 SMA will again form a death cross with 100 simple moving average then it cannot produce very strong bearish trend because the distance between the both moving averages is very low. If 50 SMA would be coming from the long distance and form the death cross with the 100 simple moving average then it could produce very disasters bearish rally.
In 2016 the golden cross formed beneath the candlesticks
Current golden cross formed above the candlesticks and working as resistance
Second strong bullish signal:
There is another very strong bullish signal is appeared on very long term monthly chart. And that is the priceline of Lite Coin is hitting at 50 simple moving average support second time in the history of LTC. Even though this month we have is very strong long bearish candlestick but if we see the momentum indicator then it is still turning bullish and ignoring this bearish trend. And the stochastic has given bull cross from very close to oversold zone area.
Before this the price action has touched the 50 simple moving average on this monthly chart in December 2018 and after that we have witnessed a very strong bullish rally up to 563%. Therefore if price action will be able to cross up the resistance of 50 and 100 simple moving averages on weekly chart then we can witness same kind of bullish rally again.
A big descending triangle:
Now I am switching back to the weekly chart. And here we can see that the price line of LTC is moving in a descending triangle. The price action was entered in this triangle on May 2017 and at this time we can observe that the price line has reached very close to the support of this triangle and moving up now. If we more closely observe the priceline then it can be clearly seen that this time the priceline is not able to hit at the support even though it was moved very close to the support. And the reason is that when the priceline had hit the support in the past at that time the Bollinger bands was also at the support of the triangle but at this time the bollinger bands is above the triangle and there is distance between the bollinger bands and the triangle support. Therefore the bollinger bands has stopped the price action to reach up to the support. I've also placed the volume profile on the complete price action moving within this triangle and as a result we can see that the trader’s interest is up to the support and that is bit critical but the point of control of this volume profile is at $61.5. Therefore tere are strong chances that soon the priceline will be pulled back to the POC level of the volume profile. After that there are also chances that priceline will again make another attempt to break out the resistance of the triangle. We can also see that at this time the triangle is quite squeezed and the movement of the price line is also getting quite narrowed and this is the decision making for the Litecoin’s priceline whether it has to break down or break out.
Formation of harmonic Crab a bullish reversal signal:
If we switch to the smaller time period 2 day chart then it can be clearly examined that at the support of this descending triangle the priceline has formed a bullish Crab pattern. The priceline has just hit the spike in the potential reversal zone of this Crab pattern and turned back and entered in the Fibonacci projection area of A to D leg between 0.382 to 0.786 Fib projection. But I am expecting that this pattern will be helpful for the price line to move up even the priceline can cross up the 0.786 Fibonacci protection level. And once it will be able to cross up the 0.786 Fib projection then it can use this level as support and make a powerful attempt to have a break out from the descending triangle’s resistance.
Conclusion:
All indicators chart parent and signals are in favour of bulls rather bears. Therefore there are less chances that priceline will break down the support of the descending triangle. So we should be ready for big profit gains.
But the support of triangle should be used as stop loss because if this support will be broken down then there can be power bearish move.
Note: This idea is education purpose only and not intended to be investment advise, please seek a duly licensed professional and do you own research before any investment.

Litecoin intraday ascending scallopAscending scallop, after a small pullback in this pattern formation a strong bullish movement upwards should be seen. Hourly chart. Happy trading!
LTCUSD forming bullish Crab | For a big bullish moveHi Folks hope you are well, here I have found another profit potential trading idea and this time on 2 day chart the Lite coin (LTC) is forming bullish Crab pattern, we need some more drop and then soon it will be entered in potential reversal zone to move up.
Let’s dig this pattern deeper to examine how perfect this pattern is formed:
After initial leg (X to A) the A to B leg is retraced between 0.328 to 0.618 Fibonacci and then B to C leg is projected between 0.382 to 0.886 of A to B Fibonacci projection area and last leg (C to D) should be retraced between 1.27 to 161.8 Fibonacci then the priceline will be ready to take bullish or upwards move.
Buying And Sell Targets:
The buying and sell targets according to harmonic Crab pattern should be:
Buy between: $22.75 to $5.83
Sell between: $35.88 to $67.63
So this trade has up to 162% big profit possibility.
Stop Loss:
The potential reversal zone area can be used as stop loss in case of complete candle stick closes below this level.
Note: This idea is education purpose only and not intended to be investment advise, please seek a duly licensed professional and do you own research before any investment.

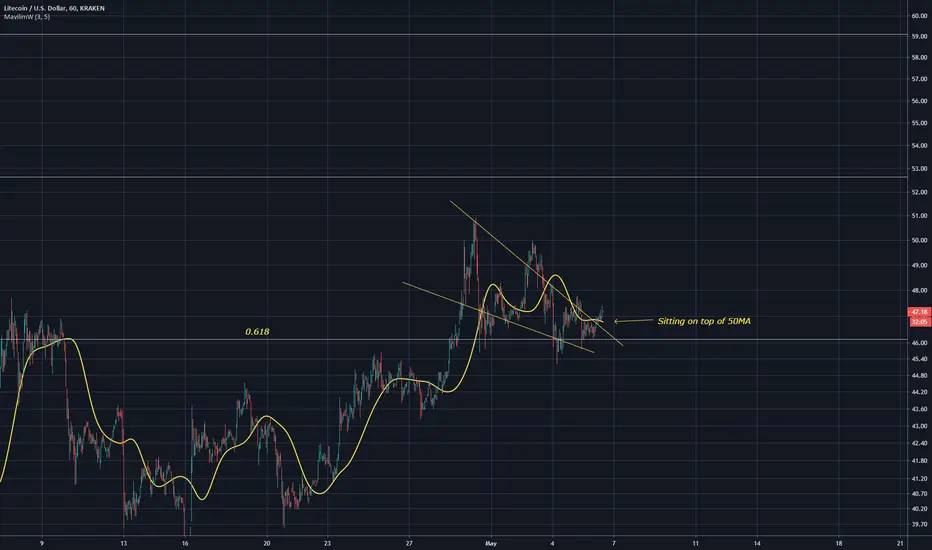
LTCUSDT 30% GainLitecoin is at the crucial supportzone of 46$-49$ Zone.
The recent Swing low from 83$ to 47$ was 78.60% retracement of the last Swing high.
If litecoin stays above this support zone between 46$-49$ and the horizontal trend support line for more than one day. We can buy or initiate a long position from this zone.

LITECOIN / U.S. DOLLAR (LTCUSD) DailyDates in the future with the highest probability for price direction reversals

Litecoin another angleGolden cross that has appeared on the weekly chart may produce large gains and result in a parabolic rally, two symmetrical triangles can be observed, both bullish. Will a third form? Maybe.. Included a fractal and possible pathing for a parabolic rally. Litecoiinnnnn.

LITECOIN cYpHeRLong term bearish cypher, easy profits to be made in the short term with a golden cross present on the weekly chart. This golden cross has proven to be successful on BTCUSD so why wouldn't it be on LTC? Best to go long. Included a fractal for the cypher not sure how accurate it will be lets just see how it plays out :P. I still believe ERC-20 Tokens and Ethereum will outperform BTC and LTC in throughout MARCH. Very nice range for trading. Potential for a lot of movement upwards.

LTCUSD formed bullish BAT | Upto 42% MoveHi friends hope you are well, here I have found another profit potential trading idea for you and this time I have found a harmonic move by Litecoin. The Priceline of LTC has formed bullish BAT pattern and entered in potential reversal zone and ready for bullish reversal soon.
Let’s have a look on the LTC move:
After initial leg (X to A) the A to B leg is retraced between 0.382 to 0.50 Fibonacci and then B to C leg is projected between 0.382 to 0.886 of A to B Fibonacci projection area and last leg (C to D) is retraced between 0.786 to 0.886 Fibonacci and now the price action is moving in potential reversal zone of this bullish BAT and now we can expect bullish divergence at any time which will lead the priceline between 0.382 to 0.786 Fibonacci projection of A to D leg , but if after this bullish divergence the candles sticks will be closed above the 0.786 Fibonacci projection area of A to D leg then it can also lead to the long term bullish move. We also have a 100 simple moving average in PRZ level that can be a strong support to push the price action up to 42%.
Buying And Sell Targets:
The buying and sell targets according to harmonic BAT pattern should be:
Buy between: $57.85 to $54.63
Sell between: $65.99 to $78.08
Stop Loss:
The potential reversal zone area which is up to $54.63 can be used as stop loss in case of complete candle stick closes below this level.

Litecoin Descending Scallop!Litecoin has formed a descending scallop on the daily chart, this is quite early in the formation but it looks to be forming it. Currently sitting in a weak regression uptrend, using this as a reference, it will most likely be broken. As said on chart any area here is good for a long entry. Still very cheap in retrospect.
