LTC LITE COIN LOOKS LIKE GOOD BUYLite coin looks like a good buy here we are still low on the RSI on the 12H and the Daily we are having a little bit of consolidation people profit taking after the quick gain today after the 69% pullback. Support is at 76 if this support line fails than cut loses quickly.
Litecoinforecast

Litecoin SHORT But Big Chance of Trendbrake has come in 1 HR #Litecoin #Bitcoin #Ethereum
Hello to all watching my charts
As update to my Chart from few hours ago
Litecoin is really the strongest among all cryptos at the moment.
There is only a small step to go, get over the bridge of 93.20/94.20 USD
Maybe it jumps really above theses resistance zone
and than we are in a long setup again.
Watch out !!
Good trades
If you want to support my work and my charts please like them..
Renkotrade

LTCUSD Litecoin SHORT but Chance of Trendchange Long#Litecoin #Bitcoin # Ethereum
Hello to all watching may charts
After the desaster in crypto currencys of the last days
we do see here a small chance of a new shorttime long trend in
Litecoin which is little bit surpising as Bitcoin itself
f.e. is not such strong here at the moment.
We have seen a higher High, but to confirm
as this crypto is still in my shartchannel capted
i want to see a rebound to the "Long Confirmation" aerea first.
Good trades
If you want to support my work and my charts, pleasew like them...
Renkotrade

LTC Litecoin Oversold Looking For The BounceLite coin is looking very over sold with many other Currencies It appears to be bouncing off resistance that was previously established. IF the bounce does not happen cut loses quickly and let your runners run!

Litecoin oversold, ready for explosive move higherGodmode looks oversold on the daily...very exhausted so there is high probability we see some upside by tomorrow or Thursday PST.

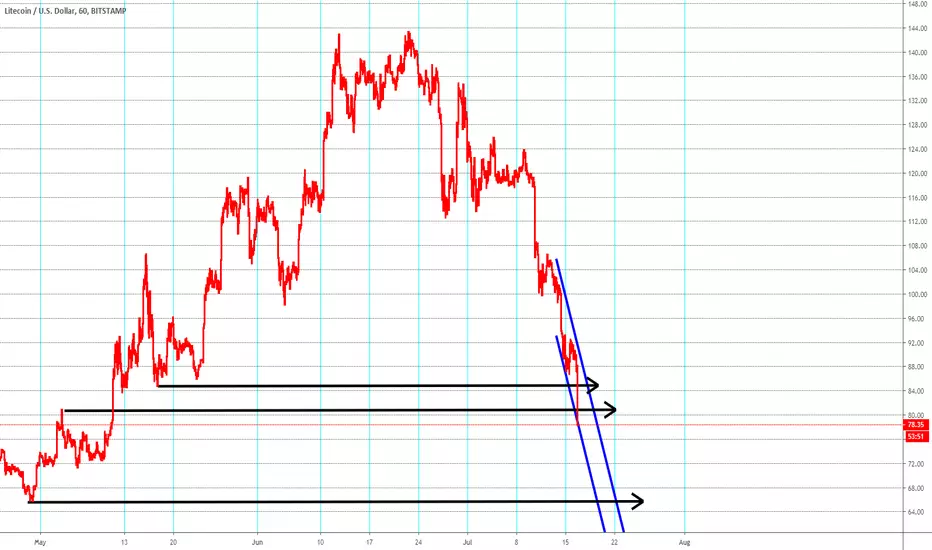
Litecoin LTHUSD SHORT All Supports Broken 1 HR Chart#Litecoin # Bitcoin #Ethereum #LTCUSD # BTCUSD
Hellot o all watching my charts.
Short is the game to play in all cryptos since some days.
I do hope you have followed ,my charts and have seen the sinals
yourself and are winning money.
Now one support after the other brakes , as i write that
next support have been broken.
Next Hold is 66 USD !!
Difficult to write that as the pair has traded as double
prices 1 week ago...
But only reality counts..
If you want to support my work and my charts please like the,
Good trades
Renkotrade
CUP AND HANDLE ON LITE COIN AND MANY OTHERS???I have been seeing this pattern again and again on charts.

LTC - Retrace to $90 USDLitecoin has resolved to the downside from it's symmetrical triangle (as i noted in my prior Litecoin article) and looks to be set to retest the 20 ma support on the weekly, around the $90 USD level.
Note that this point acted as must hold support during the 2017 bull market and i believe could very well do so again, at press time Bitcoin and Litecoin appear to be digesting their respective moves.
This is normal market activity, particularly given the rapid rise over the past few months, but bear in mind that for Litecoin the 20 ma on a weekly chart is must hold support (a close below on the weekly could suggest a steeper and more protracted pullback).
As always, stay disciplined

LTC Prj. 2019, P02E01, Correction is loomingObservations:
We have completed Wave 5, on the Elliot Cycle;
Daily Chart > No clear signal, but maybe slightly to the upside with the 2 Green candle sticks. Daily still bouncing off the 55 EMA.
4 HRLY Chart > RSI is bullish with some room for the upside, MACD confirms as well.
2 HRLY Chart > RSI\ACD is trending down, so we have more downs for now in the short period.
A 4 HRLY or Daily candle to open and close above $133 makes sense.
Longer term, I would suggest LTC it will retest the bottom support, approx, where the 55 EMA is.
So to conclude, we are still in the bull trend, but need more correction.
Cheers,
SS / Cryptoprospa
4 HRLY Chart
1 HRLY Chart

Litecoin SHORT Chance of Trendchange 1 HR Chart#Litecoin ##Bitcoin #Ethereum #Crypto
Hello to all watching my charts.
Today Litecoin tries to find a bottom at one of my support aereas
(Lower black lines)
but the confirmation is not there at the moment.
We do need a higher high and a jump to the BLUE ARROW AEAREA
Thats important, all other movements of Litecoin is simply
a bounce in the short trend for me.
Good trades
If you want to support my work and my charts, please like them ...
Renkotrade

Litecoin SHORT 1 HR Chart#Litecoin #Bitoin #Ethereum #Crypto
Hello to all watching my charts
Litecoin shows us now really weakness the last
1,2 trading days
Broke the long blacktrendline support (my black line)
and is now middterm and shortterm in a shortchannel-
I have not added in the chart the shortest timeframe
cause ist totally enclosed in the blue lines middletimeframe
Short
I have added 2 support aereas from march/june
at 98 / 100 USD where it seems to be the pair find support now.
But dont mix that up with a long chance
It will change to LONG only after a jump to the aerea
where my BLUE ARROW is
so with a jump above the latest high at 108 USD
Good trades
If zou want to support mz charts and mz work please like them
Renkotrade

Litecoin - Storing Energy for a Big Move? Litecoin (LTC) has managed to hold the 55 ema level for several days and as you can see from the triangle pattern forming, LTC seems to be storing energy for a move (either to the upside or downside).
On the weekly chart LTC has fallen back to the 9 ema, which has historically acted as the first line for major support, during the 2017 bull run LTC fell to the 9 ema and during more severe pullbacks, the 20 ma, a breach of the 20 ma signified the end of the bull run and a switch to a bear market. Needless to say these weekly levels are must hold points.
Rest assured i do not think a bearish reversal is on the cards, however bear in mind that a fall to the 20 ma on the weekly would entail a retracement back to the $90-$95 USD level.
The more likely outcome is that LTC could potential fall back to the lower trend line, or even slightly below, before a bounce and a continued rally to the next Fib level around the $170 USD mark. This pullback pattern has occurred before (circled area).
Keep an eye on LTC, as the chart is suggesting that a major move is on the cards and my guess would be that a slight dip to the trend line, followed by a move higher is more likely.

Litecoin LTCUSD UPDATE Trendchange to Short 6:00 p.m. 1 HR Chart#LTCUSD #Litecoin #Bitcoin #Ethereum #Rekotrade
Hello to all watching my charts
I just write these words here and same time LTCUSD Litecoin
has just fall out of my long channel in blue and sit on the last support line i have
drawn in black.
I daubt that the pair will recover soon and see a 60 to 40 chance
of falling further down
In best case we will have a sideways turn staying in my bluechannel which is
little bit long, but f you check the angle, these is very very weak
So be cautious with longs, i suggest NOT to buy on dips here
as we have lower lows and lower highs which in my oppionion
is a clear sign of short.
At the end, if it is fallen down to my purple arrow it is short shure
Good trades
If you want to support my work and my trade, please like them..
Renkotrade

Litecoin LTCUSD LONG 1 HR ChartHello to all watching my charts
Litecoin LTCUSD is similar to Bicoin at the moment on a run move long.
THe charts of these pair is much stronger than Ethereum ETHUSD
Both of my trendchannels are showing a long rund
AND the shorttime channel which shows us the next direction at first
is getting up an up, so showing us, that the long trend is very fine.
I do hope you are in a long position
-
-----
Here a additional info for all who ask me to draw other lines..
My channels shown here in the chart are NOT manual line draws from
high to high and low to low.
They are the resulat of a complex mathematical system, which is my personal
trading system, and they have different timeframes have also adjustable
different deviation in % from the actual price as forecast
ALSO they change the forecast ever TICK in Realtime and calculate the channels new.
-------
If you want to support my work and my charts, please like them..
Good trades
Renkotrade

Litecoin LTCUSD NEUTRAL 1 HR Chart possible trendchange to Long#LTCUSD #BTCUSD #ETHUSD
Hello to all watching my charts.
Lets today have a new closer look to Litecoin LTCUSD
2 things are to mention
1. We are with both channels again in a short situation
2. At the moment i write this down we have a chance for a new setup
to long IF:
At first resistance 122.60 will be broken
(first resistance from yesterday post has been taken out
118.00 BUT than we unfortunatley have seen a fall with a lower low)
(my higher black line ) AND of course
we will not see any lower lows in the meanwhile
or in other words
The lower black line must hold.
And the blue trendline long which is little bit broken must be
entered to higher prices again.
I am afraid the last condition will be not set up
and the pair will stay in my short channel to lower prices.
Than next hold would be (low from yesterday) 113.00
and also lows from 28.6. at 112.00
below that we wil nee a nirvana..
Under the line: The Setup is very unclear.
If the pair will start to my blue arrow aerae of course
we wil be in long status again.
Good trades
If you want to support my work and my chaerts, please like them...
Renkotrade

Litecoin LTCUSD LONG in my very shortterm channel#Bitcoin #Ethereum #LTCUSD
Hello to all watching my charts
Nice situation here in Litecoin today
As showed yesterday we have made the move above 118.00
(you remember the arrow and my update ? )
and in the very very shortttime channel we re now in a long situalation
Now everthing depends on whether the support at 114.50
(lower black line) will hold or not.
IF ! it hold "stay long" or "go long" would be to shout
BUT be careful, the timechannel is extremly shorttimed
so the chance that it hold or not is even 50: 50
Will the low support fall, we will be back in short terratorium at once !.
Good trades
If you want to support my chart and my wokr, pleas like them
Renkotrade

LTCUSD SHORT Till MIN 112.20 or much worst#Renkotrade
Hello to all watching my charts,
In the fall of all crypto currencies there is one crypto which seems to me
one of the worst and so one of the best short trades.
So lets have a look at
Litecoin / USD = LTCUSD
The pair had had found af fine bottom at 112.20 and started an impresssive rally
from this point to nearly 134 which is 20% up !
Than we had seen unfortunately broke of one support after the other.
First 127.50
Second 127.00
Third 125.80
In additon the trendline long brake
(All these breaks to the low i have marked with black lines here)
If now if you will go long , for a trendchange we must see
minimum the 115.00 in 2 days
or thats the opposite scenario , if the last support at 112.00 will break
the pair will be traded much lower in my eyes.
So be carefull with long engagements here,
check the next days and we will have a decision here.
Good trades
If you want to support my woerk and my charts , please like them...
Renkotrade
But than in the fall of all cryptoswe have now a fall below 3 supports
(sown in black in my chart) and after that no botom is to see.

LTCBTC completed the gartley | Upto 78 percent profit expectedBy the grace of Allah the most high my previous idea of LTCBTC:
Generated more than 32 percent profit.
Now the price action has completed a bullish gartley pattern.
We can see the price action is also in a wedge and it has hit the wedge's support.
The volume profit is showing a very weak interest of traders at this area.
We have also a 50MA support on week chart withing the potential reversal zone which will be very helpful for price action to hit the sell targets soon insha Allah.
The targets are:
Buy between: 0.011490 to 0.009465
Sell between: 0.013084 to 0.016912
Regards,
Atif Akbar (moon333)

Litecoin , buy now using FIAT.Just got home and ive noticed a nice opportunity on litecoin.
I did buy litecoin using EURO, or FIAT.
Definetely i wont convert or buy bitcoin now.
I ll post it here when i close it.

Litecoin - Consolidation for the greater goodLet's get right to the chase. This consolidation period is where you should be buying Litecoin in huge bulks. Take a step back and think about how the institutional traders are buying into Litecoin. They are not looking to pump the price, which means they have to buy in areas of consolidation.
Litecoin has been consolidating for the last week, and there is no sign of downward pressure which is going to rock the boat. You also need to remember that Litecoin is a significant stable cryptocurrency for transfers.
Conclusions: Do not worry about the entry price for a longer term hold on Litecoin. Price is currently around $140, and while we are under $150, this is a great time to buy more Litecoin. $137 or below is my current value area for Litecoin, and as we have seen no action over the weekend, I would assume that we have another moon launch coming.
You can now join the private IONIC Capital telegram group, where I am building an open community to talk about investing and capital preservation.
IONIC Capital Telegram
Plus, check out the blog, remember to like this post and follow me on Tradingview.
LITTLE BIG MOVEMENT LATEST BLOG
"Patience is the key to any market" - Nathaniel.
Thank you for your love and support.
Regards
Nathaniel - "The value Trader"
Little Big Movement / IONIC Capital

LTC LONG LTC
Looks strong; I like how it reclaimed that 0.013 area as support.
Two areas I think will act as resistance are the FTA (also the 0.382 fib level), and the breaker at R1. Invalidation on a daily close beneath green support.

When we break through the red channel, we go much higher! After we break the channel, we go higher.
Halving pump coming too. :)

Litecoin Accumulation Phase - Be Ready for the next waveMost traders are prone to hating the accumulation phase of a market because there is no clear sign which way the market will go. If you look at any market which is related to currencies, the accumulation phase is the best time to buy or sell. Sideways price tells me one thing - " buyers and sellers are equal". Now at this point, you might be thinking, "well, that is not going to help me" but it will. What you need to remember is Litecoins price has not dropped below $85 since the $100 high. Whales love to swim in the deep waters with vasts amount of liquidity. This provides them with the best cover to hide their big trades without moving the price of Litecoin. Have a look at the current value area (green box) between $90 - $80, if you are looking to buy at the best price. its possible the price will not drop below $90, try to position a trigger trade if price breaches $95. We will retest the $100 again so don't doubt this uptrend.
LITTLE BIG MOVEMENT LATEST BLOG POST
"Patience is the key to any market" - Nathaniel.
Next update will be next week - Thank you for your love and support.
Regards
Nathaniel - "The value Trader"
Little Big Movement
