Litecoin Intraday AnalysisAn interesting intraday set up for this coin could happen soon ,price just formed a double bottom on a strong support and Mp´area giving us as results a strong bullish candle ,so theres two possible scenarios for this coin ,first one would be where price close below the Mp point (50.64) in a daily timeframe or multiple closes below it in the lower timeframes to go short or where price close in the same tiemframes above 51.30 to go long
Litecoinforecast

LTC Prepping for a massive moveWe have been long from $55. LTC has had this broken wedge probably for the longest period of time. We have carved a bottom out at this $50 area.
MACD has crossed to the upside and is looking to build momentum. Once we break above this $70 zone, we will be moving much higher.
If we use Fib's for our targts, the first target would be in the 175 zone. We'll gauge once we break 175 to see how fast and high we go up.
Happy hodling,
-Sherem

LTCBTC (D): So I was just wondering why not buy Litcoins?Is now the time when Litecoin is growing faster than Bitcoin? The TA looks good.
Let's see what happens. Happy trading. :-)

LTC getting ready to take off! Ride the BullAnalysis:
Correction ended, and accumulation nearing final phase. Inverse "FatBart" Head & Shoulders seen.
Entry Point:
General Entry is this range is fine, just look for a local dip/low. Looking to go long in the range of 9200 to 9275. See detailed screenshot below, using Bottomfinder to find best local entry.
Take Profit:
The green lines represent target take profit levels. We suggest cashing out 10% at T1, 35% T2, 50% T3, 5% T4 (or let it ride if it still looks bullish ).
Stop Loss:
Stop Loss suggested at 8800, which is below the liquidity pool and 3 established local support levels.
Upon completion of T1 move stop loss to entry point to secure a risk free trade. Additionally continue moving stop loss up by one target each time a new target it reached. i.e. when T2 is reached, move stoploss to T1 level.
This way you can ride out dips with no anxiety and automatically exit the trade in profit should you not be around to monitor!

LTC 50MA Dictation..LTC continues to be dictated by the 50MA and as we can see a possible downside leg is soon as the 50MA comes closer to become even more of a resistance.

LTC Outcome..After the Loss of 10 Billion in the market, the final push towards the downside is on its way. After Litecoin lost its support we could be heading down to a new low of $44. This support is a very major level and i do believe we could even break this and head towards $39.

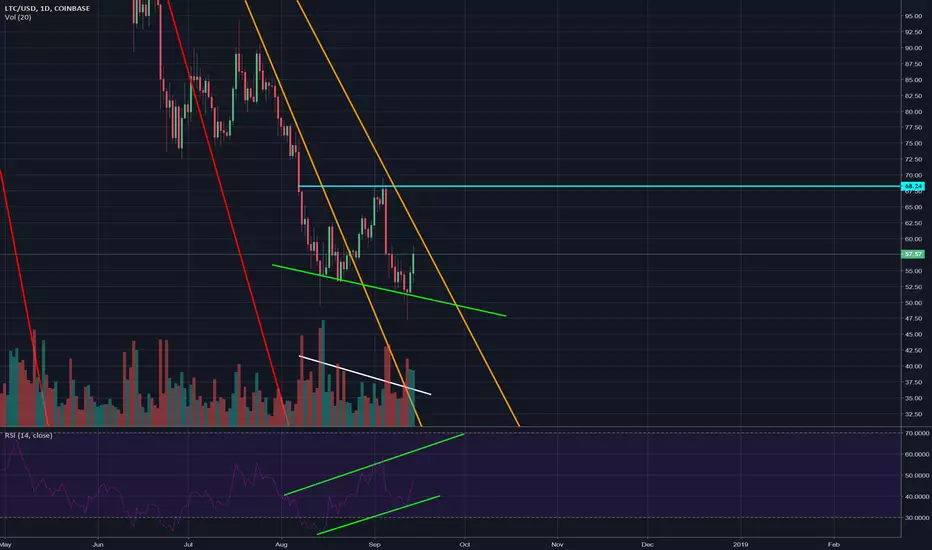
Litecoin: Bull Power vs. Bear PowerAs I have mention in my bitcoin analysis, there are a lot of bullish divergences occurring on the daily, big ones, however, I do not know the strength that each of this coins have to fight the possible trend of bitcoin or if they have enough strength to pull bitcoin out. So, this is definitely an interesting situation and it would surely display which of these coins have most of the power. But given that bitcoin is king, I don't think these divergences would go too far.
Litecoin Analysis:
1.) There is a really strong double bottom pattern. It looks like it is a possible eve and adam double bottom, where the first bottom is more rounded and the second bottom is more of a sharp "V" shape. The buy volume picked up really well especially after the hammer candle stick that occurred on the second bottom, and there is really a strong daily bullish divergence occurring in the RSI. However, a divergence does not always mean that the trend is over, and it may pick up in the bearish direction, the weekly RSI still looks extremely weak and it as well as bitcoin may hold Litecoin's price down. The confirmation line is around 68 which means that the price would have to cross that on extremely high volume to indicate a change in market direction.
2.) Litecoin may also get rejected at the orange trendline, which is the second trendline of my second fan principle that I have created for litecoin. At this point I do believe that it is possible to see three different fans occurring. In addition when litecoin hit 50, it did not hold its ground so well despite being such a strong support which does indicate weakness.
3.) Finally bitcoin's dominance is increasing, and during a bear market like this, it can signal both a flight to safety and people exiting the market, so an analysis of these alt coins even the top ones, may not always indicate market direction especially since they have less than 50% market dominance.
LTCUSD 4hr LongPredicting a long trading opportunity on the 4 hr chart. Play breakout. Resistance trend line for 4 hr and daily drawn. However, I expect a move to 85$

Possible LTC route - Sept/Oct 2018Resistances will prove to be tough in Litecoins uphill battle pending possible reversal confirmation. After hitting a low in the .008 region, I expect to see slow climb to .01, denial and the continuation into the .011 region + over the coming months. This is with the bias that the market has recovered and is moving sideways/accumulating for the next 2-3 months.

LTC NEEDS BUYING SUPPORT.
LTC has broken out of the corrective triangle it was stuck in, and is now formed a short-term double bottom above the triangles top line. This normally indicates a break in trend, along with the completion of the abcde pattern.
With some additional buying volume, ltc needs to push passed the $66 price level in order to test higher resistance levels around $76. With potential engulfing on today’s candlestick, we can look for another retest of the top trend line of the triangle before another push forward.
LTC has been above the 125 EMA for the last 4 days, if the top triangle line is broken as support, look for a bounce on the 125 EMA.
Please ignore the bottom indicator, it is simply used for BTC charting.
This is my personal opinion, this is not investment advice, invest at your own risk and good luck trading.
LTC current price 65.48
COMPLETED 4:50PM LOS ANGELES

LTCBTC possible bounceIndecision forming on resistance, if next candle breaks previous candle high could be a new bounce

LTC / USD#Litecoin can withstand this downward wave ?
My personal opinion . Yes he can
Let us see what happens in the coming days

#TLC#LTC Litcoin looking bearish on the daily w/ the head and shoulders and failing support on the fib.
I personally am closing my #LTC position now.

LTC target 50-60 If the market is unable to find buyers and brake 78-82 resist , then we could see market fall into 50-60 area.
Short at 80usd and target 55usd.

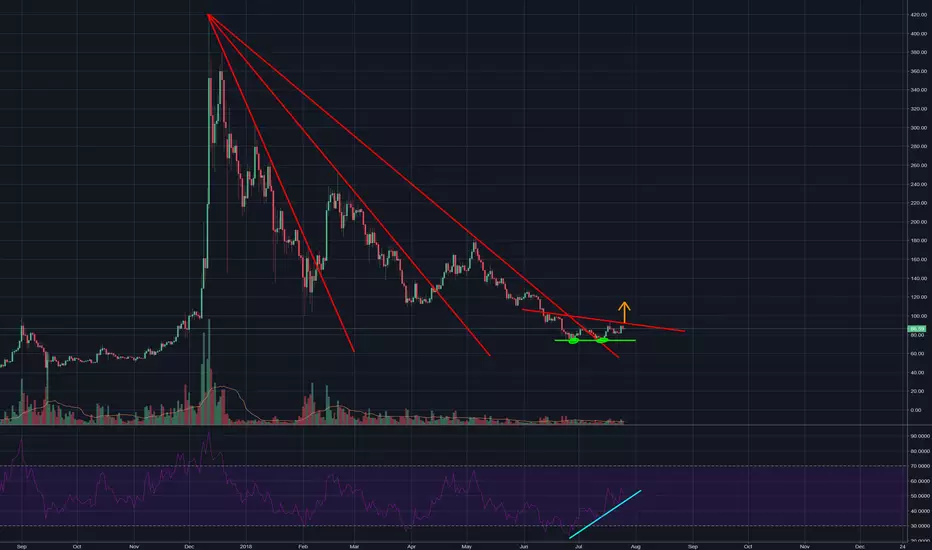
Will Litecoin Get Slaughtered like Other Alts?No, it is unlikely that Litecoin will get slaughter like other Alts.
It appears that Litecoin, some other coins has had a double bottom head on an inverse head and shoulder bottom, and it appears like the better altcoins are popping off at different times which makes me think that it is completely possible this is a total cryptocurrency trend reversal with bitcoin leading the way and the better altcoins following while the bad ones are eating the dust. One thing that I have noticed more and more is that a bullish RSI is taking place so there are strong bullish movements occurring and this can also be seen in Litecoin. A bullish divergence is occurring. That's just in terms of the RSI, the 3 red lines that are coming from Litecoin's ATH, is what is known as the Fan Principle, and it is a form a trendline analysis when analyzing a reversal pattern, and currently Litecoin looks longer term bullish because it has passed three trendlines of resistance. The only thing that Litecoin is waiting for is its moment to explode through the neckline of the inverse head and shoulder pattern.
Key Points:
1.) Due to the Fan Principle, Litecoin looks like a longer term bullish investment if it can passed through its neckline and I will assume that it will. The crossing of the third resistance trendline also means that Litecoin would be a better longer term investment, possibly to new all time highs.
2.) The inverse head and shoulder has a price objective somewhere around 120-130 and I believe that it is really likely that litecoin will explode out of the neckline on higher volume.
3.) These coins are popping off at different times which makes it easy to move between them and gain the benefits of multiple runs.
I hope everything I am doing is really helping the community, I am new to trading, but I have done a fairly decent job, thanks for supporting me!
Best of Luck: Trade Smart, hedge risk, and Make Some Money!!
LITECOIN: CRYPTOCURRENCY MASS ADOPTION APP? - PROFIT = 10.53% !Our "Crypto Bottom" Trade Indicator has identified a buy in point on the 13th of July 2018 .
Using this buy in point and selling at today's peak price a you would have expected to net 10.53% PROFIT!!!
The increase in price may also be explained by positive developments including:
July 17: Tokenpay Swiss AG has officially confirmed that it has acquired a 9.9 percent stake in WEG Bank AG in partnership with the Litecoin Foundation. The terms of the agreement will also include options to purchase approximately 90% overall of the bank, pending the customary regulatory approval.
July 25: Flexa has launched its closed beta allowing users to load up on Litecoin and pay for items at stores like Starbucks and Nordstrom without having to manage cryptographic keys.
The price increase is the result of a recovery in the overall crypto markets and the positive developments highlighted above.
***The "Crypto Bottom Signal" and "Crypto Peak Signal" used in this analysis is included as part of the Crypto Trade Signals subscription (check my signature for further details)***

LTC at the bottom?
LTC is showing exhaustion in its bearish move for continuous of 9 weeks of downward movement. TD indicator is showing TD9 perfected buy on LTCBTC Chart, Macd is still above 0, and we are still above the 200ma on weekly chart.
I'm going long here on LTCBTC.
Stay tuned for more updates


LTC-USD Market Analysis - 17 June 2018LTC has been moving inside the Descending triangle pattern since long and finally fell downwards.
The first good resistance lies in the $112-$118 zone.(10% up or down maybe).
Getting back to the current situation. The price is around $95. If the price falls back further to the upper level of the next possible support($85-70) and rebounds from there to the next possible local fibonacci level of around $108, which is rougly equal to a gain of around 20-25%.
EMA + RSI
EMA and RSI lines are nearly about to converge. So, we may have a potential BUY signal soon.
Note that nothing can be stated about the strength of the buying signal. Keep an eye on other indicators too like the Volume to know about the strength.
I have smoothed out the EMA over RSI. This is done in order to vercome choppiness and get better entry and exit points.
Just remember this always that ,
If the RSI line(White) is ABOVE EMA line(Red) = BUY
If the RSI line(White) is BELOW EMA line(Red) = SELL
WILLIAMS ALLIGATOR
The Williams alligator shows signs of further downward movement. Since, this is a lagging indicator, this sign is justified due to massive bearish trend which started on 6th May.
Also, just remember that when the order of line is :
1. GREEN > RED > BLUE = BUY
2. BLUE > RED > GREEN = SELL
MACD
The lines seem to be converging which will result in a BUY signal. Though, at this moment they are really far from each other and any kind of massive selling may push these away further.
Note that, the MACD is converging inside a symmetrical triangle but still needs more time for development.(Will focus more on this in my next update).
ADX AND DI
-DI moved above +DI on 15 May which marked the onset of Bearish movement. Currently, -DI and +DI are way too far from each other and ADX is resting at 37 value which means that the prevalent trend is strong. So, more time is needed to see any change in trend.
VOLUME INDICATOR AND VOLUME OSCILLATOR
The most important thing which i noticed on the daily graph is that, the with falling price, the volume has been falling continuously. This is obviously, in favour of BULLS. This clearly marks the loss BEARISH momentum.
In addition to this, the Volume oscillator indicator also indicates a loss of bearish momentum. The oscillator has a negative value of -14. For all those who don’t know how volume oscillator works, let me explain it to you in simple words. This indicator plots positive values above the zero line and negative values below the line. A positive value suggests there is enough market support to continue driving price activity in the direction of the current trend. A negative value suggests there is a lack of support, that prices may begin to become stagnant or reverse
Litecoin is already in a clear downrend. A positive value of volume oscillator may have suggested further downward movement. But since, the value is negative, there is a lack of support and the trend may reverse soon.
CONCLUSION:
I’ll leave it for you to decide. I am neither shorting nor longing at this moment, i am just sharing this for knowledge purposes only.
P.S: This is not an investment advice, and i am just learning. This is for my learning purpose only. Invest your capital at your own risk.
Those who wish to achieve greatness, never seek for permissions.
They follow what their heart says,
and do what their mind states!
Good luck trading.!
Peace.


$LTC #Litecoin - BIG MOVE AHEAD - fasten your seatbeltHello Lads and Ladies,
Today we are taking a peek at LTCBTC and seeing how it is getting ready for a big move.
Just a little to the history of LTCBTC. In December we saw a humungous push to 0.019750, from there on it was on a downtrend to 0.016000 and crashed within a few days to 0.013400. After the crash it just rocketed up almost 100% to 0.025000. From that level on it has been on a pretty steady downtrend.
As LTCBTC is known for its violent crashes but also its even more violent pushes, can clearly see a strong downtrend resistance after the the very big rocketing in February to 0.025000.
There was also a second downtrend resistance that has come to and experienced a push from the 23.6% fibs to the 38.2%, back to 23.6% and up to even the 50% fibs line. This last push has confirmed the second bigger scale downtrend resistance that LTCBTC has been respecting and is now hugging.
Normally, we have a very strong support sitting at the 23.6% fibs line which is located at 0.016000. Since we should have been at an end of the big scale downtrend, we could have expected a big bounce to 38.2% and then to 50% again.
Nevertheless, we had the whole market shaking very hard, what caused LTCBTC to crash almost to the same level like it did in the beginning of February and started a humungous push.
Right now, the LTCBTC chart is still hugging the downtrend resistance. It seems like that it issuing to break it and leave it pretty soon, form where we can at least expect it to push up towards the 38.2% to 50% region. Moreover, should the whole market stay in a pretty positive vibe and experience a nice push, we might even see LTCBTC repeating its almost 100% push again.
Normally I always show more bearish scenarios but in this case I am very sure because I have been trading LTCBTC for a long time and we haven't seen a really big push now for quite some time. The downtrend is ending and the push is immanent. I am not saying that it will happen in the next few days, but I am pretty sure about it within the next few weeks.
Like and Follow me and you will find this page interesting because I am a TA expert and day trader that does daily updates and new posts about the hottest and most discussed coins.
Fell free to request TA for ANY coin you are interested in!!!
Cheers, Tomas

LTC the perfect Long! On the Daily we have a beautiful falling triangle, and a very low risk to extremely high reward potential play!
with my count I am getting to this correction being the end of our 4th wave, I am playing it safe by placing a take profit at 0.618% range at 330-340USD for 85% of my total LTC portfolio and remaining 15% to be divided between 0.786(400USD)-2.618(1000USD).
my stop is at 88USD.
Good luck all.
this is only my actual current trade and not an investing advice to anyone. trade at your own (low)risk ;)

LTCUSD’s monster descending triangle Price action between January 5, 2018 and $108.29 is captured in this analysis as a descending triangle for Litecoin (LTCUSD). The implication of this chart pattern is bearish, albeit not 100% of the time.
Litecoin (LTCUSD) currently has broken out of the is chart pattern and the downward target using a vertical projection of the width of the chart pattern means Litecoin (LTCUSD) would go back to $0 and cease to exist.
The earliest target for Litecoin (LTCUSD) to find support is placed between ~$58.20 and ~35.38 before any possible bullish momentum can be sustained.
