$LTC Litecoin resistance line reached, SHORT it then BUY the dipLitecoin is finishing out its pennant and were about to hit the downside of one of its last hills. Short it now if you're holding, then buy the dip.
Litecoinforecast

LiteCoin Set ups to look for.3 Litecoin Setups to look for.
1. Buy stop above this $155 area for a move to 185 area
2. After it fully moves up to 185 area, buy on the retest on 155
3. Buy on a retest of this $130 area.
The one I like the best is buying on a retest of this $130 area for a move back to the upside as I think it's over extended right now. if you are in LTC right now, throw a stop on it to make sure you lock in those profits.
But those are the set ups I am looking at.
Happy Trading,
Sherem

Cryptocurrency Update - YEAR OF THE HODLER During the last month we have seen a drastic sell off in all crypto due to a massively over-bought market caused by Over enthusiastic and fake hype throughout the whole market with bitcoin -0.34% being the leader, in my opinion this sell off is now over with currency such as lite coin increasing by around $40 in the past week.
Due to news releases in both lite coin(LTC) and ripple (XRP),
LTC - Bringing out Litepay via visa debit, allowing LTC holders to spend there cryptocurrency anywhere in the world using there lite coin visa debit card will incease popularity worldwide and make the currency more accepted and integrated in the future.
Ripple - Having teamed up with banks such as Barclays, in integrating a blockchain international system the future is looking good for this cheaper crypto coin, Unusual as it is for banks to try and integrate cryptocurrency into there everyday business, usually condemning them as "bubbles" and "nothing coins" due to there being no easy way to regulate said currency's such as Bitcoin -0.34% and lite coin, Ripple is very much different therefore in the future I believe the future for ripple is one of the most promising of all crypto.

LTC - A&E Double Bottom - Buy Signal - Long Opportunity Adam and Eve double bottom confirmed and breaking out, will only buy once we break current resistance at 0.017150 to confirm breakout.
LTC
Buy: 0.017200-0.017300
Target 1: 0.0174
Target 2: 0.0177
Target 3: 0.0181
Target 4: 0.0185
Target 5: 0.0195
Target 6: 0.0200
Stop loss: 0.016500

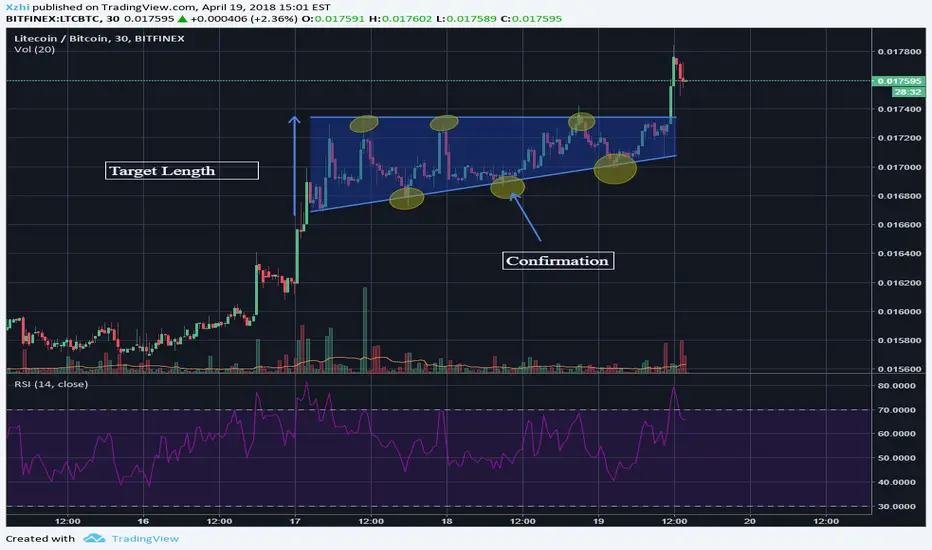
LTC Bullish Ascending Triangle (Educational) Signals for an 'Ascending Triangle'
-On an uptrend, pausing for period of consolidation (Yes)
-Minimum of two reaction highs and two reaction lows (Yes)
-RSI no bearish divergence (Yes)
How to trade:
The price target is most likely the entry price + height of the triangle.
Buy in:
-Upon confirmation (2nd reaction low) buy in
Sell points:
-0.017779 (Entry price + height of triangle)
It is important to note that this is a bullish ascending triangle due to the short term bullish momentum for LTC. If we were in a downtrend, it most likely will do the opposite.
Please criticize my TA's so I can improve. See you in the next chart :).
Tripling Your Investment Is FUN - theMegalodon is almost hereWe just banged out another triple on EBoost / Bitcoin .
We are waiting patiently on theMegalodon indicator to see a green arrow or orange candle to reinvest.
See our TV Profile for more information to reach us.
--------------------------------------
THEMEGALODON
theMegalodon looks for the institutional finger prints, the whales or the big boys.
theMegalodon is really simple to use.
theMegalodon combines the 8 different unique indicators, that each have almost perfect success rate.
theMegalodon works with any kind of market state, any kind of trading, and any kind of asset.
theMegalodon has more features than any other indicator in the market: Out of 9 working indicators, we have 3 momentum, 3 price and 3 volume indicators showing you the best signals.
--------------------------------------
theMegalodon is designed for us, the small fishes in the ocean, the millennials, the college students. This will basically makes us the new Megalodons(whale hunters).
All you have to do is:
1- Look for green or red arrows.
2- Look for orange or red candles.
3- Repeat
--------------------------------------
iPyra
Enlighten other

LTC long term investment. How to trade x/BTC pairs now.Alright. BTC is plunging so average holder of this coin would like to accumulate as much BTC as he could in case of BTC's future rallies. I strongly believe that crypto space is the future of world's tech pool, but now blind longs don't make sense. Hopefully, We will get all of these coins at cheap prices once again. It sounds unbelievable, how it even works.
I do not advice to hold any coin right now, but If You play long term there You should look for good short and collect BTC.
LTC/BTC short will bring profits, but it will be slow and draining process. I expect meeting with 0.008 once again.
Fiboncacci floors as profit taking areas.
Entry: 0.0171
Stop loss: 0.0185 ( every SMA 20 crossing should activate 'red button' alert, where stronger tick would trigger it )
I do not trade alts versus BTC right now, this post has been created for traders that are in doubt sitting on bunch of BTC without a purpose.

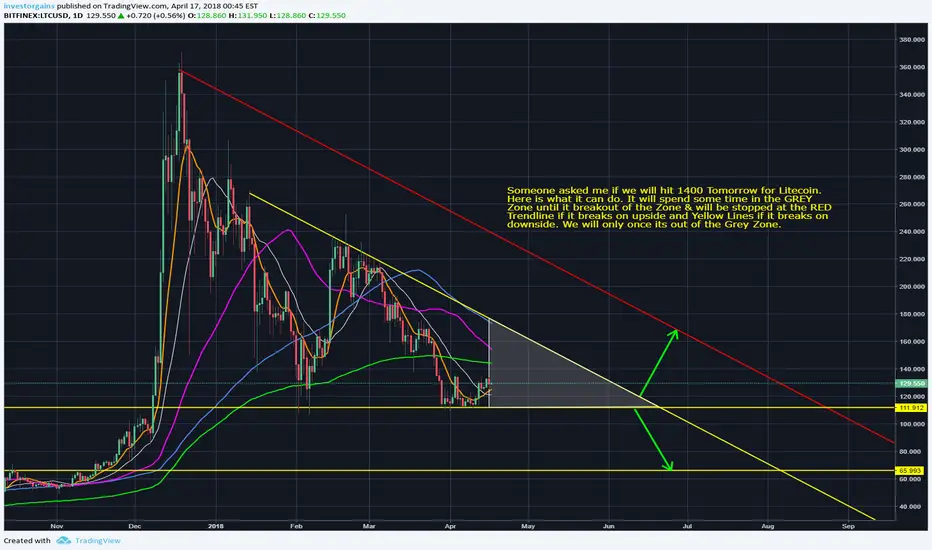
LITECOIN Breakout Downside 66 Area Upside Capped at RedlineLTCUSD is holding 110 Area as an interim bottom for now. Will this be final Bottom ? or it will continue on the down side ? Here are the Levels where it can potentially go on Downside Break. On the Upside the Redline will stop it in the interim if it breaks out of the GREY Zone.
Whats the Trade here ?
Unless we breakout from the GREY Zone the OUTLOOK is Neutral with bearish bias.
SELL Can be considered around 156-159 Area
BUY can be considered if we break on the upside. Will post updated Entry levels when we see some clarity.
Potential for downside to 66 Area is real if BTC breaks its range on downside.
Litecoin Daily Chart... Weakness for sureBeing completely objective with the chart here but LTCUSD looks horrible in comparison to the other crypto charts. BTC, ETH and a ton of shitcoins have all broken out of the multi month downtrend channel that started back at the all time highs. Most have had bullish MACD crosses and are above or at least challenging their 50/200 DMA. Can't say anything like that is present in the current LTC charts. Still below both the 50 and 200 DMA, which is also weaker than most of the other crypto charts. This descending triangle looks and feels like it might break to the downside here and we'll see $100 LTC again.
You can make a bullish case that this is the 4th time LTC has touched the breakout point in the triangle, it's due to bust out..... maybe... but where is it? It should have happened already. If LTC doesn't pop out of this triangle soon, It's most likely going lower.
I guess if you had to make a bullish case for LTC and say that in the recent downtrend, it never had a death cross (200 DMA crossing below the 50 DMA). You could possibly show that LTC did hold up better during bearish phases in the past. I agree that many times LTC does display relative strength when the overall crypto markets get in trouble.
Bottom line, needs to bust out of this downtrend channel... like BTC and many other cryptos have done. LTC is late to the crypto rally and has the weakest chart out of the top tier cryptos.
What do you think? Please let me know below?

Will LITECOIN go down to under $100? - Bearish w/ Bullish WavesHow are you Crypto Maniacs!
Litecoin indicators are surprisingly neutral at this point. That is of course not something an investor who is in Litecoin wants to hear right now, but on the other side, it is better than being bearish.
MACD is leaning more towards bearish side in short term, however in medium term, which entails few month, it is bullish as it is in accumulation stage.
RSI is neutral with bullish signals in terms of being at 40% most of the time which indicates a good buy for those of you thinking of getting in for 2-5 Month.
Volumes are negative which is what we should expect in market like this one guys.
I see Litecoin dropping to around $100 levels before making a recovery. Until we break that downward wedge, we will not be going anywhere. You can buy in at time of a break, however please have safe sell orders in place until market moves to stabilize with Bitcoin. Overall we like Litecoin. Technology is very nice and as for investors it is a very liked coin due to it's long term reputation.
Invest only what you can afford to lose or you're going right back to poverty on drop. We are not your financial advisors.

Litecoin Downside & Upside Break ScenariosLTCUSD is again hanging on a thread. 109-113 area is acting as a crucial support. Any downside break will potential take it to 81 Area first before 63 & 39-43 Zones. Upside Break will be capped at 138-143 initially followed y 151-159 zone. In case of a downside break, 112 will offer stiff resistance.

Litecoin Outperforms Bitcoin.Our markup on Litecoin remains relevant, and the applied levels are executed with high accuracy.
Despite all the misadventures, yesterday Litecoin buyers found the strength to support the asset, resulting in the price reaching $136. However, due to the lack of confirmation of the global reversal, this height could not be maintained.
At the time of writing, the correction continues and the sellers are clearly going for $125. We described the further goals for the bears yesterday- they are $110 and $100 in case Bitcoin moves toward $6,000. A temporary stop will be made at $120. No matter how hard the Litecoin community is trying, the asset does not look like an attractive investment yet.
Check my detailed analysis HERE .

This is going to hell i Guess ! #Litecoin #LtcUsd #Crypto I don' kno why this happening on this , but due to this chart i won' go on wrong long side like never !

Bounce Hunting these lows- LTCWe hit our bottom $115 line for a bounce and it's testing this area again. When litepay was suddenly canceled, the sentiment for litecoin went from bad to worse. I won't go into to much of the fundamentals of it, but if you are trading litecoin, it pays to be even more cautious while trading it. BTC is really the driver and if we get a retest of these lows in BTC, we could see litecoin dip to the $100 area.
Why we should (this is the key word, nothing is guaranteed) have a bounce.
1. Look at RSI historically and match it up with these previous low points. It's been a good indicator of getting a solid bounce.
2. MACD is waiting to cross over for a move to the upside. This would be a confirming upside indicator
3. This area above $100 is a MAJOR pshycological support level.
I would look to this area for support. It is possible we will go sub $100 before we get a bounce. Look to BTC and how it fares with this 6k low to determine where LTC will bounce. It looks like they are going to coincide very well, with LTC hitting just above this $100 area right around when BTC hits this 6k low. It could bounce sooner. You can either wait for confirmation or start laddering some buys in!
Happy Trading. Don't stree, pick your points, and don't use leverage!
-Sherem

Litecoin BUY SELL ZonesLTCUSD is trending lower for most part of the day and holding sub 143 range.It broke that range after almost 8 hours of consolidation. It has a potential to the down sloping Trendline. Only if the Trendlines break it can test 156-158 area where it will find strong Resistance. The lines are slopping down so Target will change with time

Litecoin going downIn the 4h chart it's clear a bearish flag, with LTC price that will probably touch the 100 EMA in the same zone of 61.8 Fibonacci retracement. Good coincidence, isn't it?
This is the overall picture.
If the 100 EMA does not work as a support line, expect Litecoin to touch the white drawn support line.

LTC back to $40 - $60?The image explains itself. Although it’s in euros, the behaviour is the same.
I have to say I haven’t got any LTC and not planning to buy anything, so I’m not biased at all.
It’s just an idea of what it could happen to LTC. Take your own risk when investing. I’m not responsible of your actions.
As you can see in the previous pump that I have circled in red, everything that goes up, has to go down, and I’ve seen a lot of posts saying it will going up.
To be honest, it’s a possibility, but use your common sense and don’t think it’s always going up, since it has to go down one day and “land” again. Once it “lands”, it has to run through the “runway” to go up again.
That said, I think it will go down, touch the bottom after some small or acceptable pumps, and wait for people’s fear to stabilise.
It’s a correction, but not the end.
Again, trade at your own risk. I will not be responsible of your actions.

Looks like Litecoin is heading to $146So we have reached the first target that was $152. However, it doesn't look like we are stopping there.
BTC and LTC are both looking bearish. MACD and RSI on both are bearish as well,
Looks like LTC is heading to $146.

Taking us higher, highhhherr! LTCMy last post laid out a pretty clear strategy to pick up some LTC as it dipped down. If you are following me, I hope you got in and scooped up some of these prices as it fell and realized how effective employing a martingale strategy is. While my positions aren't as good as ETH, I still have a solid position in LTC that is profitable right now.
The first thing we need to realize is that we are in an overall bear market. Besides the spike down, maybe more evidenced by the cross in the weekly MACD. Could this be the bottom? Quite possible. We broke the major down trendline last time and we made a higher low and are starting to get a solid push to the upside. We are also kind of breaking this trendline at the moment of writing this, but nothing is confirmed quite yet
If it doesn't turn or stall right now, I think we are going to the 190-200 area at least before we get any sort of retrace or sign it's going to continue downward. it also happens that the 50 fib retracement coincides with the 190-200 area for a resistance point. We should get a retrace once we get up there.
Keep an eye on this level and this 190-200 area.
Happy Trading everyone. Don't stress, pick your points and don't use leverage.
-Sherem
Check out my last call with how I entered into LTC -

Bullish flag forming on Litecoin Hourly. Target $190Bullish flag has formed on the LTC hourly chart. Target is between $185 to $190. $190 would match nicely with the end of wave 3 that I have on the chart and at around 0.5 fib levels.
Litecoin (1.35% as of writing) has had higher growth today compared to bitcoin (0.37% as of writing). Looks like the market is strongly behind LTC.


Litecoin Buy & Sell Zones#Litecoin is waiting for an upside break. Depending on how you draw your lines, different analysist have different breakout zones. We believe it wont break upside today. LTCUSD wil consolidate below 178

Litecoin to 165/175 if Bitcoin reaches $9kLTC is looking bullish right now on the 4 hour chart. MACD has crossed over as well.
The good news from the G20 summit has had a positive impact on the price of BTC. BTC looks like it is forming a bull flag. If confirmed, the price should reach $9k.
If so, LTC should comfortably reach 165 to 175 since LTC's price action relies on BTC price.
Just my opinion. DYOR before acting on any opinion.
