Litecoinusd

**Speculative Trade on Litecoin: +25% on the horizon**Hi, Traders !
Monfex is at your service !
We have descried a hidden speculative Long opportunity on Litecoin.
Take a look at 1H Chart:
* We see 3 evident levels, where buyers were stocking up while the price was gradually capitulating.
* After that, the market entered into accumulation/consolidation phase, where Bulls were pushing the price up persistently crowding out Bears.
* Most likely that Bears have allocated their Stop-loss orders somewhere above the local tops of the consolidation area, that is above $58.61.
* Should we see the price pushing through the specified level on increased Volume, a speculative Long will be confirmed with the target around $70.
Speculative trade signal
Buy @ $55 - 56
Target: $70
Stop-loss: $51.90
Watch for our Updates to get real-time superior signals!
GOOD LUCK AND LOTS OF PROFITS !!
If you agree with this analysis, then Like it and visit my page! This will be the best feedback and encouragement for me!
Disclaimer
This report is for information purposes only and should not be considered a solicitation to buy or sell any cryptocurrency or cryptocurrency product. Monfex accepts no responsibility for any consequences resulting from the use of this material. Any person acting on this trade idea does so entirely at their own risk.

Bears still hold Litecoin ! How long ?Hello, Traders!
Monfex is at your service and today we overview LTC/USD .
What do you expect from Litecoin ?
LTC dropped well, formed a triangle and can be pulled closer to the nearest resistance, it is the ex-support zone near $ 62 and 50% Fibonacci level near $ 65.3 .
But!
You need to act only by some breakout of the resistance with crossover MA50 of the triangle near $ 58 or short by breakout the support line.
It is dangerous to enter the deal without breakout, since the trend is locally downtrend.
Share your thoughts, ideas about the market under the chart.
Watch for our Updates to be the first who gets well-timed signals !
GOOD LUCK AND LOTS OF PROFITS !!
Disclaimer
This report is for information purposes only and should not be considered a solicitation to buy or sell any trading assets. Monfex accepts no responsibility for any consequences resulting from the use of this material. Any person acting on this trade idea does so entirely at their own risk.

Litecoin Technical Analysis 10/1/2019 LTC/USD Technical analysis. First day of Q4.
Price seems to have finally slowed down near the $55 range after a harsh move down in the last week of September. Looking for more confirmation before entering any more positions. Very neutral for the time being. However, I think if price breaks $60, we could test the $66-$72 range rather quickly, but if price breaks $50 we will see a sharp move down possibly all the way near $34.
Long term I am still personally very bullish on this coin and have been stacking positions all year.

FURTHER DOWNSIDE ON LTECOIN TO $35.5I previously marked up LTCUSD and so far, the market has respected our analysis ( i have attached it below) .
Litecoin still has bearish momentum and is showing potential to continue moving bearish to the $35.5 mark. Across the board, we have been pretty bearish on the Crypto side and we can expect further bearish momentum across the board too.

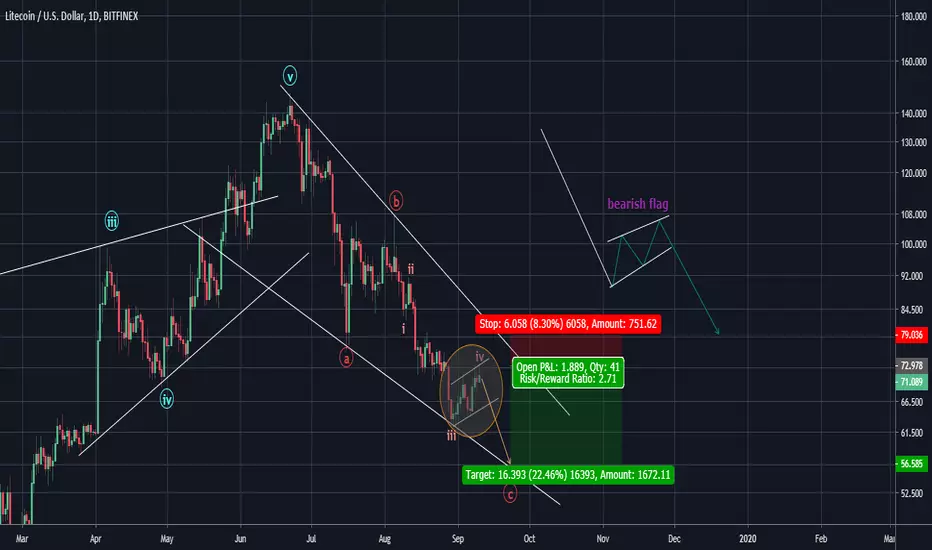
Litecoin dump targetsSince we are all bearish for BTC, LTC price in dollars should also drop. This is the plan for the upcoming month. Not necessary will go down to the bottom, but we may expect second leg coming after a small bounce back to 60.


LTC Long term opportunity coming up. Potential 100%In the next 2 or 3 weeks there is a good opportunity to buy Litecoin.
Reaching golden pocket, probable reversal of trend coming up.
RSI is near to be oversold.
Trend will be tested.
Strong support in the buying area.

$LTCHello all,
I think this rising wedge on D1 would counter the falling wedge on BTC.D pretty nicely also could make for a nice bear trap that turns into a bull trap that gets everyone sick of alt coins before they lift off alt season.

LTCUSD formed a bullish Crab pattern | Upto 28% expectedBy the grace of Allah the most high after giving more than 29% profit as my previous idea:
Now on smaller time period chart the priceline of Litecoin / US Dollar has formed a bullish Crab pattern and has hit the spike within potential reversal zone but MACD and Stochastic are still bearish therefore the priceline may give us another chance to catch it from PRZ area insha Allah.
This PRZ area should be used as stop loss point in case of complete candle stick closes below this zone.
I have used Fibonacci sequence to set the targets:
Buy between: 63.55 to 58.97
Sell between: 67.10 to 75.70
Regards,
Atif Akbar (moon333)

LTCUSD has formed a bullish butterfly | Upto 66% expectedPriceline of Litecoin / US Dollar has formed a bullish butterfly and entered in potential reversal zone to take bullish divergence from here soon insha Allah.
MACD is turning bullish.
RSI is oversold.
Stochastic has given bull cross.
Price action is getting bounced after hitting the support of bollinger bands.
Volume profile of complete pattern is showing less interest of traders at potential reversal zone.
I have defined targets using Fibonacci sequence.
(Plz ignore the previous chart where I predicted a shark now the leg is extended and it is behaving as bullish butterfly now you can follow the below revised targets, thanks)
Buy between: 67.786 to 57.348
Sell between: 75.882 to 95.728
Regards,
Atif Akbar (moon333)


Lite Coin Forecast For Next 7 Days Said 30% Profit On Going Way"Salam"
Buy Zone : 71 $ - 73 $
Stop Lost : 70.0 $
First Target 80 $
Next : 91$
Risk Reward : PERFECT !!!
in 1 Week


LTC late bull?It looks like Litecoin too is poised to breakout by the end of the year. Looks like the MACD is showing a slowing of bear trends and will start heading upward with the rest of the crypto market.
If 2017 repeats, we will see at least the top 20 alt-coins breaking out with bitcoin. There are much higher returns for those investing a few thousand dollars in an alt than in Bitcoin. 200% is much more realistic for an altcoin that is $0.05 than 200% on $10,000. But, the sky is the limit.
Disclaimer: Cryptocurrency market is notoriously unstable and are easily influenced by external events. This is no guarantee of a breakout. This analysis is based on past events and indicators. Dates are not predictions, as bull/bear markets seem rather sudden.


LTCUSD: Another Ascending Triangle on 4hr Like ETHUSDSimilar to ETH's ascending triangle that developed in past two weeks, Litecoin against USD on the 4hr is in a much cleaner bullish ascending triangle while facing resistance at the 200 MA. The 50&100 MAs have already had a bullish cross, oscillators are looking bullish. Will open a position above $73.25 (above previous swing high) with tight stop loss at $69 for a 2:1 ratio. Horizontal resistance levels around $79-82 with the measured target for the triangle breakout at $82, shown by the golden line.

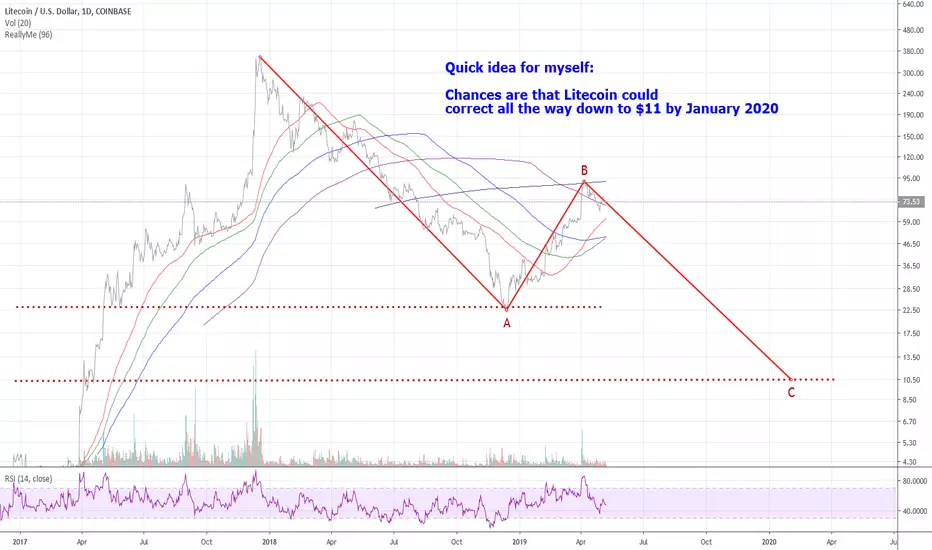
LTC Bull by Spring 2020The area marked yellow technically prevents the stock from breaking out above the triangle. The distance between 'A' and 'B' is too short, and the rise from the current low to 'B' is too steep proportional to the first run from 2017 to 2018.
While I wouldn't completely rule out a breakout above the triangle, it is highly unlikely! Instead, watch out for a descend to touch the 'support trend line', then a 'partial ascend' until around Nov-Dec 2019, followed by a breakout below the 'support trend line'. Litecoin is currently in a beautifully readable formation and is a 'strong buy' by spring of next year. It has the potential of reaching the all-time high by spring '22.
NOTE: Lines have been connected using the line-chart. This way the highs and lows are averaged and allow for a much preciser evaluation.

Litecoin - I've seen this pattern before...Quick idea for myself:
Chances are that Litecoin could correct all the way down to $11 by January 2020
9/9/19Lucky numbers
Yall whippersnappers got too many colors on your charts, We're taking it back to monotone green


LTCUSD very bullish upswing volume confirmation TP 1 : $73.81
TP2: $78.98
STOP @ $63.98
Set your stop-loss @ the red.
Have a wonderful weekend.
-@a1mtarabichi
Disclaimer
Market volatility makes priceaction subject to change at any moment. Hence the emphasis on ALWAYS SET YOUR STOP LOSSES! don't let your greed get the best of you.
