GOLD → Countertrend correction, retest of 3345 before growthFX:XAUUSD , undergoing a deep correction after a false breakout of local resistance at 3433, has reached the support of the upward trend. Will the bulls be able to maintain the trend?
Gold held below $3,400 on Friday, rebounding from $3,350, and is poised to end the week higher. Investors are watching the conflict between Thailand and Cambodia, which is boosting demand for safe-haven assets, and are also awaiting decisions from the Fed and the Bank of Japan next week. The markets received additional support from US trade deals with Asian countries and progress in negotiations with the EU, easing fears of a tariff war.
As part of the correction, gold is testing trend support and the 3345-3337 zone of interest. A false breakdown, lack of downward momentum, and bulls holding prices above 3345 could trigger growth and a continuation of the main upward trend.
Resistance levels: 3375, 3383
Support levels: 3345, 3337, 3330
Technically, the support level of 3345 plays a fairly important role in the market. If, during the correction, the bulls manage to hold their ground above this zone, the prospects for recovery will be high, especially against the backdrop of geopolitical problems.
Best regards, R. Linda!
Community ideas

THE END OF ETHI think they’re about to trap all of you in the most popular alts.
Bitcoin. Ethereum. XRP. Solana. ADA. DOGE. PEPE. You name it.
The end of ETH is near.
🟩 Green = I’m buying
🟥 Red = I’m selling
Last time we predicted the drop from $4,000 to $1,400.
This time I want to see ETH under $1,000.
Good luck holding your bags when the market rug gets pulled.
I’m not here for likes — I’m here for entries. Stay sharp. 🧠📉

AUD/USD - Breakout (25.07.2025)The AUD/USD Pair on the M30 timeframe presents a Potential Selling Opportunity due to a recent Formation of a Trendline Pattern. This suggests a shift in momentum towards the downside in the coming hours.
Possible Short Trade:
Entry: Consider Entering A Short Position around Trendline Of The Pattern.
Target Levels:
1st Support – 0.6551
2nd Support – 0.6513
🎁 Please hit the like button and
🎁 Leave a comment to support for My Post !
Your likes and comments are incredibly motivating and will encourage me to share more analysis with you.
Best Regards, KABHI_TA_TRADING
Thank you.
Disclosure: I am part of Trade Nation's Influencer program and receive a monthly fee for using their TradingView charts in my analysis.

GBP/CAD - H4 - Bearish Flag (26.07.2025)The GBP/CAD Pair on the H4 timeframe presents a Potential Selling Opportunity due to a recent Formation of a Bearish Flag Pattern. This suggests a shift in momentum towards the downside in the coming Days.
Possible Short Trade:
Entry: Consider Entering A Short Position around Trendline Of The Pattern.
Target Levels:
1st Support – 1.8242
2nd Support – 1.8139
🎁 Please hit the like button and
🎁 Leave a comment to support for My Post !
Your likes and comments are incredibly motivating and will encourage me to share more analysis with you.
Best Regards, KABHI_TA_TRADING
Thank you.
Disclosure: I am part of Trade Nation's Influencer program and receive a monthly fee for using their TradingView charts in my analysis.

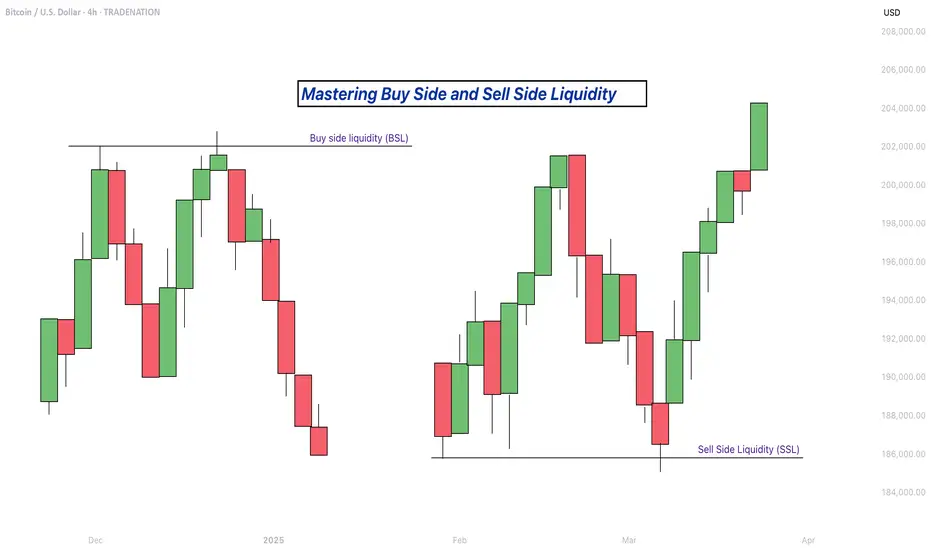
Mastering Buy Side and Sell Side Liquidity - How to trade it!In trading, understanding liquidity is one of the keys to predicting where the market might go next. The Inner Circle Trader (ICT) method teaches traders how to recognize where big players like banks and institutions are likely to enter or exit trades. Two important ideas in ICT trading are buy side liquidity and sell side liquidity. Once you understand what these terms mean and how to spot them on a chart, you can start using them to find better trading opportunities.
What will be discussed?
- What is Buy Side Liquidity?
- What is Sell Side Liquidity?
- How do you see Buy and Sell Side Liquidity?
- Examples
- How to trade BSL and SLL Liquidity?
What is Buy Side Liquidity
Buy side liquidity is found above market highs. It refers to all the stop loss orders from people who are holding short positions. When the market is going down, some traders sell (or go short) and place their stop losses above recent highs to protect themselves. These stop losses are actually buy orders because closing a short position requires buying. Big institutions know this, so they push price upward to trigger those stop losses and grab that liquidity. That’s why you’ll often see the market spike above a recent high before reversing. That spike is the market grabbing buy side liquidity.
What is Sell Side Liquidity
Sell side liquidity is the opposite. It’s found below recent lows. This is where traders who are buying (going long) place their stop losses. If someone buys a market, they’ll usually put a stop loss just below a previous low. That stop loss is a sell order. Smart money looks at these areas as pools of sell side liquidity. So when the market moves down quickly and breaks a recent low, it’s likely collecting those sell stop orders. After that, you’ll often see a reversal because the liquidity has been taken.
How do you see Buy and Sell Side Liquidity?
You can spot buy side and sell side liquidity by looking at the chart and identifying recent highs and lows where many traders might have placed stop losses. These are usually obvious swing highs and swing lows. If you look at a chart and see a clean high where price previously reversed, that’s likely where traders are placing stops. That makes it a target for buy side liquidity. Same for a recent low, if it’s a clean level where people might have bought in the past, that low probably holds sell side liquidity. The more obvious the level looks, the more likely it’s full of stops and therefore a liquidity target.
Examples
How to trade BSL and SLL Liquidity?
Trading liquidity means watching for the market to run above a recent high (to take buy side liquidity) or below a recent low (to take sell side liquidity), and then looking for signs of reversal. Once liquidity has been taken, the market often changes direction.
When you’re trading the ICT concept of liquidity, the key is not just spotting where liquidity lies, but also knowing when price is likely to reverse after that liquidity has been taken. Reversals don’t happen randomly, they leave clues on the chart. Here’s how you can recognize those signs in a simple way:
1. Market Structure Break
This is one of the clearest signs of a reversal. Let’s say the market grabs sell side liquidity by breaking below a recent low. If price then quickly starts moving up and breaks above the last lower high, that’s a break in structure. It shows that sellers are losing control and buyers are stepping in. It’s the first confirmation that the direction might be changing.
2. Rejection Wicks or Strong Candles
After price runs into liquidity (above a high or below a low), watch the candlesticks closely. If you see a long wick rejecting the level, or a strong candle in the opposite direction right after the liquidity grab, that’s a clue. It means price went there, collected the orders, and got rejected fast. That rejection shows the market might be reversing.
3. Fair Value Gaps (FVGs)
Fair value gaps are small “windows” left in price when it moves quickly in one direction. After liquidity is taken and price starts reversing, it often leaves an FVG behind. If price pulls back into that gap and holds, that can be a great entry point. FVGs act like magnets and support zones in ICT.
4. Displacement
Displacement is a strong, impulsive move that breaks structure. It usually happens right after liquidity is taken. If price moves very fast in the opposite direction after hitting a liquidity level, that’s a good sign smart money is behind the move and it’s not just random noise. That strong push is a hint that a new trend might be forming.
5. Change in Character (CHOCH)
This is a shift in how the market behaves. For example, price might be making lower highs and lower lows (a bearish trend), but after liquidity is taken, it suddenly starts making higher highs and higher lows. That change in character tells you the trend might be reversing.
-------------------------
Disclosure: I am part of Trade Nation's Influencer program and receive a monthly fee for using their TradingView charts in my analysis.
Thanks for your support. If you enjoyed this analysis, make sure to follow me so you don't miss the next one. And if you found it helpful, feel free to drop a like 👍 and leave a comment 💬, I’d love to hear your thoughts!
TC Analysis – Watching That Trendline Closely!Hello guys!
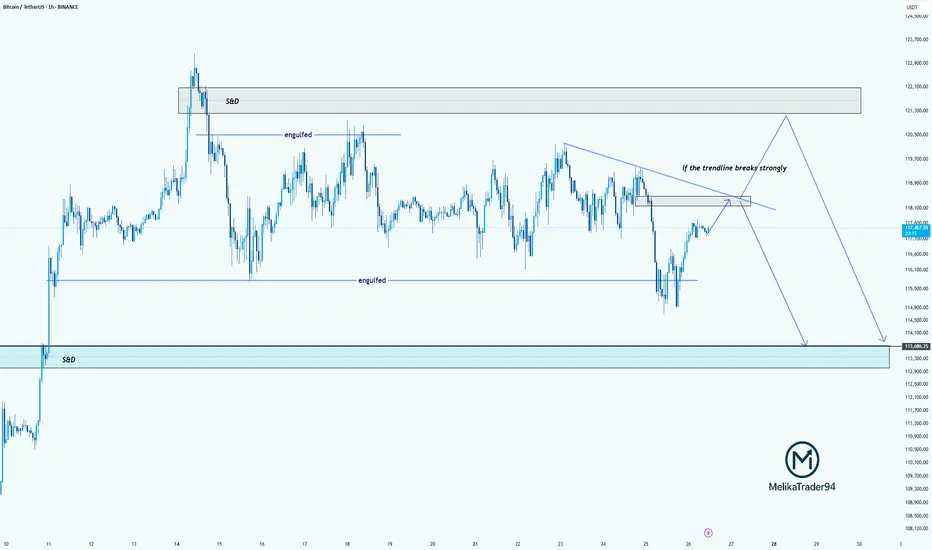
Bitcoin is currently approaching a key decision point. As highlighted on the chart, we’ve got a descending trendline acting as strong resistance. If this trendline breaks with strength, we may see price push up into the supply & demand zone around 121,000–122,000 before potentially reversing.
However, if the trendline holds, this current move could be a retest, setting up for another drop. The engulfed level at 114,000 has already been tested once, and if we break below that again, the price could slide down into the S&D demand zone around 113,000–112,000.
summry:
Trendline resistance is critical right now
Watch for a strong breakout or a fakeout & rejection
Possible bearish continuation if we fail to reclaim above 118,500
Let’s see how BTC reacts around this zone.
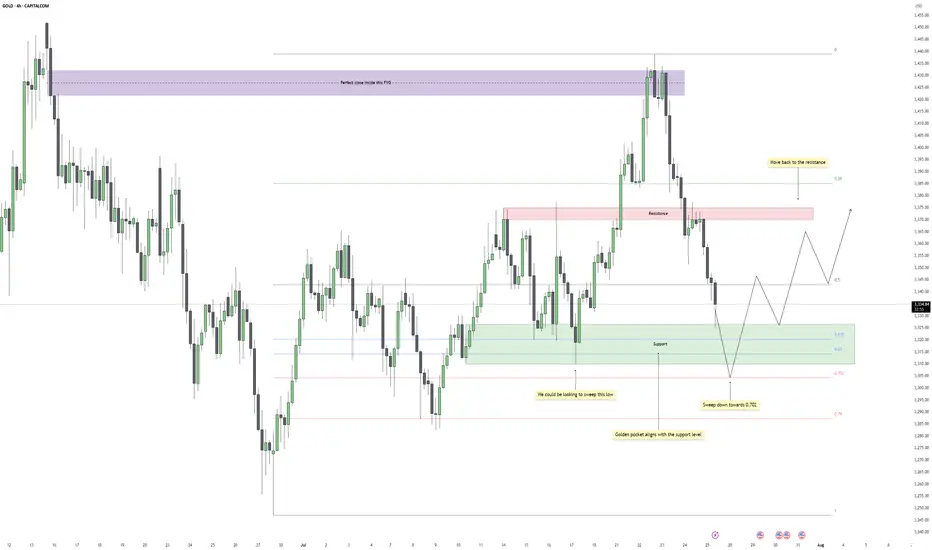
Gold - Eyes on the Final Flush Before ReclaimGold recently dropped after reacting perfectly inside a higher time frame fair value gap. That zone acted as clean supply, offering a precise close within the imbalance and initiating a strong bearish leg. The move confirmed that buyers were overwhelmed at that level, and price began its descent back into a broader consolidation range.
Support Cluster and Fibonacci Alignment
The current zone being tested holds significant weight. Price has tapped into a clear support region, one that has already caused multiple strong bounces in recent sessions. What adds further confluence is the alignment of this zone with the golden pocket region of the entire upward leg. This kind of technical overlap increases the chances of responsive buying once liquidity is cleared below.
Liquidity Target and Inducement Setup
Just below current price action, there's a clean low that hasn't been taken out yet. This low acts as the inducement, sitting right above deeper Fibonacci levels, especially the 0.702. If price continues lower in the short term, a sweep of that low into the golden pocket would provide the ideal liquidity grab before a reversal. The market often rewards those who wait for that final flush.
Bullish Recovery Path
Once the liquidity is taken and price stabilizes at the golden pocket zone, the path is open for a recovery move back into the midrange and potentially higher. The most likely magnet for price after a successful bounce would be the previous resistance zone, which coincides with the 0.5 retracement of the recent drop. That area should act as the next decision point and could either cap the rally or provide the base for a continuation if buyers show strength.
What I’m Watching
The cleanest scenario would be a sweep of the low just below support, ideally pushing into the lower green box near the 0.702 level, followed by a strong bullish reaction. I’ll be watching for a market structure shift on the lower timeframes at that point to confirm the entry. If that happens, the trade has room to develop back into the prior resistance zone, offering a solid range for intraday or swing setups.
Conclusion
Gold remains in a broader range for now, but the technicals suggest one more drop to clear late long positions before a recovery. The reaction at the support cluster will be crucial. If bulls step in after the sweep, there’s a high-probability path back toward resistance, with the move likely supported by the golden pocket confluence.
___________________________________
Thanks for your support!
If you found this idea helpful or learned something new, drop a like 👍 and leave a comment, I’d love to hear your thoughts! 🚀
BITCOIN → Correction within a downward channel. 112K or 125K?BINANCE:BTCUSDT is consolidating. However, a local downward trading range is forming relative to the current setup. What is the probability of a correction continuing to 112K or growth to 125K?
Daily structure: a local correctional channel within a global bullish trend. We have cascading resistance at 119.2, 119.6, 120, and 120.8. It will be quite difficult to break through this zone on the first attempt, but MM can use it to form traps and collect liquidity.
At the bottom, everything is simpler — a breakdown of the local bullish structure, the formation of an intermediate minimum, below which there is a void down to 112K.
Yesterday, relative to 115-116K, mm staged a massacre (trap) on both sides of the market.
Liquidity collection, return to the range, and growth. The reaction to the false breakdown of support is quite strong. Since the opening of the session, Bitcoin has been heading towards resistance, but there may not be enough potential to break through the upper resistance conglomerate, so I expect to see a pullback or decline to 116-115-114.
Resistance levels: 119.2, 120.1, 120.85
Support levels: 116.37, 115.67, 112
Technically and fundamentally, I do not see any drivers that could support the market (I am talking about Bitcoin, since the driver for altcoins is the decline in Bitcoin's dominance). It is possible that this may appear later. In the current situation, I am considering a false breakout and correction, as the market has not yet finished consolidating or correcting, and the current downward trading range may be extended.
PS: As the price moves towards resistance, it is necessary to monitor the reaction. The market itself will show what it is preparing for...
Best regards, R. Linda!

GBPAUD: Possible bounce at supportI am watching for a possible reversal GBPAUD, expecting a rejection with a upside target at around 2.073.
This area is where it can become a decision point, either price finds support and bounces, or it breaks below, and the move can start to extend lower.
Just sharing my thoughts for the charts, this isn’t financial advice. Always confirm your setups and manage your risk properly.
Disclosure: I am part of Trade Nation's Influencer program and receive a monthly fee for using their TradingView charts in my analysis.

ARKK: The Calm Before the Innovation Storm -ALTSEASON Is COMING🚀 ARKK: The Calm Before the Innovation Storm 🌪️
The markets are shifting, and disruption is about to go vertical. ARK Innovation ETF (ARKK) is quietly positioning itself for what could be the most explosive move of this decade. With high-conviction bets in AI, Bitcoin, genomics, and next-gen tech, this isn’t just a fund—it’s a launchpad for exponential growth.
This post breaks down exactly why ARKK could go parabolic—and why the smart money is already moving in. 👇
Explosive upside in 2026
ARKK is already up over 24% YTD , showing strong momentum compared to broader markets and signaling early stages of a potential parabolic move .
High-conviction concentration in game-changers
Top 10 holdings include Tesla, Roku, Zoom, Coinbase, UiPath, Block, Crispr Therapeutics, DraftKings, Shopify, and Exact Sciences. These are leaders in innovation sectors with massive upside potential .
Deep exposure to Bitcoin and digital assets
Heavy allocation to Coinbase and Block gives indirect exposure to Bitcoin . If BTC breaks into a new cycle high , ARKK stands to benefit significantly.
Positioned in exponential growth sectors
Focus on AI, genomics, EVs, fintech, robotics, and blockchain , all of which are entering accelerating adoption phases globally.
Aggressive smart-money accumulation
Cathie Wood’s team continues buying aggressively during dips, reinforcing institutional confidence in the fund’s long-term trajectory.
Technical breakout structures forming
Ascending triangle and multi-month consolidation breakouts suggest a technical setup primed for explosive upside .
Innovation supercycle aligning
ARKK's themes are aligned with major global shifts like de-dollarization, decentralized finance, and AI convergence .
High beta = massive upside leverage
With a beta above 2 , ARKK tends to outperform in bull runs , offering leveraged exposure to innovation without the need for margin.
Resurgence of top holdings
Names like Coinbase, Tesla, Shopify, and Roku are up 50%–100% YTD , driving ARKK’s NAV growth and fueling bullish sentiment .
Long-term vision with short-term catalysts
The fund projects 5x returns over the next five years , while Bitcoin halving cycles, tech innovation, and regulatory clarity serve as short-term ignition points .
Marty Boots | 17-Year Trader — smash that 👍👍, hit LIKE & SUBSCRIBE, and share your views in the comments below so we can make better trades & grow together!

NZDCHF – Bullish Breakout Sets Stage for ReversalNZDCHF has broken decisively out of a long-term descending channel, signaling a potential trend reversal. Price action confirmed multiple bullish flags within the falling structure, followed by a clean breakout and higher low retest, supporting a bullish continuation bias.
Currently, the pair is stabilizing just above prior resistance turned support around 0.4760–0.4780, forming a potential launchpad for the next leg higher.
Upside Targets:
TP1: 0.48336
TP2: 0.48844
TP3: 0.49319
Invalidation Zone:
A drop below 0.4720 would invalidate the breakout structure and expose the downside.
Fundamental Drivers:
🇳🇿 NZD Strength: RBNZ remains relatively hawkish compared to other central banks, and the Kiwi may gain from improving risk sentiment and easing global recession fears.
🇨🇭 CHF Weakness: Swiss Franc is under mild pressure as safe-haven flows weaken amid improving tone on US-China-EU trade headlines and fading ECB rate cut bets.
🗓️ Macro Flow: Upcoming risk events (Fed comments, trade updates, and NZ economic prints) could inject momentum into the pair, especially if risk appetite improves.
Bias: ✅ Bullish (Buy)
Confidence: ★★★★☆
Watch for: Clean hold above 0.4770 zone + bullish momentum continuation.

NASDAQ Potential UpsidesHey Traders, in today's trading session we are monitoring NAS100 for a buying opportunity around 23,140 zone, NASDAQ is trading in an uptrend and currently is in a correction phase in which it is approaching the trend 23,140 support and resistance area.
Trade safe, Joe.

GOLD could test 3375 before falling furtherGOLD could test 3375 before falling further
In our previous analysis, we were looking for gold to fall from the top and, as we can see, it has already reached 3341 from the 3430 area.
From the top down, the price depreciated by 2.85% in less than 3 days, so a possible correction is expected near the area of the structure coming from the left side around 3375.
Given that gold is only moving down, it may be possible for the downward movement to continue slowly. Both scenarios are possible at this point.
You may find more details in the chart!
Thank you and Good Luck!
PS: Please support with a like or comment if you find this analysis useful for your trading day

The End of the Altcoins Bull Market? BTC.D Turns Bullish?Bitcoin Dominance produced a bullish trend that was more than 1,000 days long. While this was a major development, the action never happened just straight up. There were always fluctuations.
Bitcoin Dominance broke out of a major rising wedge pattern. A pattern that lasted years in the making.
Recently, Bitcoin Dominance produced the highest bearish volume since 2021. A strong chart signal.
The major breakdown following the multiple years long uptrend signals the start of a change of trend. A downtrend. This downtrend is extremely bullish for the altcoins market because BTC.D only goes down when the altcoins are going up and doing so faster than Bitcoin.
What we are seeing now is an inverted correction, a pullback. Simply put, BTC.D already made a strong drop and it needs some relief. This relief is not the end. Bitcoin Dominance can move just a little higher to later resume its newly developing downtrend. Which means that the altcoins market bull market has not reached its end, it is only getting started.
Thank you for reading.
Namaste.

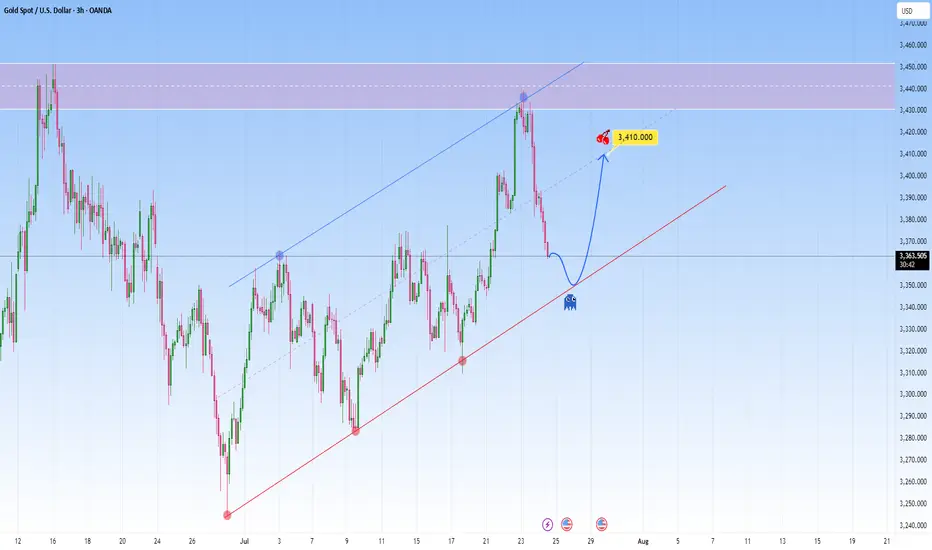
GOLD Reawakened: Corrects firmly but conditions remain bullishFrom a technical perspective Gold is climbing in a parallel channel, clearly bullish with a rhythm that’s hard to ignore. Price just bounced off the resistance with force, a classic overextension flush.
And the market is now approaching the lower boundary of this projected channel. This confluence of technical support is likely to attract renewed buying interest.
I expect it to bounce back toward 3,410, somewhere around the middle of the channel. The move up may not be determined right away. It could be consolitaing, fake dips first, or sudden acceleration.
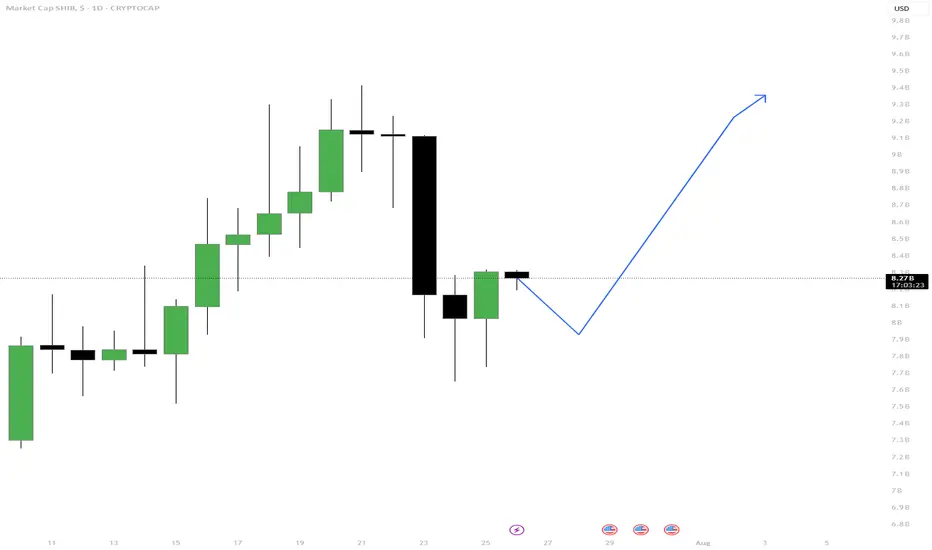
SHIB Market Cap – Dip Before the Rip?Hey Traders!
🧠 Idea: After a strong bounce from recent lows, SHIB’s market cap is showing signs of consolidation. A minor dip could come first, but if support holds, the next move may be a solid push upward.
📌 Tip of the Day:
Smart pullbacks often precede significant breakouts. Be patient and let the structure play out.
🔍 Why This Setup Makes Sense:
🔻 Big drop followed by recovery: Indicates buyers are stepping in.
💚 Strong support at 7.65B zone (wick rejection) shows buying interest.
📉 Short dip expected to shake out weak hands before possible rally.
🔼 Break above 8.4B–8.5B could trigger a continuation pump.
✅ Rules to Follow:
Don’t chase the green; wait for confirmation after any dip.
Key support to hold: 7.65B
Key breakout zone: 8.4B–8.5B
Invalidation: If market cap loses 7.65B and fails to bounce, reassess the setup.
Remember: Whales often buy dips, not breakouts. Let price come to you.
Let me know what you guys think about this post, don't hesitate to ask questions, drop some comments, boost this post and follow for more updates.
-Neo
#SHIB #CryptoCap #Altcoins #TradingView #CryptoAnalysis #MarketUpdate #DipBuyers #PatienceWins
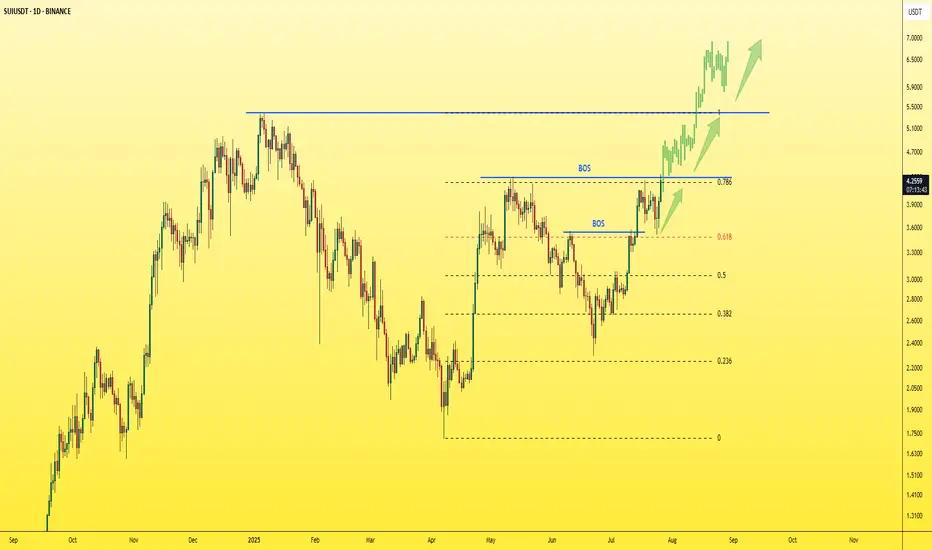
SUI - Just one step away from the explosion!The last candle on the daily chart just confirmed a BOS (Break of Structure) — a clear and strong sign of bullish continuation for the asset.
✅ This is a textbook entry for a long position.
🎯 Next target: $5 — and so far, no bearish signs in sight.
Best regards,
Ceciliones 🎯
TradeCityPro | JUP Eyes Breakout as Altseason Momentum Builds👋 Welcome to TradeCity Pro!
In this analysis, I want to review the JUP coin for you. It’s one of the projects in the Solana ecosystem, currently ranked 59 on CoinMarketCap with a market cap of $1.65 billion.
📅 Daily Timeframe
On the daily timeframe, this coin is currently sitting below a very important resistance zone at 0.6312. This is a strong resistance area and serves as the main trigger for a trend reversal in this coin.
✔️ The main support floor for JUP is located at 0.3409, a level price has tested twice before. Now it has returned to 0.6312, and we can see increased market volume at this level, which indicates tension between buyers and sellers.
✨ A breakout of 0.6312 would be a good trigger for a long position, and I plan to open a long if this level breaks. This could potentially be a long-term position with a high risk-to-reward ratio.
🔔 The next major resistance zones are at 0.7858 and 1.1435, which we can use as targets for this position.
🔽 If the price gets rejected from the top and moves down, breaking 0.4186 and 0.3409, we can look to open a short position.
🧩 The break of 0.3409 would confirm the start of a downtrend, and it's one of the key zones where I’ll definitely look to hold a short position if it breaks.
📝 Final Thoughts
This analysis reflects our opinions and is not financial advice.
Share your thoughts in the comments, and don’t forget to share this analysis with your friends! ❤️

XAUUSDHello Traders! 👋
What are your thoughts on GOLD?
Gold entered a corrective phase after reaching the top of its ascending channel. Price is now approaching the channel bottom, which coincides with a key support zone.
As long as the channel support holds, we expect a bullish reaction from this area, potentially driving price back toward the next target level.
The uptrend remains valid as long as price does not break and close below the lower boundary of the channel.
A rebound from channel support may signal the start of the next upward leg.
Invalidation occurs only if price breaks and holds below the channel.
💡 Will gold bounce from channel support and resume its rally? Share your view in the comments! 🤔👇
Don’t forget to like and share your thoughts in the comments! ❤️

SPY: Pullback or No? Hey everyone,
Posting again for next week.
My thoughts, not advice as usual.
Hope you find them helpful and I hope you all have a great and sunny weekend!
Take care and safe trades!

DOT It will grow soon...The DOT will increase $1 and reach to the top of the wedge in the coming weeks .
Best regards CobraVanguard.💚

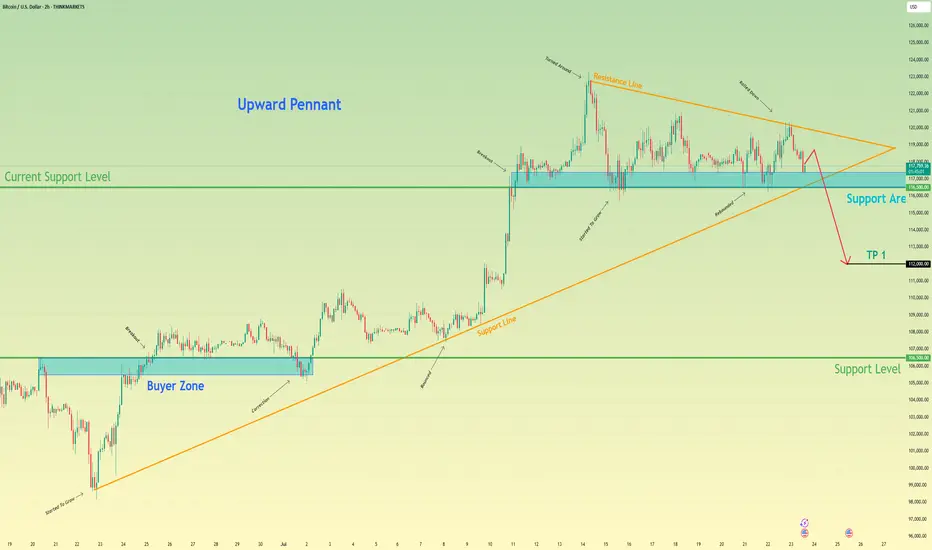
Bitcoin can start to decline and break support levelHello traders, I want share with you my opinion about Bitcoin. After completing a powerful upward impulse that originated from the buyer zone near 106500, the price action for BTC has transitioned into a corrective market phase. This consolidation has taken the form of an upward pennant, characterised by a narrowing trading range that suggests a significant directional move is forthcoming. Currently, the asset is undergoing a sequence of downward corrections within the pennant, exerting repeated pressure on the critical demand zone between 116500 and 117400. The importance of this zone is amplified by its confluence with the lower trend line of the formation itself. The primary working hypothesis is a bearish resolution, anticipating that persistent selling pressure will culminate in a decisive breakdown of this support. This event would act as a bearish breakout from the pennant, providing strong confirmation for the continuation of the downward impulsive momentum and shifting the local market structure. Therefore, the take-profit level is logically positioned at the 112000 mark. Please share this idea with your friends and click Boost 🚀
Disclaimer: As part of ThinkMarkets’ Influencer Program, I am sponsored to share and publish their charts in my analysis.
Bitcoin Correction Maturing – Long Setup Brewing!Bitcoin ( BINANCE:BTCUSDT ) has fallen by more than -4% over the past day.
Let's take a look at the reasons for the decline.
One of the key reasons behind Bitcoin’s decline in the past 24 hours ( July 25 ) could be the reduced likelihood of Jerome Powell being replaced as Chair of the Federal Reserve.
In recent days, market participants were speculating that Donald Trump might replace Powell — a scenario that was considered bullish for risk assets like Bitcoin. However, recent reports of a meeting between Trump and Powell, and signs that Powell might not be dismissed, have weakened this fundamental narrative.
This meeting may signal a truce or reduced tension between Trump’s team and Powell , which could imply a continuation of current Fed policies. That’s bad news for Bitcoin, as it removes a potential psychological tailwind from the market and dampens speculative sentiment.
As a result:
Over $500 million in liquidations(Long Positions) occurred
Weak inflows into Bitcoin ETFs
A stronger U.S. Dollar Index ( TVC:DXY )
And declining Gold( OANDA:XAUUSD ) prices over the past two days
all added additional selling pressure on BTC. Now let's take a look at Bitcoin's conditions on the 4-hour time frame .
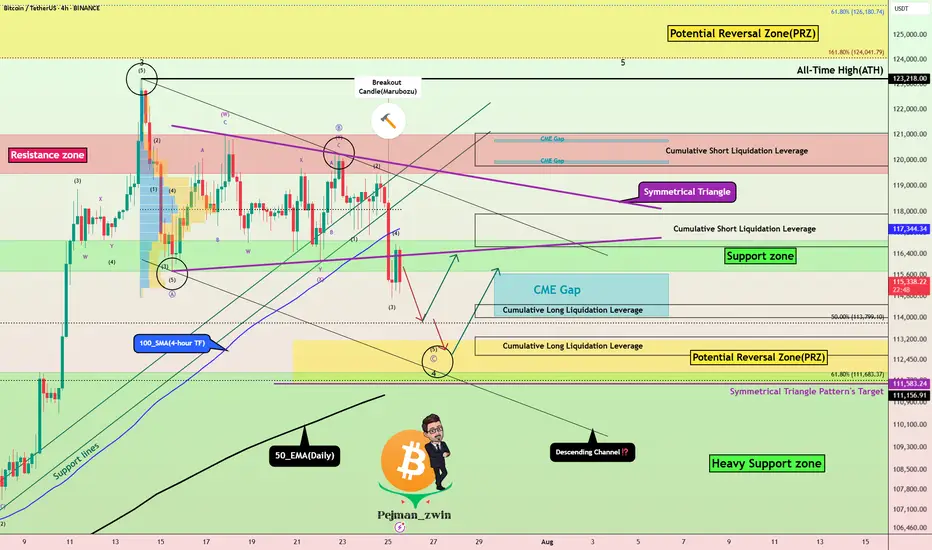
Bitcoin currently appears to have broken the Support zone($116,900-$115,730) , Support lines , 100_SMA(4-hour TF) , and the lower line of the Symmetrical Triangle Pattern with a bearish Marubozu candle .
Note : In general, trading was difficult when Bitcoin was inside a symmetrical triangle (about 10 days).
It also seems that the pullback to these zones has ended and Bitcoin is waiting for the next decline .
In terms of Elliott Wave theory , Bitcoin appears to be completing microwave 5 of microwave C of major wave 4 . There is a possibility that main wave 4 will create a descending channel and complete at the bottom of the descending channel (at Potential Reversal Zone(PRZ) ).
I expect Bitcoin to start rising again after completing the CME Gap($115,060-$114,947) from Cumulative Long Liquidation Leverage($114,480-$114,000) or Cumulative Long Liquidation Leverage($113,284-$112,603) near the PRZ and Heavy Support zone($111,980-$105,820) .
Cumulative Short Liquidation Leverage: $117,904-$116,665
Cumulative Short Liquidation Leverage: $121,046-$119,761
Do you think Bitcoin has entered a major correction, or does it still have a chance to create a new ATH?
Please respect each other's ideas and express them politely if you agree or disagree.
Bitcoin Analyze (BTCUSDT), 4-hour time frame.
Be sure to follow the updated ideas.
Do not forget to put a Stop loss for your positions (For every position you want to open).
Please follow your strategy and updates; this is just my Idea, and I will gladly see your ideas in this post.
Please do not forget the ✅' like '✅ button 🙏😊 & Share it with your friends; thanks, and Trade safe.