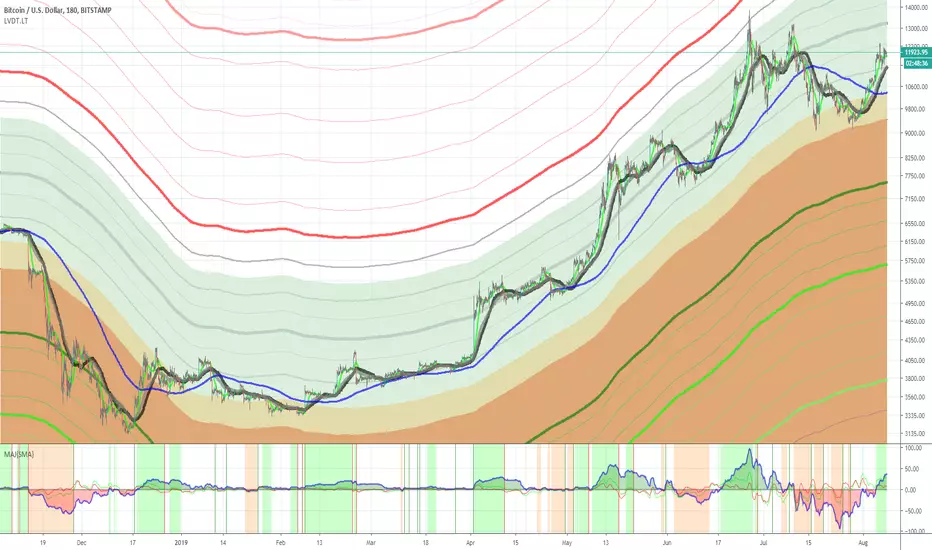
BTC to 8350 USD (200ema), if fail to hold @ 9400 USD (100ema)Bitcoin reached about previous predicted level, after "Bear Pivot" signal triggered in LIVIDITIUM signaling script.
However, PRISM oscillators still looking weak + PRISM's pSAR-based RSI still have same way to go before resetting.
Expecting BTC to drop further to ~8400 USD (200 ema) if 9400 USD (100 ema) support fails to hold, which is also where the level2 lower AEONDRIFT band level lie atm.
On the 1D time scale, BTC is still in an "overbought" state base on Fast-LIVIDITIUM {F.LVDT} dynamic levels; noting the strong red-streaks >> which can be imagined as downward forces pulling the candles down towards the 0.6 guide equilibrium level.
By falling down to 8400 USD will position the price just below the F.LVDT 0.6 equilibrium/neutral Guide line, which will turn the market to be healthily bullish again.
~ * ~ * ~ * ~ * ~ * ~ * ~ * ~ * ~ * ~ * ~ * ~ * ~ * ~ * ~ * ~ * ~ * ~ * ~ * ~ * ~
Note: In no way is this intended as a financial/investment/trading advice. You are responsible for your own investment decisions and trades.
Please exercise your own judgement for your own trades base on your own risk-aversion level and goals as an investor or a trader. The use of OTHER indicators and analysis in conjunction (tailored to your own style of investing/trading) will help improve confidence of your analysis, for you to determine your own trade decisions.
~ * ~ * ~ * ~ * ~ * ~ * ~ * ~ * ~ * ~ * ~ * ~ * ~ * ~ * ~ * ~ * ~ * ~ * ~ * ~ * ~
Please check out my other indicators sets and series, e.g.
LIVIDITIUM (dynamic levels),
AEONDRIFT (standard deviation bands),
FUSIONGAPS (MA based oscillators),
MAJESTIC (Momentum/Acceleration/Jerk Oscillators),
PRISM (PSAR based oscillator, with RSI/StochRSI as well as Momentum/Acceleration/Jerk indicators),
and more to come.
Constructive feedback and suggestions are welcome.
If you like any of my set of indicators, and it has benefited you in some ways, please consider tipping a little to my HRT fund. =D
cybernetwork @ EOS
37DzRVwodp5UZBYjCKvVoZ5bDdDqhr7798 @ BTC
MPr8Zhmpsx2uh3F5R4WD98MRJJpwuLBhA3 @ LTC
1Je6c1vvSCW7V2vA6RYDt6CEvqGYgT44F4 @ BCH
AS259bXGthuj4VZ1QPzD39W3ut4fQV5giC @ NEO
rDonew8fRDkZFv7dZYe5w3L1vJSE51zFAx @ Ripple XRP
0xc0161d27201914FC0bAe5e350a193c8658fc4742 @ ETH
GAX6UDAJ52OGZW4FVVG3WLGIOJLGG2C7CTO5ZDUK2P6M6QMYBJMSJTDL @ Stellar XLM
xrb_16s8cj8eoangfa96shsnkir3wctdzy76ajui4zexek6xmqssweu85rdjxrt4 @ Nano
~ JuniAiko
(=^~^=)v~
Lividitium


FTM: Short-term, Looking strong (Stop-Limit set to secure gains)Setting stop-limit as indicated by the red arrow to protect the 30%+ profits gained so far: using the Fast AEONDRIFT script on the 1hr chart to determine suitable stop-loss values for the next few hours.
The RSI/Stochs as well as the PRISM oscillators looking bullish on the short term (for now). Looks like FTM may still have a bit of gas left to continue higher still (with proper risk management setup of course, in case it dumps) after retesting the 15 ema line.
=====================================================================
My indicators used:
~ * ~ * ~ * ~ * ~ * ~ * ~ * ~ * ~ * ~ * ~ * ~ * ~ * ~ * ~ * ~ * ~ * ~ * ~ * ~ * ~
Note: In no way is this intended as a financial/investment/trading advice. You are responsible for your own investment decisions and trades.
Please exercise your own judgement for your own trades base on your own risk-aversion level and goals as an investor or a trader. The use of OTHER indicators and analysis in conjunction (tailored to your own style of investing/trading) will help improve confidence of your analysis, for you to determine your own trade decisions.
~ * ~ * ~ * ~ * ~ * ~ * ~ * ~ * ~ * ~ * ~ * ~ * ~ * ~ * ~ * ~ * ~ * ~ * ~ * ~ * ~
Please check out my other indicators sets and series, e.g.
LIVIDITIUM (dynamic levels),
AEONDRIFT (standard deviation bands),
FUSIONGAPS (MA based oscillators),
MAJESTIC (Momentum/Acceleration/Jerk Oscillators),
PRISM (PSAR based oscillator, with RSI/StochRSI as well as Momentum/Acceleration/Jerk indicators),
and more to come.
Constructive feedback and suggestions are welcome.
If you like any of my set of indicators, and it has benefited you in some ways, please consider tipping a little to my HRT fund. =D
cybernetwork @ EOS
37DzRVwodp5UZBYjCKvVoZ5bDdDqhr7798 @ BTC
MPr8Zhmpsx2uh3F5R4WD98MRJJpwuLBhA3 @ LTC
1Je6c1vvSCW7V2vA6RYDt6CEvqGYgT44F4 @ BCH
AS259bXGthuj4VZ1QPzD39W3ut4fQV5giC @ NEO
rDonew8fRDkZFv7dZYe5w3L1vJSE51zFAx @ Ripple XRP
0xc0161d27201914FC0bAe5e350a193c8658fc4742 @ ETH
GAX6UDAJ52OGZW4FVVG3WLGIOJLGG2C7CTO5ZDUK2P6M6QMYBJMSJTDL @ Stellar XLM
xrb_16s8cj8eoangfa96shsnkir3wctdzy76ajui4zexek6xmqssweu85rdjxrt4 @ Nano
~ JuniAiko
(=^~^=)v~

Combination of Bearish BTCUSD signals emerged. 9550USD next?I don't see a massive dump though. But I will continue to monitor the chart and update my views accordingly.
See also:
and

WANBTC Target: 0.000062 BTCSee earlier published WANBTC chart, and crude Trade Logs:
and also see my post on BTC dominance:
Setting stop-loss at 0.000046 BTC -- using my Fast Aeondrift (stdev based bands) to suggest suitable stop-limit levels to consider.
~ * ~ * ~ * ~ * ~ * ~ * ~ * ~ * ~ * ~ * ~ * ~ * ~ * ~ * ~ * ~ * ~ * ~ * ~ * ~ * ~
Note: In no way is this intended as a financial/investment/trading advice. You are responsible for your own investment decisions and trades.
Please exercise your own judgement for your own trades base on your own risk-aversion level and goals as an investor or a trader. The use of OTHER indicators and analysis in conjunction (tailored to your own style of investing/trading) will help improve confidence of your analysis, for you to determine your own trade decisions.
~ * ~ * ~ * ~ * ~ * ~ * ~ * ~ * ~ * ~ * ~ * ~ * ~ * ~ * ~ * ~ * ~ * ~ * ~ * ~ * ~
Please check out my other indicators sets and series, e.g.
LIVIDITIUM (dynamic levels),
AEONDRIFT (standard deviation bands),
FUSIONGAPS (MA based oscillators),
MAJESTIC (Momentum/Acceleration/Jerk Oscillators),
PRISM (PSAR based oscillator, with RSI/StochRSI as well as Momentum/Acceleration/Jerk indicators),
and more to come.
Constructive feedback and suggestions are welcome.
If you like any of my set of indicators, and it has benefited you in some ways, please consider tipping a little to my HRT fund. =D
cybernetwork @ EOS
37DzRVwodp5UZBYjCKvVoZ5bDdDqhr7798 @ BTC
MPr8Zhmpsx2uh3F5R4WD98MRJJpwuLBhA3 @ LTC
1Je6c1vvSCW7V2vA6RYDt6CEvqGYgT44F4 @ BCH
AS259bXGthuj4VZ1QPzD39W3ut4fQV5giC @ NEO
rDonew8fRDkZFv7dZYe5w3L1vJSE51zFAx @ Ripple XRP
0xc0161d27201914FC0bAe5e350a193c8658fc4742 @ ETH
GAX6UDAJ52OGZW4FVVG3WLGIOJLGG2C7CTO5ZDUK2P6M6QMYBJMSJTDL @ Stellar XLM
xrb_16s8cj8eoangfa96shsnkir3wctdzy76ajui4zexek6xmqssweu85rdjxrt4 @ Nano
~ JuniAiko
(=^~^=)v~

BITCOIN DOMINANCE {update}: More gains for Alts vs BTC ahead?Even though BTC.D doesn't always reflect the state of every individual altcoins, I still personally find it useful to refer to it as a measure of the level of "tendency towards risk-taking" in the market.
Trend wise, BTC.D is still conforming to the upward channel drawn.
However, recent history indicates that prices above the thick-grey LIVIDITIUM (LVDT) level is considered "overbought".
The PRISM's psar-derived oscillator also seems to be heading towards flipping "red" again and PRISM's momentum oscillator as well as the acceleration/jerk ribbon are now on a downward trajectory as well!
I speculatively predict that BTC.D will first go down the "pink" path (continuing a minor "alt season" vs. BTC, but not necessarily vs. USD save for a selected handful) -- with BTC dropping further and significantly more so than the alts (i.e. semi-decoupled), before rebounding at the next extrapolated LVDT level below, marking the continuation of the BTC parabolic bull market (leaving alts behind once again).

WANBTC: Setting buy back order of WAN btwn 0.00003-0.0000263 BTCEarlier, after the massive pump, I've set limit sell of WAN at 0.0000509 BTC which got triggered.
Setting a buy-back limit buy orders of WAN, cost-averaging btwn 0.00003-0.0000263 BTC, with the aid of the LIVIDITIUM dynamic band levels.
See: t.me
QUOTE "I still think WAN still has strength to continue up more personally. But Im setting stop-losses to protect my gains so far at 0.0000509 BTC/WAN personally, base on my Fast AEONDRIFT script to help suggest suitable stop limit levels on the 5mins candles chart."
t.me

BTCUSD: Why I am not expecting a massive dump coming up.Using the FUSIONGAP oscillator (Zoomed out).
The FUSIONGAPS series oscillators can also be set to log-scale to determine oversold/bought condition, or bullish/bearish phase/flip of the market.
This is why I am not expecting a massive dump down to an all time low, or anything too brutal.
If BTC's next move is a further downward correction, I'd expected it to drop to ~9000 USD or even ~8500 USD at the very most.
Observing that there are way too many people standing on the sideline waiting to buy BTC below 10kUSD, and especially below 9kUSD.
And also quite likely, the market may instead do the opposite and move on higher, leaving those who have not bought in yet and are still waiting behind.
Hence, at the moment, I believe it is unlikely for BTC to drop lower than that -- but will need to reassess the chart when the time comes, of course.

Bullish short-term signals for ADASee descriptions in chart.
Need to continue to monitor at higher time-frames to assess mid-to-long term trends.

BTC.D: More alt gains until PRISM’s psar-based RSI/Stochs resetsAs I had also posted on the 21st August in a telegram channel as a reply.
t.me
More minor alt gains until PRISM’s psar-based RSI/Stochs resets.
Noteworthy: However, divergence in the progressive tops of the psar oscillator where it is descending, while BTC dominance is ascending.

BTCUSD: mixed but conditionally bullish-biased signals.Bitcoin to rebound back to top black resistance level, if price continues to hold above red support line — allowing the PRISM RSI and STOCHS to reset. Momentum still in the negative though, and acceleration and Jerk oscillators doesn’t look to be rebounding yet. Need to wait till PRISM acceleration oscillator to turn positive first before deciding on an entry time.
Suitable stop loss might be at slightly below the lower black support line perhaps.

How to use the Fast LIVIDITIUM dynamic level & PRISM oscillatorReading the chart using the FLVDT and PRISM oscillator.

Litecoin to fall a bit more (before rebounding at support?)LTCUSD likely to fall to as low as 74-72 USD before (hopefully -- depending on the MAJESTIC-X indicator and RSI/STOCHS) finding support and rebounding to 83 USD, and hopefully continuing up to 61.8% Fib level at 93 USD in around a week.
Using the MAJESTIC-X (Momentum/Acceleration/Jerk oscillators) with the candle range set to "15":
The red jerk oscillator is now crossing the green acceleration candle, with all oscillators in then negative, hinting that the price has more to fall atm.
Need the Momentum histogram to start negatively peaking or plateauing, before prices can make a turn-around.
Will continue monitoring how the chart evolves through the week.
Indicators also used:
Fast LIVIDITIUM Low Volatility Channel {EMA} - dynamic support/resistance levels
as well as the
AEONDRIFT (with FUSIONGAPS indicators) - Stdev levels , with built-in indicators derived from the FUSIONGAPS oversold/bought oscillator and death/golden cross indicators, coupled with its momentum and accelerator based reversal indicators as well.

More pain ahead for Altcoins after some initial gains? Bearish for altcoins in the mid to long term if BTC.D finds support at ca. 68.7% and rebounds (at or before 6th Sept).
Neutral for altcoins , if BTC.D drops below 68.7%, or fails to move higher away from 68.7% after 6th Sept.
Bullish for altcoins , if BTC.D falls below 68.7% and retest as resistance with immediate target down to 66.64% (then chart to be reassessed).

BTC have further to fall, but to complete massive Bull Flag?First target = 9112 USD
Second target = 8500 USD
and if that fails, BTC will likely fall to 7230.
And if it finds supports and rebounds at any of these levels, I speculate that there is a chance this final "capitulation" to drop out the "weak-hands" effectively completes the massive bull flag formation, to wind up one final time to propel BTC to fresh new heights.
Need to closely monitor the RSI, Ichimoku cloud, as well as momentum/acceleration oscillators and MA signals (e.g. using the FUSIONGAPS and MAJESTIC-X oscillators) to see how things play out.
See also:

Litecoin ready for a next bull cycle? { LTCUSD }Completion of a Bull Flag Formation?
See chart
Candle range of the Majestic-X oscillator custom set to 15 candles: Bullish pattern emerging, coinciding with previous significant pumps as well.

BTCUSD still on an upward trajectory.Guide band range set to = 4 on the weekly chart.
LVDT levels changed from "LINE" to "Area" and colors adjusted accordingly for those levels.
Price needs to stay within the green band shown.
If price moves to the upper bound within the green band, it is more likely to come down.
If price move to the lower bound within the green band, it is more likely to rebound upwards.
If price breaks significantly into the upper red zone above the green band, it is very likely to get strongly rejected downwards (i.e. during the past ATHs).
For price to advance higher, the collective LVDT band levels needs to first climb higher first to provide the upward "channel" for sustainable growth.
Right now, the LVDT bands looks to be on a healthy steady growth trajectory.

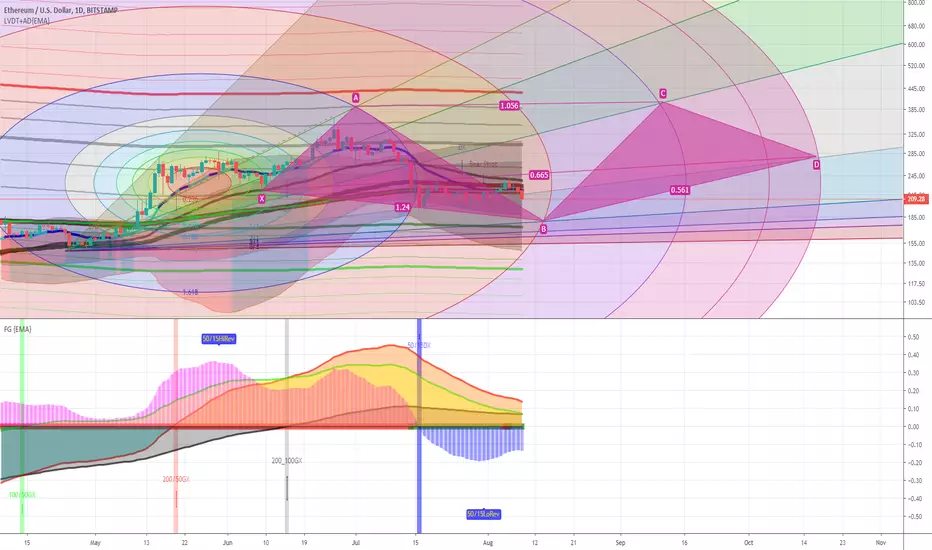
Bullish ascending trend shift for ETH? (ETHUSD)If ETH finds support above the ascending trendline, then next target = 240-255 USD
If ETH breaks below the ascending trendline, then target = 180-170 USD.
See also my previous BTC dominance (BTC.D) chart analysis calling for a reversal at about 71%.

An ETHUSD chart that I had drawn in June but forgot to publish.Will ETHUSD sees a positive retracement after passing as my chart predicts?
Time will tell.
ETH is still going down down down.Need to see (at least) the (FUSIONGAPS and MAJESTIC) acceleration and jerk oscillators turning positive again at higher time frames (i.e. 1D or 3D) to confirm a turn-around.


LIVIDITIUM {LVDT} Lite {Dynamic Fib Levels}LVDT lines change to "Area with Gaps" and color adjusted accordingly to define zones.
Observe how well the price action interacts with the different levels.
The rest is self explanatory.
The main levels are defined by the thicker lines.
The "finestructures" are defined by thinner lines.
To ideally be used in conjunction with the MAJESTIC oscillators, which shows the Momentum , Acceleration , and Jerk (i.e. the Acceleration rate of change) of the LVDT lines.
Future Update: Implement text labeling of the individual line levels.