$LTC.X, Does Litecoin have more room to grow?Hi Community,
I am following up from my previous idea and I am trying to make sense of supply & demand zones, and volume. I am not an expert in this at all, so I'd appreciate your thoughts.
The 4H chart shows decreasing volume and an RSI in overbought zone. What I can't make my mind up is whether the volume is suggesting a slight decrease to retest the previous resistance at 186$, or if we have exhausted supply. In the latter case, we would be looking at a stronger retracement to the 180$ area, or even down to 165$.
The 1H chart shows a bearish divergence on the RSI, and decreasing volume.
However, the 1D chart shows a wonderful cup & handle formation with price just breaking the entry point that promises well in the medium-longer term.
So, what do you think Litecoin will do next? And what are your thoughts on the supply & demand + volume considerations?
Still learning here, so any constructive feedback and positive vibes are welcome.
Thank you and Happy trading!
------------------------------------------------------
Needless to say, this is not financial advice!
Llitecoin

Litecoin is Trading in a Tight RangeThe LTC/USD pair continue fell down since the its halving in late August. The coin has lost nearly half of its value since that time. Moreover, Litecoin’s hash rate has decreased by almost 70% since the halving, which means that miners are not so happy and motivated to support the network.
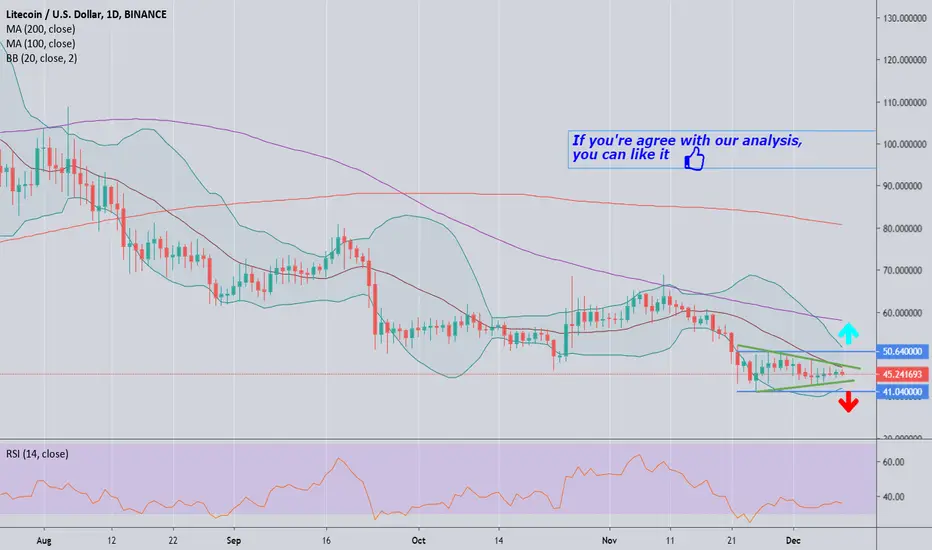
At the time of writing, Litecoin was down by 0.85% for the last 24 hours. Price action on the daily chart is narrowing within a bearish pennant structure. At the same time RSI indicator (36) is near to its oversold zone. The pair also is limited by the middle line of the daily Bollinger Bands around $46.85. Once it is out of the way and the price break the upper line of the pennant, the upside momentum is likely to gain traction with the next focus on $50.64. There is the upper boundary of the recent consolidation range (also psychological area). It is followed by the upper line of the daily Bollinger Bands at $51.74.
Critical weekly support should be noted at the $45-44 region. And failure to hold could invite another wave of selling. In that event the bears should send the price towards $43.70. This barrier is created by the lower boundary of the above-said pennant. A clear break there will send the price for testing December low at $42.78. Once it is broken, the lower line of the consolidation channel of $41.04 will come into view.
LTCUSD watching monthly closeLitecoin remains technically weak headed into the monthly price close, as the popular crypto struggles to regain bullish momentum. A large monthly reversal candle and a monthly price close below the psychological $100.00 level should be considered bearish for the LTCUSD pair. Overall, continued selling down towards the $70.00 level remains the favored scenario.
The LTCUSD pair is only bullish while trading above the $100.00 level, key resistance is found at the $105.00 and $120.00 levels.
If the LTCUSD pair trades below the $100.00 level, key support is found at the $88.00 and $70.00 levels.


LTC Daily Trend Close to a ChangeSimilar to BTC, the LTC bulls are trying to form a higher low and higher high on the daily chart.
The bulls are shifting momentum back in their favor and it could be marked with a daily bull MACD cross as well.
The daily MACD is what gave confidence in ETH to hold from $775 to the $900s.
Correlation to BTC still present, which is good for the bulls when BTC is making the same bull break and shift.
I currently have smaller swing positions in both LTC and BTC and will be holding them until we lose 4 hour higher lows and up trends.
Both are due for some healthy hourly consolidation after breaking out the last few hours.
Target is BTC all time high, LTC $300 but it will likely take a few days at the earliest.
