LOKAUSDT: Critical Support Zone Identified - Your Winning Entry Here's the reality: While others hesitate and overthink, successful traders act when opportunity presents itself clearly.
The Setup That Separates Winners From Losers
One major support zone (marked in blue box) tells the complete story. My footprint CDV analysis confirms what institutional money already knows - this level isn't a suggestion, it's a battle line.
Your Proven Path Forward
The Blue Box Zone: Prime accumulation target - where smart money positions for the next move up
The Choice Is Simple
Execute at this level with precision, or watch from the sidelines as others capitalize. My track record speaks for itself - this isn't hope-based analysis, it's data-driven opportunity.
What Happens Next
Follow this blueprint: You position at the blue box support, manage risk precisely, and capture the inevitable bounce that follows institutional accumulation.
Ignore it: Watch others profit while you chase price higher after the breakout.
Bottom Line
The market has drawn the map. The footprint data confirms the plan. Your success depends on one thing: execution when opportunity knocks.
The zone is marked. The analysis is complete. The choice is yours.
LOKAUSDT

LOKAUSDT Forming Falling WedgeLOKAUSDT is currently showing an interesting setup that has caught the attention of crypto traders and investors. The pair is forming a classic falling wedge pattern, which is widely known as a bullish reversal pattern in technical analysis. This pattern, combined with good trading volume, indicates that LOKA may be preparing for a strong breakout to the upside. With an expected gain of 60% to 70%+, this setup could offer a compelling opportunity for those looking to ride the next wave in altcoins.
League of Kingdoms (LOKA) is a well-known play-to-earn and blockchain gaming project that has been steadily gaining traction in the GameFi space. The project allows players to build kingdoms, engage in battles, and earn rewards, which drives community engagement and token demand. As interest in blockchain gaming and NFTs continues to grow, the underlying fundamentals for LOKAUSDT could provide additional momentum to push prices higher once the wedge breakout occurs.
On the technical side, traders will be watching for a decisive breakout above the wedge resistance line, ideally supported by a surge in volume to confirm the trend reversal. If this scenario plays out, LOKAUSDT could easily reach its expected target zone with gains of 60% to 70% or more. Investors should also stay alert to news and partnerships from the League of Kingdoms team that might act as further catalysts for price action.
✅ Show your support by hitting the like button and
✅ Leaving a comment below! (What is You opinion about this Coin)
Your feedback and engagement keep me inspired to share more insightful market analysis with you!

LOKA/USDT – Breakout WatchLOKA has broken out of a descending channel on the 1H chart, showing early signs of bullish momentum. The price has breached the upper boundary of the falling structure, supported by strong volume and clean trend confirmation.
Support Levels:
$0.05293 (recent breakout level)
$0.04474 (range low support)
Resistance / Target Levels:
$0.06104
$0.06732
$0.07253
Stoploss: Below $0.050 to protect against false breakout
Trade Idea:
Entry on retest near $0.053–$0.054 for a safer risk-reward setup.
Targets align with previous horizontal resistances and Fibonacci levels.
LOKA looks poised for a potential trend reversal if the momentum sustains above the channel. A break and hold above $0.061 would open room for higher targets.
As always, risk management is key.
Not financial advice – DYOR.

#LOKA Trading opportunity for LOKAUSDT#LOKA
The price is moving within a descending channel on the 1-hour frame, adhering well to it, and is on its way to breaking it strongly upwards and retesting it.
We have a bounce from the lower boundary of the descending channel. This support is at 0.0520.
We have a downtrend on the RSI indicator that is about to break and retest, supporting the upside.
There is a major support area in green at 0.00500, which represents a strong basis for the upside.
Don't forget a simple thing: ease and capital.
When you reach the first target, save some money and then change your stop-loss order to an entry order.
For inquiries, please leave a comment.
We have a trend to hold above the 100 Moving Average.
Entry price: 0.0531
First target: 0.0543
Second target: 0.0560
Third target: 0.0580
Don't forget a simple thing: ease and capital.
When you reach the first target, save some money and then change your stop-loss order to an entry order.
For inquiries, please leave a comment.
Thank you.

NEARUSDT UPDATE
Pattern: Descending Triangle Breakout
Current Price: \$2.937
Target Price: \$3.60
Target % Gain: 22.69%
Technical Analysis: NEAR has broken out of a descending triangle on the 8H chart. Price is closing above resistance with decent momentum, indicating a potential move toward \$3.60.
Time Frame: 8H

SCRTUSDT UPDATE
SCRT Technical Setup
Pattern: Falling Wedge Breakout
Current Price: $0.2453
Target Price: $0.59
Target % Gain: 160.55%
Technical Analysis: SCRT has broken out of a falling wedge on the 1D chart, indicating a bullish reversal. The breakout is confirmed with strong green candles and volume build-up.
Time Frame: 1D
Risk Management Tip: Always use proper risk management.

DEGOUSDT UPDATEDEGO/USDT Technical Setup
Pattern: Falling Wedge Breakout
Current Price: $1.808
Target Price: $3.70
Target % Gain: 115.05%
Technical Analysis: DEGO broke out of a falling wedge on the 1D chart, showing bullish momentum with a clean candle close above resistance and follow-through volume. Chart suggests potential continuation toward the measured target.
Time Frame: 1D
Risk Management Tip: Always use proper risk management.

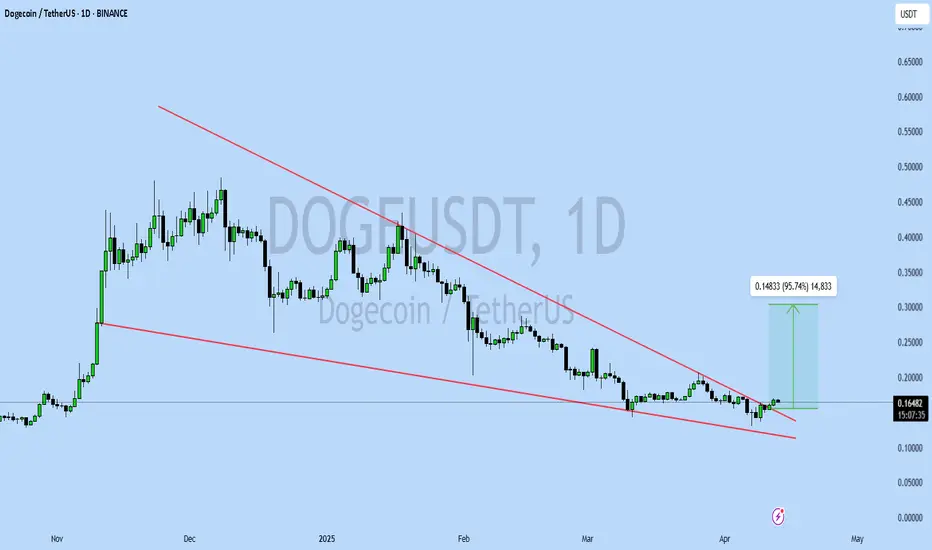
DOGEUSDT UPDATEDOGEUSDT is a cryptocurrency trading at $0.16485, with a target price of $0.30000. This represents a potential gain of over 90%. The technical pattern observed is a Bullish Falling Wedge, indicating a possible trend reversal. This pattern suggests that the downward trend may be coming to an end. A breakout from the wedge could lead to a significant upward movement in price. The Bullish Falling Wedge is a positive indicator, signaling a potential price surge. Investors are showing optimism about DOGEUSDT's future performance. The current price may present a buying opportunity. Reaching the target price would result in substantial returns for investors. DOGEUSDT is positioned for a potential breakout and significant gains.
SUPERUSDT UPDATESUPERUSDT is a cryptocurrency trading at $0.5519, with a target price of $1.2000. This represents a potential gain of over 170%. The technical pattern observed is a Bullish Falling Wedge, indicating a possible trend reversal. This pattern suggests that the downward trend may be coming to an end. A breakout from the wedge could lead to a significant upward movement in price. The Bullish Falling Wedge is a positive indicator, signaling a potential price surge. Investors are showing optimism about SUPERUSDT's future performance. The current price may present a buying opportunity. Reaching the target price would result in substantial returns for investors. SUPERUSDT is positioned for a potential breakout and significant gains.

STRAXUSDT UPDATESTRAXUSDT is a cryptocurrency trading at $0.04440, with a target price of $0.07000. This represents a potential gain of over 80%. The technical pattern observed is a Bullish Falling Wedge, indicating a possible trend reversal. This pattern suggests that the downward trend may be coming to an end. A breakout from the wedge could lead to a significant upward movement in price. The Bullish Falling Wedge is a positive indicator, signaling a potential price surge. Investors are showing optimism about STRAXUSDT's future performance. The current price may present a buying opportunity. Reaching the target price would result in substantial returns for investors. STRAXUSDT is positioned for a potential breakout and significant gains.

KDAUSDT UPDATEKDAUSDT is a cryptocurrency trading at $0.4898. Its target price is $0.8000, indicating a potential 90%+ gain. The pattern is a Bullish Falling Wedge, a reversal pattern signaling a trend change. This pattern suggests the downward trend may be ending. A breakout from the wedge could lead to a strong upward move. The Bullish Falling Wedge is a positive signal, indicating a potential price surge. Investors are optimistic about KDAUSDT's future performance. The current price may be a buying opportunity. Reaching the target price would result in significant returns. KDAUSDT is poised for a potential breakout and substantial gains.

PEPEUSDT UPDATEPEPEUSDT is a cryptocurrency trading at $0.00729. Its target price is $0.01400, indicating a potential 100%+ gain. The pattern is a Bullish Falling Wedge, a reversal pattern signaling a trend change. This pattern suggests the downward trend may be ending. A breakout from the wedge could lead to a strong upward move. The Bullish Falling Wedge is a positive signal, indicating a potential price surge. Investors are optimistic about PEPEUSDT's future performance. The current price may be a buying opportunity. Reaching the target price would result in significant returns. PEPEUSDT is poised for a potential breakout and substantial gains.

SHELLUSDT UPDATESHELLUSDT is a cryptocurrency trading at $0.3100. Its target price is $0.4500, indicating a potential 60%+ gain. The pattern is a Bullish Falling Wedge, a reversal pattern signaling a trend change. This pattern suggests the downward trend may be ending. A breakout from the wedge could lead to a strong upward move. The Bullish Falling Wedge is a positive signal, indicating a potential price surge. Investors are optimistic about SHELLUSDT's future performance. The current price may be a buying opportunity. Reaching the target price would result in significant returns. SHELLUSDT is poised for a potential breakout and substantial gains.

ACAUSDT UPDATEACAUSDT is a cryptocurrency trading at $0.0430. Its target price is $0.0800, indicating a potential 80%+ gain. The pattern is a Bullish Falling Wedge, a reversal pattern signaling a trend change. This pattern suggests the downward trend may be ending. A breakout from the wedge could lead to a strong upward move. The Bullish Falling Wedge is a positive signal, indicating a potential price surge. Investors are optimistic about ACAUSDT's future performance. The current price may be a buying opportunity. Reaching the target price would result in significant returns. ACAUSDT is poised for a potential breakout and substantial gains.

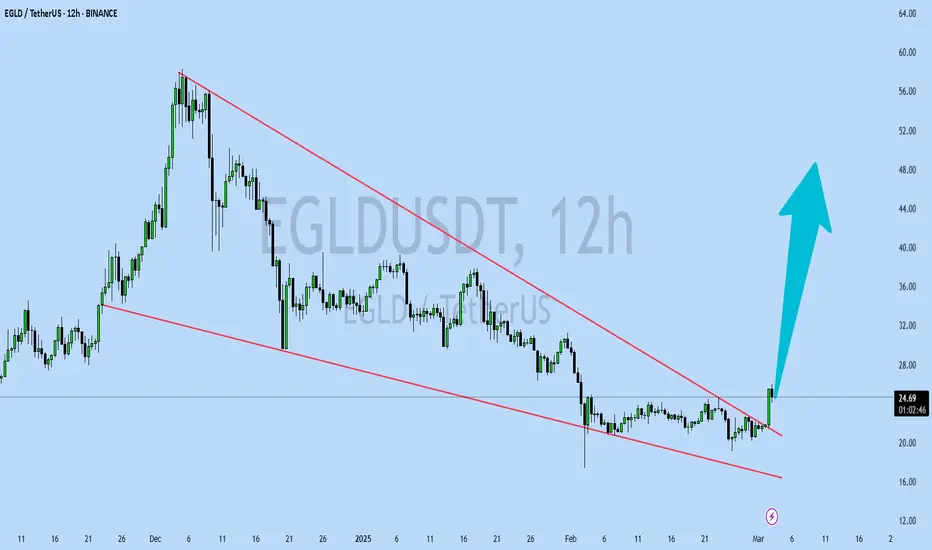
EGLDUSDT UPDATEEGLDUSDT is a cryptocurrency trading at $24.65. Its target price is $48.00, indicating a potential 90%+ gain. The pattern is a Bullish Falling Wedge, a reversal pattern signaling a trend change. This pattern suggests the downward trend may be ending. A breakout from the wedge could lead to a strong upward move. The Bullish Falling Wedge is a positive signal, indicating a potential price surge. Investors are optimistic about EGLDUSDT's future performance. The current price may be a buying opportunity. Reaching the target price would result in significant returns. EGLDUSDT is poised for a potential breakout and substantial gains.
STXUSDT UPDATESTXUSDT is a cryptocurrency trading at $0.900. Its target price is $1.600, indicating a potential 90%+ gain. The pattern is a Bullish Falling Wedge, a reversal pattern signaling a trend change. This pattern suggests the downward trend may be ending. A breakout from the wedge could lead to a strong upward move. The Bullish Falling Wedge is a positive signal, indicating a potential price surge. Investors are optimistic about STXUSDT's future performance. The current price may be a buying opportunity. Reaching the target price would result in significant returns. STXUSDT is poised for a potential breakout and substantial gains.

OPUSDT UPDATEOPUSDT is a cryptocurrency trading at $2.000. However, the target price is unusually lower at $0.600, which seems incorrect. Typically, a target price is higher than the current price. Assuming the target price is actually higher, the potential gain would be significant. The pattern is a Bullish Falling Wedge, a reversal pattern signaling a trend change. This pattern suggests the downward trend may be ending. A breakout from the wedge could lead to a strong upward move. The Bullish Falling Wedge is a positive signal, indicating a potential price surge. Investors are optimistic about OPUSDT's future performance. The current price may be a buying opportunity. Reaching the corrected target price would result in significant returns.

LPTUSDT UPDATELPTUSDT is a cryptocurrency trading at $7.414. Its target price is $14.000, indicating a potential 90%+ gain. The pattern is a Bullish Falling Wedge, a reversal pattern signaling a trend change. This pattern suggests the downward trend may be ending. A breakout from the wedge could lead to a strong upward move. The Bullish Falling Wedge is a positive signal, indicating a potential price surge. Investors are optimistic about LPTUSDT's future performance. The current price may be a buying opportunity. Reaching the target price would result in significant returns. LPTUSDT is poised for a potential breakout and substantial gains.

SEIUSDT UPDATESEIUSDT is a cryptocurrency trading at $0.2740. Its target price is $0.4500, indicating a potential 60%+ gain. The pattern is a Bullish Falling Wedge, a reversal pattern signaling a trend change. This pattern suggests the downward trend may be ending. A breakout from the wedge could lead to a strong upward move. The Bullish Falling Wedge is a positive signal, indicating a potential price surge. Investors are optimistic about SEIUSDT's future performance. The current price may be a buying opportunity. Reaching the target price would result in significant returns. SEIUSDT is poised for a potential breakout and substantial gains.

CELRUSDT UPDATECELRUSDT is a cryptocurrency trading at $0.01372. Its target price is $0.02000, indicating a potential 60%+ gain. The pattern is a Bullish Falling Wedge, a reversal pattern signaling a trend change. This pattern suggests the downward trend may be ending. A breakout from the wedge could lead to a strong upward move. The Bullish Falling Wedge is a positive signal, indicating a potential price surge. Investors are optimistic about CELRUSDT's future performance. The current price may be a buying opportunity. Reaching the target price would result in significant returns. CELRUSDT is poised for a potential breakout and substantial gains.

MKRUSDT UPDATEMKRUSDT is a cryptocurrency trading at $1,116. Its target price is $1,700, indicating a potential 55%+ gain. The pattern is a Bullish Falling Wedge, a reversal pattern signaling a trend change. This pattern suggests the downward trend may be ending. A breakout from the wedge could lead to a strong upward move. The Bullish Falling Wedge is a positive signal, indicating a potential price surge. Investors are optimistic about MKRUSDT's future performance. The current price may be a buying opportunity. Reaching the target price would result in significant returns. MKRUSDT is poised for a potential breakout and substantial gains.

HOOKUSDT UPDATEHOOKUSDT is a cryptocurrency trading at $0.2285. Its target price is $0.4000, indicating a potential 120%+ gain. The pattern is a Bullish Falling Wedge, a reversal pattern signaling a trend change. This pattern suggests the downward trend may be ending. A breakout from the wedge could lead to a strong upward move. The Bullish Falling Wedge is a positive signal, indicating a potential price surge. Investors are optimistic about HOOKUSDT's future performance.

JASMYUSDT UPDATEJASMYUSDT is a cryptocurrency trading at $0.03336. Its target price is $0.06000, indicating a potential 100%+ gain. The pattern is a Bullish Falling Wedge, a reversal pattern signaling a trend change. This pattern suggests the downward trend may be ending. A breakout from the wedge could lead to a strong upward move. The Bullish Falling Wedge is a positive signal, indicating a potential price surge. Investors are optimistic about JASMYUSDT's future performance. The current price may be a buying opportunity. Reaching the target price would result in significant returns. JASMYUSDT is poised for a potential breakout and substantial gains.
