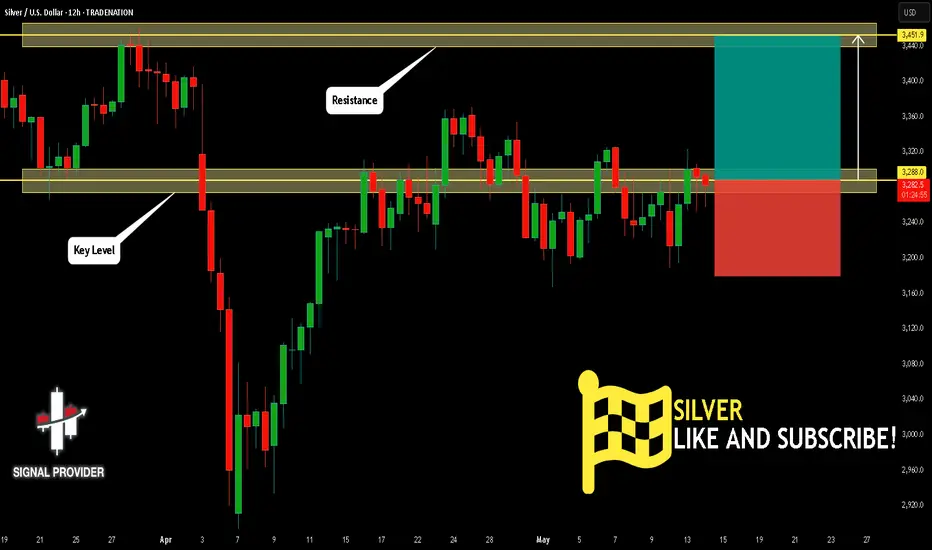
SILVER Is Going Up! Long!
Please, check our technical outlook for SILVER.
Time Frame: 12h
Current Trend: Bullish
Sentiment: Oversold (based on 7-period RSI)
Forecast: Bullish
The market is approaching a key horizontal level 3,288.0.
Considering the today's price action, probabilities will be high to see a movement to 3,451.9.
P.S
Please, note that an oversold/overbought condition can last for a long time, and therefore being oversold/overbought doesn't mean a price rally will come soon, or at all.
Disclosure: I am part of Trade Nation's Influencer program and receive a monthly fee for using their TradingView charts in my analysis.
Like and subscribe and comment my ideas if you enjoy them!
Long!!!!
EUR/AUD BUYERS WILL DOMINATE THE MARKET|LONG
EUR/AUD SIGNAL
Trade Direction: long
Entry Level: 1.729
Target Level: 1.801
Stop Loss: 1.681
RISK PROFILE
Risk level: medium
Suggested risk: 1%
Timeframe: 1D
Disclosure: I am part of Trade Nation's Influencer program and receive a monthly fee for using their TradingView charts in my analysis.
✅LIKE AND COMMENT MY IDEAS✅

EUR/GBP BEST PLACE TO BUY FROM|LONG
Hello, Friends!
We are now examining the EUR/GBP pair and we can see that the pair is going down locally while also being in a downtrend on the 1W TF. But there is also a powerful signal from the BB lower band being nearby indicating that the pair is oversold so we can go long from the support line below and a target at 0.854 level.
Disclosure: I am part of Trade Nation's Influencer program and receive a monthly fee for using their TradingView charts in my analysis.
✅LIKE AND COMMENT MY IDEAS✅

We need SWEEPS on Gold for a Bigger movePatiently waiting for gold to give us impulsive activity to indicate for a much bigger move. Need it to break outside of the current value first before I'm interested in a solid direction.

GOLD My Opinion! BUY!
My dear friends,
GOLD looks like it will make a good move, and here are the details:
The market is trading on 3211.4 pivot level.
Bias - Bullish
Technical Indicators: Supper Trend generates a clear long signal while Pivot Point HL is currently determining the overall Bullish trend of the market.
Goal - 3239.5
Recommended Stop Loss -3197.1
About Used Indicators:
Pivot points are a great way to identify areas of support and resistance, but they work best when combined with other kinds of technical analysis
Disclosure: I am part of Trade Nation's Influencer program and receive a monthly fee for using their TradingView charts in my analysis.
———————————
WISH YOU ALL LUCK

EURUSD Trading Opportunity! BUY!
My dear friends,
Please, find my technical outlook for EURUSD below:
The instrument tests an important psychological level 1.1140
Bias - Bullish
Technical Indicators: Supper Trend gives a precise Bullish signal, while Pivot Point HL predicts price changes and potential reversals in the market.
Target - 1.1281
Recommended Stop Loss - 1.1066
About Used Indicators:
Super-trend indicator is more useful in trending markets where there are clear uptrends and downtrends in price.
Disclosure: I am part of Trade Nation's Influencer program and receive a monthly fee for using their TradingView charts in my analysis.
———————————
WISH YOU ALL LUCK

GBPNZD: Bullish Forecast & Outlook
The recent price action on the GBPNZDpair was keeping me on the fence, however, my bias is slowly but surely changing into the bullish one and I think we will see the price go up.
Disclosure: I am part of Trade Nation's Influencer program and receive a monthly fee for using their TradingView charts in my analysis.
❤️ Please, support our work with like & comment! ❤️

BTC - New Short-Term Long!Hello TradingView Family / Fellow Traders. This is Richard, also known as theSignalyst.
📈BTC has been overall bullish trading within the rising channel marked in blue.
Moreover, the green zone is a strong demand and structure.
🏹 Thus, the highlighted blue circle is a strong area to look for buy setups as it is the intersection of structure and lower blue trendline acting non-horizontal support.
📚 As per my trading style:
As #BTC retests the blue circle zone, I will be looking for bullish reversal setups (like a double bottom pattern, trendline break , and so on...)
📚 Always follow your trading plan regarding entry, risk management, and trade management.
Good luck!
All Strategies Are Good; If Managed Properly!
~Rich

GOLD Will Go Up! Buy!
Here is our detailed technical review for GOLD.
Time Frame: 12h
Current Trend: Bullish
Sentiment: Oversold (based on 7-period RSI)
Forecast: Bullish
The market is trading around a solid horizontal structure 3,242.49.
The above observations make me that the market will inevitably achieve 3,415.14 level.
P.S
Please, note that an oversold/overbought condition can last for a long time, and therefore being oversold/overbought doesn't mean a price rally will come soon, or at all.
Disclosure: I am part of Trade Nation's Influencer program and receive a monthly fee for using their TradingView charts in my analysis.
Like and subscribe and comment my ideas if you enjoy them!

AUDCAD Is Very Bullish! Buy!
Here is our detailed technical review for AUDCAD.
Time Frame: 1D
Current Trend: Bullish
Sentiment: Oversold (based on 7-period RSI)
Forecast: Bullish
The market is approaching a significant support area 0.898.
The underlined horizontal cluster clearly indicates a highly probable bullish movement with target 0.913 level.
P.S
Overbought describes a period of time where there has been a significant and consistent upward move in price over a period of time without much pullback.
Disclosure: I am part of Trade Nation's Influencer program and receive a monthly fee for using their TradingView charts in my analysis.
Like and subscribe and comment my ideas if you enjoy them!

BNB/USDT Potential UpsidesHey Traders, in today's trading session we are monitoring BNBUSDT for a buying opportunity around 630 zone, BNBUSDT is trading in an uptrend and currently is in a correction phase in which it is approaching the trend at 630 support and resistance area.
Trade safe, Joe.

Ripple is Nearing an Important Support!!! Hey Traders, in today's trading session we are monitoring XRPUSDT for a buying opportunity around 2.17 zone, Ripple is trading in an uptrend and currently is in a correction phase in which it is approaching the trend at 2.17 support and resistance area.
Trade safe, Joe.

HelenP. I Bitcoin will continue to grow inside upward channelHi folks today I'm prepared for you Bitcoin analytics. The price has recently shown another confident bullish impulse, pushing higher within a clean ascending channel. The key moment was the breakout above the resistance zone, which had previously acted as a ceiling for the price. This breakout marked the continuation of a higher-high, higher-low sequence that confirms the strength of the ongoing trend. Then the market returned to retest this former resistance, now acting as support, and immediately bounced, reinforcing buyer control and validating the area as a foundation for the next move. Now BTC is holding firm in the upper half of the channel, maintaining its position above the trend line with little sign of weakness. This combination of sustained bullish structure, well-respected technical levels, and steady volume behavior suggests that the market is still preparing for higher levels. With the current structure and momentum, I expect BTCUSDT will continue its upward path within the channel. My goal is 108700 points, which aligns almost with the resistance line of the upward channel. If you like my analytics you may support me with your like/comment ❤️

LINK Daily breakout?One of the most important crypto projects is undoubtedly Chainlink. Having been in a downtrend like must altcoins ever since President Trumps inauguration , LINK looks to finally be ready to exit the bearish trend channel for the first time this calendar year using the newly flipped 1D 200 EMA as a launchpad or is this a local top and the trend continues?
For the bulls a double bottom at $10.15 followed by a higher lows and now a higher high is a strong argument for a flip to bullish structure, however a breakout is needed to confirm this bullish flip in structure and with BTC + most majors at local resistance levels and looking in need of a cool off, this may be too much to ask of LINK at this time.
The bears would say this is business as usual and a rejection off the upper limit maintains the bearish trend, a loss of the 1D 200 EMA would definitely increase the likeliness this outcome.

USDJPY / 1 DAY / BULLHello Guys;
My USDJPY target level is 147,500.
My target may come a bit late because this trade is a swing trade.
I would appreciate it very much if you do not miss your likes within the framework of Respect for Labor Thank you very much in advance

EURUSD: Long Trading Opportunity
EURUSD
- Classic bullish setup
- Our team expects bullish continuation
SUGGESTED TRADE:
Swing Trade
Long EURUSD
Entry Point - 1.1125
Stop Loss - 1.1037
Take Profit - 1.1307
Our Risk - 1%
Start protection of your profits from lower levels
Disclosure: I am part of Trade Nation's Influencer program and receive a monthly fee for using their TradingView charts in my analysis.
❤️ Please, support our work with like & comment! ❤️

EURNZD: Bullish Continuation is Highly Probable! Here is Why:
It is essential that we apply multitimeframe technical analysis and there is no better example of why that is the case than the current EURNZD chart which, if analyzed properly, clearly points in the upward direction.
Disclosure: I am part of Trade Nation's Influencer program and receive a monthly fee for using their TradingView charts in my analysis.
❤️ Please, support our work with like & comment! ❤️

AUDUSD The Target Is UP! BUY!
My dear followers,
I analysed this chart on AUDUSD and concluded the following:
The market is trading on 0.6385 pivot level.
Bias - Bullish
Technical Indicators: Both Super Trend & Pivot HL indicate a highly probable Bullish continuation.
Target - 0.6401
About Used Indicators:
A super-trend indicator is plotted on either above or below the closing price to signal a buy or sell. The indicator changes color, based on whether or not you should be buying. If the super-trend indicator moves below the closing price, the indicator turns green, and it signals an entry point or points to buy.
Disclosure: I am part of Trade Nation's Influencer program and receive a monthly fee for using their TradingView charts in my analysis.
———————————
WISH YOU ALL LUCK

GOLD BULLS ARE GAINING STRENGTH|LONG
GOLD SIGNAL
Trade Direction: long
Entry Level: 3,211.87
Target Level: 3,375.85
Stop Loss: 3,102.01
RISK PROFILE
Risk level: medium
Suggested risk: 1%
Timeframe: 12h
Disclosure: I am part of Trade Nation's Influencer program and receive a monthly fee for using their TradingView charts in my analysis.
✅LIKE AND COMMENT MY IDEAS✅

12/05/25 Weekly OutlookLast weeks high: $104,972.46
Last weeks low: $93,385.49
Midpoint: $99,178.97
Bitcoin climbs over 12% from weekly low to weekly high, an incredible achievement despite a mixed performance in Tradfi. A pattern we've seen since the $74,500 double bottom following Liberation day goes; A strong rally for a week, consolidation in a tight trading range for a week, then repeat. Should this pattern continue we should see consolidation between weekly high and $102,075 (0.75 line).
CPI & PPI take place this week on Tuesday and Thursday respectively, inflation is still a big talking point but baring a crazy print I would be surprised if these events move BTC. In the last few hours at time of writing The US has reduced tariffs on China to 30% for 90 days, China has reduced tariffs on the US down to 10%. To me this signifies the worst of the trade war narrative is behind us.
This week I will be tracking altcoins with strong fundamentals as BTC.D rolls over from its highest point since January '21, ETH has already had a strong breakout from the downtrend and with BTC at ATH levels with strong resistance this should be the time to see altcoin strength and play catch-up.
Good luck this week!

OptionsMastery: A potential trend change on NVDA? 🔉Sound on!🔉
📣Make sure to watch fullscreen!📣
Thank you as always for watching my videos. I hope that you learned something very educational! Please feel free to like, share, and comment on this post. Remember only risk what you are willing to lose. Trading is very risky but it can change your life!

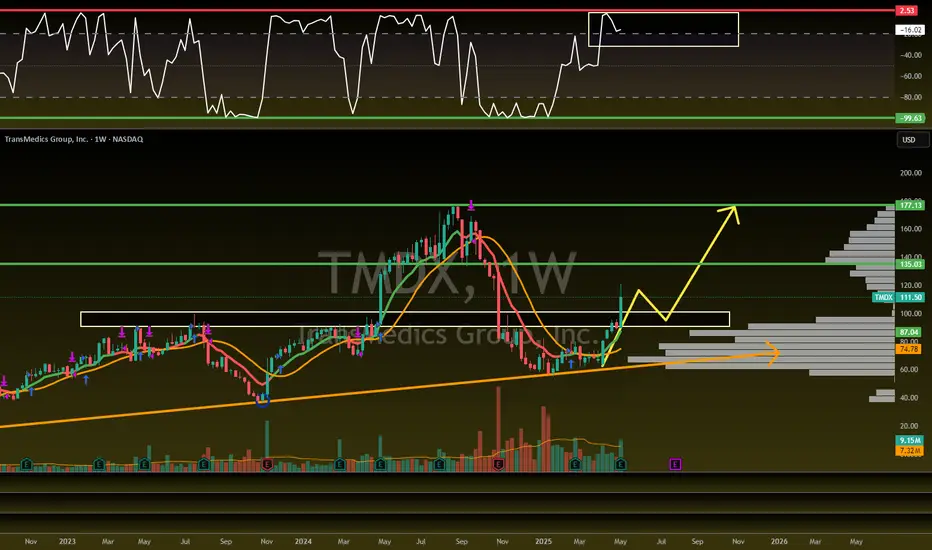
$TMDX Trade Setup: 80%+ Upside!NASDAQ:TMDX Trade Setup
Looking for a retest of the $90-100 breakout area to flip previous resistance into support.
Followed by a move to these targets...
🎯$135🎯$177
- Volume shelf launch with GAP
- Bullish WCB forming
- Green H5 Indicator
- Great earnings recently
Not financial advice
HelenP. I Euro may break resistance level and rise to trend lineHi folks today I'm prepared for you Euro analytics. If we look at the chart, we can see how the price a long period of slow decline, finally showing early signs of potential reversal. The price has been moving inside a falling wedge pattern, consistently testing lower highs and lower lows. But now, after touching the lower boundary of the structure and reacting near the 1.1200 zone, buyers have stepped in with notable strength. This level aligns not only with the wedge’s base but also with a previous support zone, which adds weight to the current move. The first reaction was sharp, the price rebounded confidently, and started forming higher local lows. That suggests the bearish momentum is weakening, while the structure itself points toward a possible breakout. If the Euro continues to build this upward momentum, it could break through the 1.1285 - 1.1300 resistance zone, which has already acted as a ceiling multiple times. That zone now becomes the key pivot for the next phase of the movement. Given the wedge structure, price behavior near support, and the current momentum, I expect EURUSD may reach the trend line, breaking the resistance level, and continue to grow to the trend line. That's why I set my goal at 1.1320 points, which coincides with the trend line. If you like my analytics you may support me with your like/comment ❤️
