doge buy long term "🌟 Welcome to Golden Candle! 🌟
We're a team of 📈 passionate traders 📉 who love sharing our 🔍 technical analysis insights 🔎 with the TradingView community. 🌎
Our goal is to provide 💡 valuable perspectives 💡 on market trends and patterns, but 🚫 please note that our analyses are not intended as buy or sell recommendations. 🚫
Instead, they reflect our own 💭 personal attitudes and thoughts. 💭
Follow along and 📚 learn 📚 from our analyses! 📊💡"
Long!!!!

USD/CAD BULLS WILL DOMINATE THE MARKET|LONG
Hello, Friends!
Bullish trend on USD/CAD, defined by the green colour of the last week candle combined with the fact the pair is oversold based on the BB lower band proximity, makes me expect a bullish rebound from the support line below and a retest of the local target above at 1.367.
Disclosure: I am part of Trade Nation's Influencer program and receive a monthly fee for using their TradingView charts in my analysis.
✅LIKE AND COMMENT MY IDEAS✅

DXY Will Grow! Long!
Here is our detailed technical review for DXY.
Time Frame: 2h
Current Trend: Bullish
Sentiment: Oversold (based on 7-period RSI)
Forecast: Bullish
The market is trading around a solid horizontal structure 98.198.
The above observations make me that the market will inevitably achieve 98.620 level.
P.S
Please, note that an oversold/overbought condition can last for a long time, and therefore being oversold/overbought doesn't mean a price rally will come soon, or at all.
Disclosure: I am part of Trade Nation's Influencer program and receive a monthly fee for using their TradingView charts in my analysis.
Like and subscribe and comment my ideas if you enjoy them!

USDJPY Will Go Up From Support! Long!
Please, check our technical outlook for USDJPY.
Time Frame: 1h
Current Trend: Bullish
Sentiment: Oversold (based on 7-period RSI)
Forecast: Bullish
The market is approaching a key horizontal level 143.827.
Considering the today's price action, probabilities will be high to see a movement to 144.499.
P.S
We determine oversold/overbought condition with RSI indicator.
When it drops below 30 - the market is considered to be oversold.
When it bounces above 70 - the market is considered to be overbought.
Disclosure: I am part of Trade Nation's Influencer program and receive a monthly fee for using their TradingView charts in my analysis.
Like and subscribe and comment my ideas if you enjoy them!

GBPJPY Will Go Higher! Buy!
Here is our detailed technical review for GBPJPY.
Time Frame: 1D
Current Trend: Bullish
Sentiment: Oversold (based on 7-period RSI)
Forecast: Bullish
The market is approaching a significant support area 194.845.
The underlined horizontal cluster clearly indicates a highly probable bullish movement with target 199.003 level.
P.S
Overbought describes a period of time where there has been a significant and consistent upward move in price over a period of time without much pullback.
Disclosure: I am part of Trade Nation's Influencer program and receive a monthly fee for using their TradingView charts in my analysis.
Like and subscribe and comment my ideas if you enjoy them!

OSUR - Bull SSS Flag - Long setupOSUR - Long setup. Here we have another Bull SSS Flag. Money flow is positive. The President & CEO bought some shares in February.

Crude Oil Going Higher - TA and fundamentals aligneThe 0-5 count is not over yet.
Sudo 4 and 5 are still lurking.
It's good to see how the Medianline-Set cought the Highs of the swings. Likewise we can see the subborn rejection at the Center-Line at P3.
I will not trade CL to the short side, until it's clear that P4 is engraved in this Chart. Until then, I maybe shoot for some intraday or dayli trades in Crude.
Economy Facts that support a rise, up to P4:
Crude oil refineries typically switch to producing more gasoline (fuel for cars) in the spring, particularly around March to April in the United States and other northern hemisphere countries.
Seasonal demand: Warmer months mean more driving and vacation travel, increasing gasoline demand.
Regulatory change: Refineries begin producing summer-grade gasoline, which has lower volatility and is required by environmental regulations (especially in the U.S. under EPA rules).
The switch to summer-grade gasoline must be completed by June 1st for retail and May 1st for terminals and pipelines in the U.S.
In Summary:
- Switch begins: March–April
- Completed by: May (terminals), June (retail)
- This seasonal shift is often called the "refinery maintenance season" or "spring blend switch."

Bitcoin - Breakout incoming towards $115k?Introduction
Bitcoin (BTC) has been consolidating just below a key resistance level over the past several days. This period of sideways movement, without any significant pullbacks, reflects notable strength in the market. Such price behavior often precedes a strong directional move, and in this case, the technical setup continues to favor the possibility of a bullish breakout.
1H BullFlag Pattern
On the 1-hour timeframe, BTC is forming a well-defined bull flag pattern, which is typically a bullish continuation signal. This flag began to develop after BTC surged from approximately $105,000 to $110,000, creating the flagpole that represents the initial wave of upward momentum.
Since that move, price has entered a consolidation phase, forming the flag portion of the pattern with declining volume and tighter price action. If BTC breaks out above the upper boundary of this flag, the measured move target projects a rally toward the $115,000 level. Reaching this target would represent a new all-time high for Bitcoin, signaling a continuation of the broader uptrend.
4H Fair Value Gap (FVG), Downside Scenario
Although the overall structure favors a bullish outcome, it is important to acknowledge the potential for a short-term retracement. On the 4-hour chart, there is a Fair Value Gap (FVG) between $105,700 and $106,800. If BTC fails to break out immediately, this zone becomes a logical area to monitor.
Price may revisit this imbalance to fill the gap left behind by the recent upward move. A dip into this area could present a strong opportunity for long entries, particularly if buyers step in with conviction. Filling this FVG would allow for a more balanced structure before BTC attempts a sustained move higher.
Conclusion
BTC continues to show impressive resilience as it consolidates near its prior highs. The presence of a bull flag on the lower timeframes, coupled with minimal downside volatility, suggests that a breakout above resistance is becoming increasingly likely.
However, reclaiming the previous all-time high remains a critical step before targeting the projected $115,000 level. How BTC reacts to that key resistance area will provide important insight into the strength of this rally.
At this stage, the bullish case remains the higher probability scenario, while any short-term pullback into the FVG zone could offer a healthy reset and a potential long setup for continuation toward new highs.
Thanks for your support.
- Make sure to follow me so you don't miss out on the next analysis!
- Drop a like and leave a comment!

! Audnzd Sell !audnzd is currently in a bearish trend on the Daily tf. its also trading inside of a Daily Supply zone. at the moment price is rejecting off a 30 and 15 poi levels. giving they are also in the Daily supply zone we have confluence added strength the Daily bearish bias. there are 4hr key levels underneath. im waiting to under for a close under the area where theres a 4hr and 15m key level close to each other.

Dow Jones Potential UpsidesHey Traders, in today's trading session we are monitoring US30 for a buying opportunity around 42,100 zone, US30 is trading in an uptrend and currently is in a correction phase in which it is approaching the trend at 42,100 support and resistance area.
Trade safe, Joe.

What's going on with $OSCR? Let's break it down!🚨 What's going on with NYSE:OSCR ? Let's break it down! 👇
📌 Long-term investors: Every dip = buy/add opportunity
📌 Traders: Short term, we may fill the $13.31 GAP
🔹 Massive volume shelf & consolidation between $11-$17 for nearly 2 years—the bigger the base, the bigger the breakout!
🔹 Rising trendline since April lows—if this breaks, expect a move to $13.31 GAP, possibly $11-$12. Strong support here unless bad news or a market correction hits.
🔹 Break above $18.27 (earnings pop) = 🚀 $20+ short term
🔹 200DMA rejection after retest from below = bearish short term
🔹 WR% is making a lower low instead of swinging higher—watching this closely.
🧐 Overall: We’re in a consolidation phase—when it moves, expect it to be quick & explosive 🔥 Best strategy: DCA & wait for the inevitable surge to $20+ (barring major setbacks).
Stay patient. Stay focused. NYSE:OSCR ’s move is coming! 💪

Eurusd Buyprice is bullish on the Daily and 4hr tf. on the 1hr it is exiting the Daily demand zone and recently bounced off the 1hr trendline. price is currently around 4hr poi which may help give us fuel to move to the 1hr poi and above targeting next Daily key level.

Usdcad Sellim still believe the market can push down more it is reacting to the Daily zone and is respecting the 1hr supply line(green dots). ive extended the sl since my analysis is based on htf price action and trend

Ethereum Looks Identical to Early-Day AmazonToday I look at Ethereum versus early-day Amazon and the similarities between the internet bubble and the 2021 crypto bubble. Everyone talks about how the internet bubble popped, but few people talk about what came afterward. There was a strong recovery in the markets, and the internet was mass adopted by the public—along with the technology of home computers.
I believe we are heading into a mass adoption phase for crypto. We've had a bubble-and-pop scenario, and now that major institutions are investing in crypto, we are set up for mass adoption—very similar to what happened with home computing and the internet as a technology. I see Ethereum as being the "Amazon" of this new wave, and Bitcoin as being the "Apple." Big things are coming in these markets.
As always, stay profitable.
– Dalin Anderson

NZDJPY Potential UpsidesHey Traders, in today's trading session we are monitoring NZDJPY for a buying opportunity around 87.350 zone, NZDJPY is trading in an uptrend and currently is in a correction phase in which it is approaching the trend at 87.350 support and resistance area.
Trade safe, Joe.

HelenP. I Gold may bounce from trend line to resistance levelHi folks today I'm prepared for you Gold analytics. After observing this chart, I see that the price tried to grow to the resistance level first, but failed and dropped to the support level, which coincided with the buyer support zone. After this correction movement, XAU rebounded up and then dropped below the support level, breaking it. But soon, price turned around and made impulse up, breaking the 3265 level, after which it continued to move up to the resistance level. When Gold reached this level, it entered to resistance zone, where it turned around at once and made a strong movement down to the trend line, breaking two levels. Also then it started to trades inside a triangle, and soon turned around from the trend line and made a strong impulse up. Price broke the 3265 support level one more time, rose a little more, and then made a correction. After this, price continued to move up and soon reached the 3395 resistance level, after which it turned around and fell to the trend line, which is the support line of the triangle as well. Recently, it started to grow, so I expect that XAUUS will correct to the trend line and then continue to move up to the resistance level. That's why the 3395 resistance level is my current goal. If you like my analytics you may support me with your like/comment ❤️
Disclaimer: As part of ThinkMarkets’ Influencer Program, I am sponsored to share and publish their charts in my analysis.

Bitcoin will rise from support level and exit from wedgeHello traders, I want share with you my opinion about Bitcoin. This chart shows how the price rebounded from the current support level and then turned around and rebounded up. Price broke the 109000 level, coinciding with a support area, and then traded near this level for some time. Later price turned around and started to decline inside a downward channel, where it soon broke the 109000 level, reached the resistance line, and continued to fall next. Bitcoin fell to the support line of the channel, which coincided with the 103000 support level and buyer zone, after which it rebounded up. Then BTC exited from channel and later entered to upward wedge, where it at once made a correction movement from the resistance line to the support line, breaking the 103000 level. But soon, price made an impulse up, breaking the support level one more time. Next, it rose to the current support level, broke it too, and now trades inside the support area. In my mind, BTC can rebound from the support level and rise to the resistance line of the wedge. Then it can break this line, thereby exiting from the wedge and continuing to move up; therefore, I set my TP at 112000 points. Please share this idea with your friends and click Boost 🚀

TESLA Technical Analysis! BUY!
My dear subscribers,
My technical analysis for TESLA is below:
The price is coiling around a solid key level - 295.19
Bias - Bullish
Technical Indicators: Pivot Points Low anticipates a potential price reversal.
Super trend shows a clear buy, giving a perfect indicators' convergence.
Goal - 323.17
About Used Indicators:
By the very nature of the supertrend indicator, it offers firm support and resistance levels for traders to enter and exit trades. Additionally, it also provides signals for setting stop losses
Disclosure: I am part of Trade Nation's Influencer program and receive a monthly fee for using their TradingView charts in my analysis.
———————————
WISH YOU ALL LUCK

GBPAUD: Bullish Continuation & Long Trade
GBPAUD
- Classic bullish setup
- Our team expects bullish continuation
SUGGESTED TRADE:
Swing Trade
Long GBPAUD
Entry Point - 2.0740
Stop Loss - 2.0699
Take Profit - 2.0833
Our Risk - 1%
Start protection of your profits from lower levels
Disclosure: I am part of Trade Nation's Influencer program and receive a monthly fee for using their TradingView charts in my analysis.
❤️ Please, support our work with like & comment! ❤️

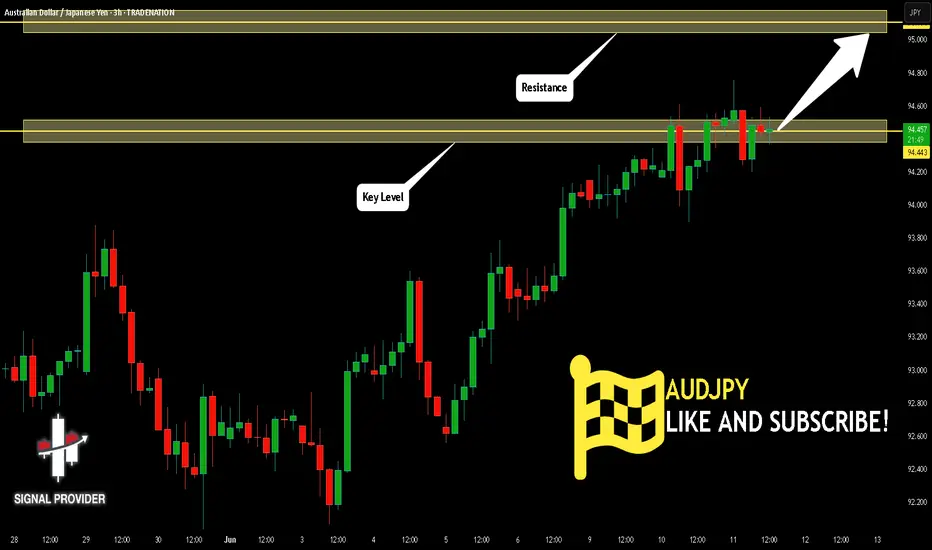
AUDJPY Is Bullish! Long!
Here is our detailed technical review for AUDJPY.
Time Frame: 3h
Current Trend: Bullish
Sentiment: Oversold (based on 7-period RSI)
Forecast: Bullish
The market is trading around a solid horizontal structure 94.443.
The above observations make me that the market will inevitably achieve 95.104 level.
P.S
We determine oversold/overbought condition with RSI indicator.
When it drops below 30 - the market is considered to be oversold.
When it bounces above 70 - the market is considered to be overbought.
Disclosure: I am part of Trade Nation's Influencer program and receive a monthly fee for using their TradingView charts in my analysis.
Like and subscribe and comment my ideas if you enjoy them!
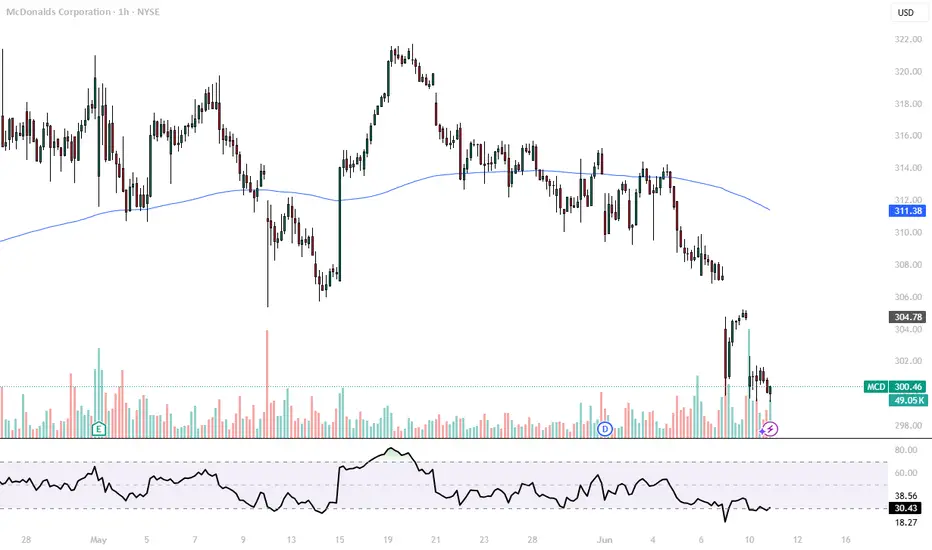
McDonald 1H Long PositionMy self-built strategy has sent me a signal for a long position. I bought a tranche of NYSE:MCD long and will be targeting the upper gaps as my profit targets. The first station will be around $306, and the second target lies between $318 and $319. Currently, the 1H chart is forming a nice divergence and had a huge volume spike, and my strategy indicates a high probability setup for this chart.
Given the current market volatility, I’ll be keeping a close eye on my open position to be able to react quickly if needed.
ETH - Finally Support!Hello TradingView Family / Fellow Traders. This is Richard, also known as theSignalyst.
📈ETH has been overall bullish trading within the flat rising channels marked in blue.
Moreover, the green zone is a strong support zone!
🏹 Thus, the highlighted blue circle is a strong area to look for buy setups as it is the intersection of support and lower blue trendlines acting as non-horizontal support.
📚 As per my trading style:
As #ETH approaches the blue circle zone, I will be looking for bullish reversal setups (like a double bottom pattern, trendline break , and so on...)
📚 Always follow your trading plan regarding entry, risk management, and trade management.
Good luck!
All Strategies Are Good; If Managed Properly!
~Rich

Get ready for the Breakout on GOLD!"you know how looong i been waiting for dis?!" *Gambit Voice*
Been waiting for this set up to happen and its slowly showing that its ready to break out and go for new Highs. just trying to be patient and ready for it.
