Gold will make impulse up from support line of triangle to 3430Hello traders, I want share with you my opinion about Gold. Some days ago, price entered to triangle, where it made an upward impulse at once to the resistance line, breaking the resistance level. But then price turned around and in a short time declined back, breaking the resistance level one more time. Next, Gold continued to fall and reached the support line of the triangle. After this, it made an impulse up again and exited from the triangle pattern with broke the 3280 level. Price rose to the resistance level and then started to trade inside another triangle pattern. In this pattern, Gold dropped from the 3430 resistance level, which coincided with the resistance line, and dropped to the support line, breaking the 3280 level. After this movement, Gold turned around and started to grow, and later reached the 3280 level and broke it again. Then the price continued to grow and reached the resistance line of the triangle pattern, where at the moment continues to trades near. In my opinion, Gold can rebound from the support line of the triangle and rise to the resistance level, exiting from triangle pattern. For this case, my TP is 3430 level. Please share this idea with your friends and click Boost 🚀
Disclaimer: As part of ThinkMarkets’ Influencer Program, I am sponsored to share and publish their charts in my analysis.
Long!!!!

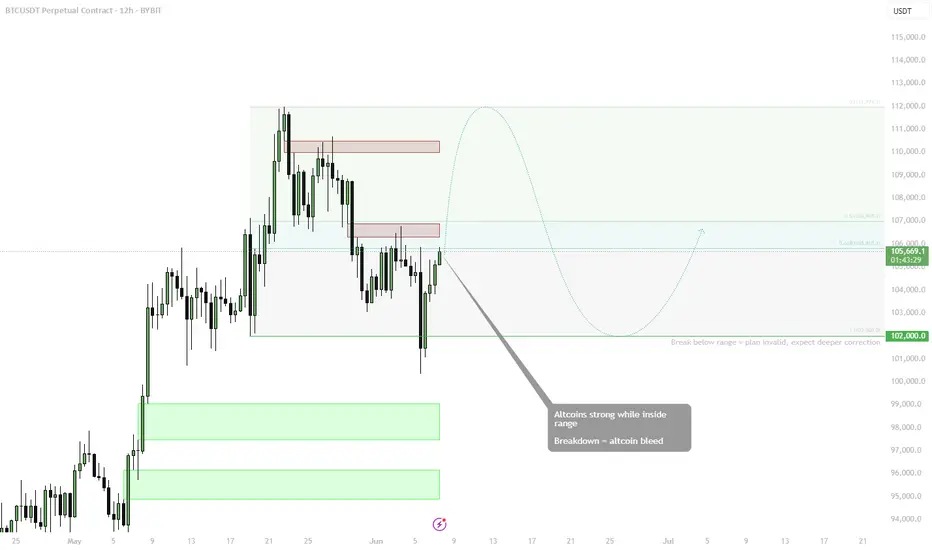
BTC — Altcoin Sentiment Hinges on BTC Holding BINANCE:BTCUSDT is consolidating within a well-defined range between ~$102K and ~$112K, with a bounce off the lower boundary now challenging midrange resistance. As long as BTC trades within the range, altcoins are expected to remain strong.
🟩 Midrange: $106K
• 0.618 fib and prior supply zone
• Key inflection for either a move higher or return to range low
🔻 Range Low Support: $102K
• Break below this = plan invalid
• Expect deeper BTC correction and altcoin bleed in that scenario
📈 Bias:
• Altcoins strong = only valid if BTC holds this structure
• Rotations likely while BTC moves sideways or grinds higher
• Upside target (range high): ~$111.9K
📌 BTC stability = altcoin opportunity. Breakdown from range? Get defensive fast.
$FSLR is in motion to $225NASDAQ:FSLR is in motion to $225🚂
- Breakout of downtrend
- Volume shelf launch
- Bullish H5_L indicator
- Bounced off support zone
- WR% is swinging to Red barrier

HelenP. I Bitcoin may grow to resistance zone from trend lineHi folks today I'm prepared for you Bitcoin analytics. This chart shows how the price declined to the trend line and then made an impulse up to the support level, which coincided with the support zone. Also, price started to trades inside a pennant, where it soon broke the support level and then traded some time near it. Later, it continued to grow and in a short time rose to the resistance level, which coincided with the resistance zone and broke this level as well. Then BTC reached the resistance line of the pennant, turned around, and dropped below the 108000 level, after which a few moments traded between this level. After this, price continued to fall and after it broke 108000 leve one more time, it dropped to the trend line, which is a support line of the pennant too. Price has traded near this line and recently BTC rebounded up. So, I expect that BTCUSDT will correct to the trend line and then rise to the resistance level. After this, I think the price may break it and enter to resistance zone. That's why I set my goal at 108800 points. If you like my analytics you may support me with your like/comment ❤️

Euro will correct a little and then continue to move up nextHello traders, I want share with you my opinion about Euro. Observing this chart, we can see how the price entered to upward channel, where it at once dropped from the resistance line to the support line and then started to grow. In a short time price rose to the 1.1210 level, broke it, and even rose a little more, but soon turned around and declined to the support line of the channel. Then the Euro made an upward impulse, and then broke the 1.1210 level one more time and continued to grow inside the channel. Later price reached the resistance line of the channel and then corrected, after which, in a short time rose to the support area, breaking the 1.1400 level. But soon the price turned around and dropped to the 1.1210 level, thereby exiting from channel. Next, Euro continued to grow inside the wedge, where it rose to the current support level and soon broke it. After this, the price rose to the resistance line of the wedge and then corrected, after which it made an upward impulse. Price exited from the wedge, and now I think that the Euro can make a correction, after the rise, and then continue to grow next. That's why I set my TP at 1.1560 points. Please share this idea with your friends and click Boost 🚀
Disclaimer: As part of ThinkMarkets’ Influencer Program, I am sponsored to share and publish their charts in my analysis.

TESLA: Long Signal with Entry/SL/TP
TESLA
- Classic bullish formation
- Our team expects pullback
SUGGESTED TRADE:
Swing Trade
Long TESLA
Entry - 295.19
Sl - 276.74
Tp -325.39
Our Risk - 1%
Start protection of your profits from lower levels
Disclosure: I am part of Trade Nation's Influencer program and receive a monthly fee for using their TradingView charts in my analysis.
❤️ Please, support our work with like & comment! ❤️

EURUSD: Bullish Continuation is Expected! Here is Why:
Our strategy, polished by years of trial and error has helped us identify what seems to be a great trading opportunity and we are here to share it with you as the time is ripe for us to buy EURUSD.
Disclosure: I am part of Trade Nation's Influencer program and receive a monthly fee for using their TradingView charts in my analysis.
❤️ Please, support our work with like & comment! ❤️

USDCAD Will Explode! BUY!
My dear followers,
This is my opinion on the USDCAD next move:
The asset is approaching an important pivot point 1.3654
Bias - Bullish
Safe Stop Loss - 1.3603
Technical Indicators: Supper Trend generates a clear long signal while Pivot Point HL is currently determining the overall Bullish trend of the market.
Goal - 1.3751
About Used Indicators:
For more efficient signals, super-trend is used in combination with other indicators like Pivot Points.
Disclosure: I am part of Trade Nation's Influencer program and receive a monthly fee for using their TradingView charts in my analysis.
———————————
WISH YOU ALL LUCK

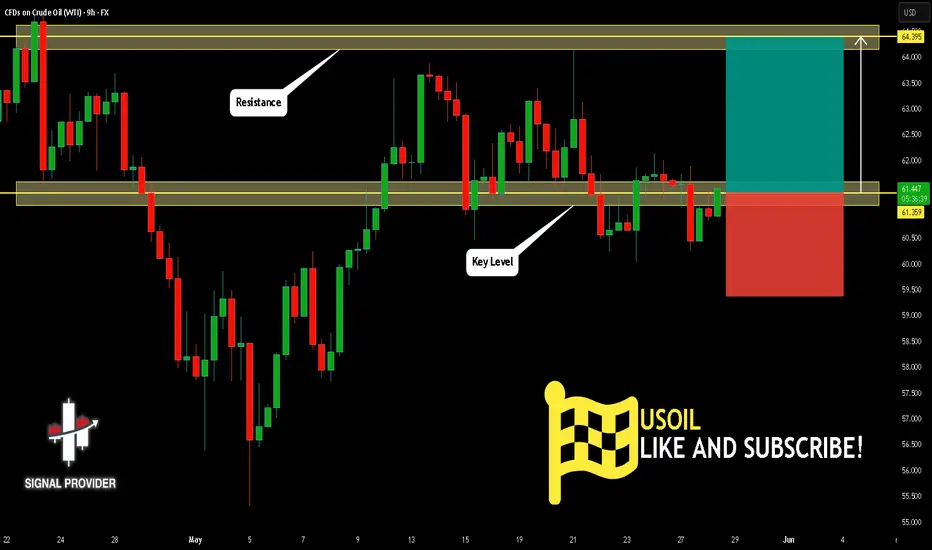
USOIL Will Go Up! Long!
Here is our detailed technical review for USOIL.
Time Frame: 9h
Current Trend: Bullish
Sentiment: Oversold (based on 7-period RSI)
Forecast: Bullish
The market is approaching a significant support area 61.359.
The underlined horizontal cluster clearly indicates a highly probable bullish movement with target 64.395 level.
P.S
We determine oversold/overbought condition with RSI indicator.
When it drops below 30 - the market is considered to be oversold.
When it bounces above 70 - the market is considered to be overbought.
Disclosure: I am part of Trade Nation's Influencer program and receive a monthly fee for using their TradingView charts in my analysis.
Like and subscribe and comment my ideas if you enjoy them!
AUDCHF Will Go Higher! Buy!
Here is our detailed technical review for AUDCHF.
Time Frame: 3h
Current Trend: Bullish
Sentiment: Oversold (based on 7-period RSI)
Forecast: Bullish
The market is approaching a significant support area 0.529.
The underlined horizontal cluster clearly indicates a highly probable bullish movement with target 0.532 level.
P.S
The term oversold refers to a condition where an asset has traded lower in price and has the potential for a price bounce.
Overbought refers to market scenarios where the instrument is traded considerably higher than its fair value. Overvaluation is caused by market sentiments when there is positive news.
Disclosure: I am part of Trade Nation's Influencer program and receive a monthly fee for using their TradingView charts in my analysis.
Like and subscribe and comment my ideas if you enjoy them!

USOIL Will Go Higher From Support! Buy!
Take a look at our analysis for USOIL.
Time Frame: 9h
Current Trend: Bullish
Sentiment: Oversold (based on 7-period RSI)
Forecast: Bullish
The market is testing a major horizontal structure 60.773.
Taking into consideration the structure & trend analysis, I believe that the market will reach 64.119 level soon.
P.S
Overbought describes a period of time where there has been a significant and consistent upward move in price over a period of time without much pullback.
Disclosure: I am part of Trade Nation's Influencer program and receive a monthly fee for using their TradingView charts in my analysis.
Like and subscribe and comment my ideas if you enjoy them!

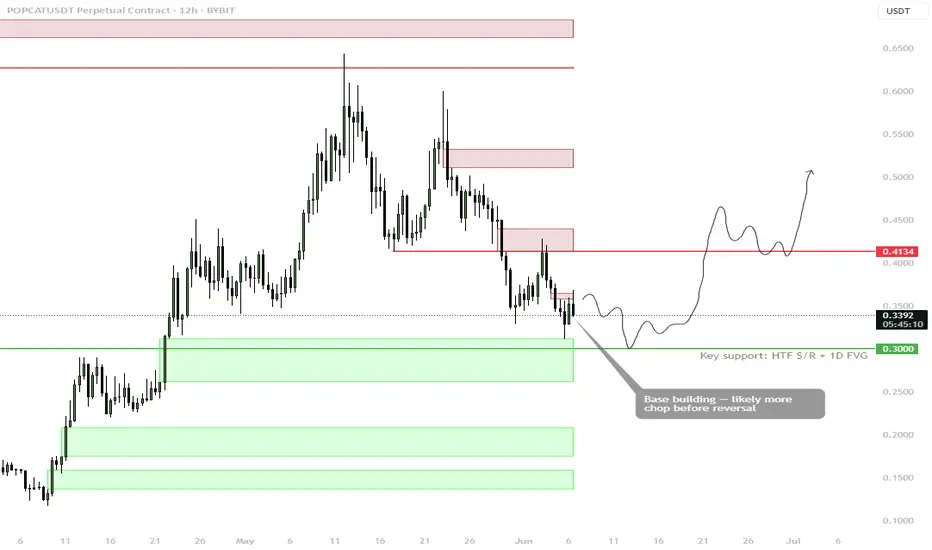
POPCAT — Base Building Near HTF SupportBYBIT:POPCATUSDT is showing early signs of a bottoming process near a key HTF S/R level + 1D FVG zone around $0.30. Price is consolidating just above support, suggesting a base is forming, but more chop is expected before a clean reversal.
🟩 Key Support: $0.30
• Confluence of 1D Fair Value Gap + prior S/R
• Ideal zone to monitor for a long trigger
• No aggressive entries yet — wait for structure
🔁 Likely Scenario:
• Sweep / wick into $0.30
• Higher low forms → reclaim of $0.41 confirms reversal
• First resistance: $0.45–$0.55
• Larger expansion possible on breakout above $0.60
🟥 Invalidation:
• Full breakdown below $0.30 = reevaluate, next support lower at $0.23–0.20
📌 Let the bottom form. The cleaner the base, the stronger the breakout.
NZDJPY Is Going Up! Long!
Here is our detailed technical review for NZDJPY.
Time Frame: 12h
Current Trend: Bullish
Sentiment: Oversold (based on 7-period RSI)
Forecast: Bullish
The market is trading around a solid horizontal structure 86.992.
The above observations make me that the market will inevitably achieve 88.309 level.
P.S
Please, note that an oversold/overbought condition can last for a long time, and therefore being oversold/overbought doesn't mean a price rally will come soon, or at all.
Disclosure: I am part of Trade Nation's Influencer program and receive a monthly fee for using their TradingView charts in my analysis.
Like and subscribe and comment my ideas if you enjoy them!

GBPUSD: Will Keep Growing! Here is Why:
The recent price action on the GBPUSD pair was keeping me on the fence, however, my bias is slowly but surely changing into the bullish one and I think we will see the price go up.
Disclosure: I am part of Trade Nation's Influencer program and receive a monthly fee for using their TradingView charts in my analysis.
❤️ Please, support our work with like & comment! ❤️

GOLD: Bullish Continuation & Long Signal
GOLD
- Classic bullish pattern
- Our team expects retracement
SUGGESTED TRADE:
Swing Trade
Buy GOLD
Entry - 3360.4
Stop - 3353.9
Take - 3375.0
Our Risk - 1%
Start protection of your profits from lower levels
Disclosure: I am part of Trade Nation's Influencer program and receive a monthly fee for using their TradingView charts in my analysis.
❤️ Please, support our work with like & comment! ❤️

EURUSD Set To Grow! BUY!
My dear friends,
My technical analysis for EURUSD is below:
The market is trading on 1.1420 pivot level.
Bias - Bullish
Technical Indicators: Both Super Trend & Pivot HL indicate a highly probable Bullish continuation.
Target - 1.1439
About Used Indicators:
A pivot point is a technical analysis indicator, or calculations, used to determine the overall trend of the market over different time frames.
Disclosure: I am part of Trade Nation's Influencer program and receive a monthly fee for using their TradingView charts in my analysis.
———————————
WISH YOU ALL LUCK

2X Levered TESLA TSLL: $7.23 level since 2023Since 2023, when TSLL 2X levered Tesla hit $7.23 it tend s to see significant upside. The chart show the peak profit levels from the $7.23 level. I am waiting for it to drop below and then buy when price rises above the level. The horizonal arrows at the top show how many days it takes to hit the peak in trade. The horizontal arrow on the bottom indicated the number of days it tool to fall from the peak to the next buying level.

GBPUSD Potential UpsidesHey Traders, in today's trading session we are monitoring GBPUSD for a buying opportunity around 1.35400 zone, GBPUSD is trading in an uptrend and currently is in a correction phase in which it is approaching the trend at 1.35400 support and resistance area.
Trade safe, Joe.

gbpnzd sellprice is in a 1hr supply at the moment and trend is bearish on 1hr 4hr tf. price is visiting the 1hr zone for the first time on 15m tf. it will form a double top if it closes fueling sell momentum. since its been in a steady uptrend it may look to retrace if it wants to go up. im looking to enter once price trade below the leg of the swing entering the 1hr zone.

Usdcad Sellprice is bearish still on the 4hr tf and is in a 4hr supply zone. there are supplies across the lower tfs within the 4hr zone. there is a particular one on the 15m tf that is strong. looking to sell once price trades below last ll.

DXY POTENTIAL LONG|
✅DXY will soon retest a key support level of 98.000
So I think that the index will make a rebound
And go up to retest the supply level above at 99.088
LONG🚀
✅Like and subscribe to never miss a new idea!✅
Disclosure: I am part of Trade Nation's Influencer program and receive a monthly fee for using their TradingView charts in my analysis.

Eurchf BuyEurchf is in a bullish trend on the 4hr tf and is currently trading around a 4 hr demand that was made some days ago. once price closes above the green line which is a supply on the 1hr its should suggest buyers are still interested. if so there is a 5m supply that i need price to break which is my entry point targeting 4hr supply above

SUI | — Key Buy Trigger AheadPrice is drifting lower and approaching a high-confluence retracement zone. A key bullish setup may form if price sweeps the 0.618–0.666 Fibonacci region and reclaims the level with strength.
📌 Buy Trigger:
• Sweep into the $2.38–2.5 zone
• Look for reclaim and bullish reversal for long entry
• Structure remains constructive while above monthly support ($1.91)
📈 Reclaim Level for Strength:
• $2.83 — clearing this confirms bullish intent
• Flip = strength toward $3.80 and beyond
🎯 Targets:
• $2.83 → Range reclaim level
• $3.50–3.60 → local resistance
• $5.36–5.37 → full upside liquidity target
🟥 Invalidation:
• Clean break below $1.90 (monthly support) = full invalidation
📌 Best setups form when liquidity is swept and price reclaims structure. Wait for the flush and follow strength.
