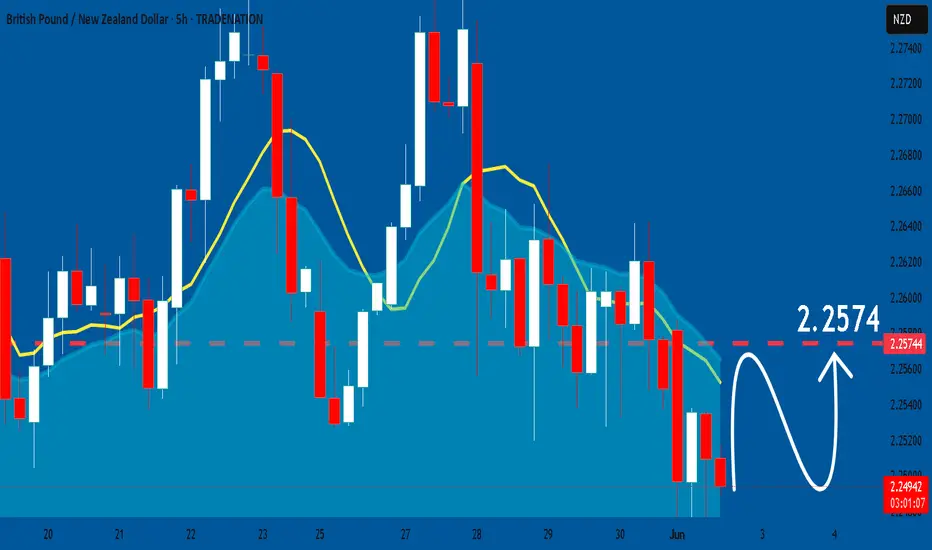
GBPNZD: Market of Buyers
The charts are full of distraction, disturbance and are a graveyard of fear and greed which shall not cloud our judgement on the current state of affairs in the GBPNZD pair price action which suggests a high likelihood of a coming move up.
Disclosure: I am part of Trade Nation's Influencer program and receive a monthly fee for using their TradingView charts in my analysis.
❤️ Please, support our work with like & comment! ❤️
Long!!
CADJPY My Opinion! BUY!
My dear friends,
Please, find my technical outlook for CADJPY below:
The price is coiling around a solid key level - 104.32
Bias - Bullish
Technical Indicators: Pivot Points High anticipates a potential price reversal.
Super trend shows a clear buy, giving a perfect indicators' convergence.
Goal - 104.57
About Used Indicators:
The pivot point itself is simply the average of the high, low and closing prices from the previous trading day.
Disclosure: I am part of Trade Nation's Influencer program and receive a monthly fee for using their TradingView charts in my analysis.
———————————
WISH YOU ALL LUCK

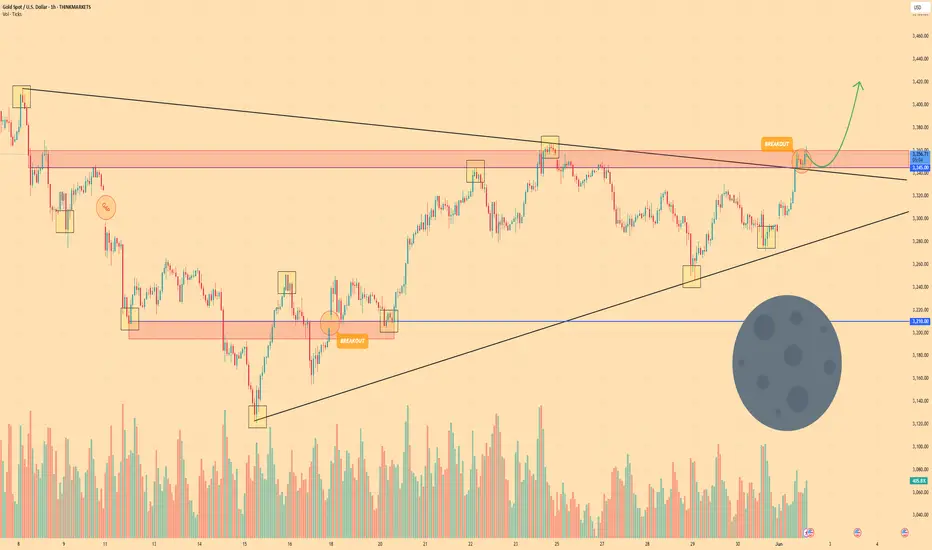
GOLD - Price can bounce up from support level to $3420Hi guys, this is my overview for XAUUSD, feel free to check it and write your feedback in comments👊
Recently, price entered to triangle, where it rebounded from resistance line and dropped to support line.
Also, price broke $3345 with $3210 levels, after which it turned around and rose to $3210 level, broke it.
Then Gold made retest, and then continued to grow to $3345 level, and even rose to resistance line of triangle.
And then started to decline to support line of triangle, after which it turned around and made an impulse up.
Price exited from triangle and broke $3345 level, which coincided with resistance area, and now trades inside.
I think that Gold can correct to support level and then continue to grow to $3420 points.
If this post is useful to you, you can support me with like/boost and advice in comments❤️
Disclaimer: As part of ThinkMarkets’ Influencer Program, I am sponsored to share and publish their charts in my analysis.
GBPJPY Is Very Bullish! Long!
Please, check our technical outlook for GBPJPY.
Time Frame: 7h
Current Trend: Bullish
Sentiment: Oversold (based on 7-period RSI)
Forecast: Bullish
The price is testing a key support 192.683.
Current market trend & oversold RSI makes me think that buyers will push the price. I will anticipate a bullish movement at least to 194.257 level.
P.S
We determine oversold/overbought condition with RSI indicator.
When it drops below 30 - the market is considered to be oversold.
When it bounces above 70 - the market is considered to be overbought.
Disclosure: I am part of Trade Nation's Influencer program and receive a monthly fee for using their TradingView charts in my analysis.
Like and subscribe and comment my ideas if you enjoy them!

02/06/25 Weekly OutlookLast weeks high: $110,718.68
Last weeks low: $103,065.74
Midpoint: $106,892.21
As we approach the middle of the year, Bitcoin is back above $100,000 despite pulling back from a new ATH of $112,000. In the month of MAY BlackRocks ETF had record inflows of over $6B propelling prices 11% higher.
Last week we saw as the month closed and with that it's natural to have a window dressing period that usually leads to de-risking slightly. BTC stayed within the previous weeks range and maintains the pattern of:
Chop/consolidation --> expansion to the upside --> chop/consolidation...
However in this case the consolidation week had a much larger range than in the past which is a sign to me that the rally is exhausted for now. It's because of this I feel we may see a weekly low break for the first time in a month and get a more meaningful pullback than we've seen since early April. My target would be around the $97,000 area.
The case for the bulls is still a convincing one despite some red flags. Record ETF inflows continue to pour, M2 money supply continues to grow and a general shift to risk-on assets is clear. However these are longer term factors and just for this weeks outlook the momentum is with the bears briefly.

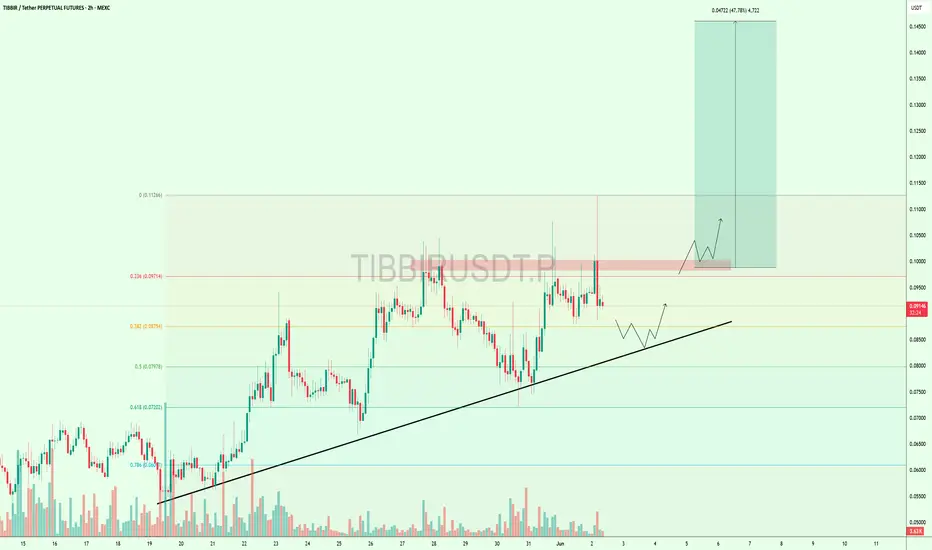
Price Cooling Off – But $TIBBIR Still Looks Bullish$TIBBIR is trying to break above the 0.097 resistance, but it hasn’t succeeded yet.
The price is now pulling back and might test the uptrend support line around 0.085–0.087. This area has helped the price bounce before.
If the support holds and price moves back up, we could see a strong move toward 0.1126 that’s nearly +47% higher.
Keep watching a breakout could come soon! 👀
GBP/CAD BEST PLACE TO BUY FROM|LONG
Hello, Friends!
We are now examining the GBP/CAD pair and we can see that the pair is going down locally while also being in a downtrend on the 1W TF. But there is also a powerful signal from the BB lower band being nearby indicating that the pair is oversold so we can go long from the support line below and a target at 1.866 level.
Disclosure: I am part of Trade Nation's Influencer program and receive a monthly fee for using their TradingView charts in my analysis.
✅LIKE AND COMMENT MY IDEAS✅

GOLD LONG FROM SUPPORT
GOLD SIGNAL
Trade Direction: long
Entry Level: 3,281.17
Target Level: 3,348.67
Stop Loss: 3,236.17
RISK PROFILE
Risk level: medium
Suggested risk: 1%
Timeframe: 7h
Disclosure: I am part of Trade Nation's Influencer program and receive a monthly fee for using their TradingView charts in my analysis.
✅LIKE AND COMMENT MY IDEAS✅

Bitcoin Daily Technical Overview (BTC/USD)Currently, Bitcoin (BTC/USD) is trading around $104,800. Up slightly but still digesting a sharp reversal that rattled short-term bulls.
Recent Price Action: Rejection From $112K
Back on 22nd May, Bitcoin surged to a new high near $112,000, fueled by bullish momentum, institutional flows, and strong on-chain accumulation. However, that breakout was swiftly rejected, and BTC fell as low as $103,400.
This kind of "bull trap" reversal highlights a few key dynamics:
1) Overextended sentiment: The rally above $110K was not supported by volume or follow-through, suggesting exhaustion.
2) Profit-taking by large holders or institutions likely triggered a cascade of stop-losses, accelerating the decline.
3) Liquidation clusters in leveraged long positions likely exacerbated the drop.
Bitcoin is now attempting to reclaim stability around the $104K–$105K range.
🔍 Technical Snapshot
- Support Zones at $103,000 and $93,200
- Resistance Levels at $112,000 (ATH)
Price is still above the 50 & 200-day SMAs, which could be a bullish longer-term signal.
In addition, the price remains above the upper band of the cloud, but momentum is stalling. A decisive bounce off the cloud could reignite bullish sentiment. Or falling into the cloud could trigger more uncertainty and downside.
Macro tailwinds: Concerns over U.S. fiscal stability and potential Fed rate cuts could keep Bitcoin attractive as a non-sovereign asset.
📈 Projection Scenarios
Bullish Case:
If BTC consolidates above $107K, we could see another attempt and retest of $112K.
Bearish Case:
Failure to hold above $103K could see Bitcoin revisit $100K, and if that breaks, downside opens toward the $93K level.
🧭 Insight & Takeaway
The current reversal serves as a healthy reminder that no trend goes up in a straight line. Especially not in crypto.
It likely shook out overleveraged longs, reset sentiment, and may give the market room to breathe before the next leg up.
The long-term trend remains intact, but expect more volatility before any clean break to new highs.
Always DYOR and DYODD and manage your risk.

AUDCHF: Great Trading Opportunity
AUDCHF
- Classic bullish pattern
- Our team expects retracement
SUGGESTED TRADE:
Swing Trade
Buy AUDCHF
Entry - 0.5296
Stop - 0.5277
Take - 0.5338
Our Risk - 1%
Start protection of your profits from lower levels
Disclosure: I am part of Trade Nation's Influencer program and receive a monthly fee for using their TradingView charts in my analysis.
❤️ Please, support our work with like & comment! ❤️

BTCUSD Sellers In Panic! BUY!
My dear followers,
This is my opinion on the BTCUSD next move:
The asset is approaching an important pivot point 10489
Bias - Bullish
Safe Stop Loss - 10362
Technical Indicators: Supper Trend generates a clear long signal while Pivot Point HL is currently determining the overall Bullish trend of the market.
Goal - 10701
About Used Indicators:
For more efficient signals, super-trend is used in combination with other indicators like Pivot Points.
Disclosure: I am part of Trade Nation's Influencer program and receive a monthly fee for using their TradingView charts in my analysis.
———————————
WISH YOU ALL LUCK

USOIL: Bullish Forecast & Bullish Scenario
The price of USOIL will most likely increase soon enough, due to the demand beginning to exceed supply which we can see by looking at the chart of the pair.
Disclosure: I am part of Trade Nation's Influencer program and receive a monthly fee for using their TradingView charts in my analysis.
❤️ Please, support our work with like & comment! ❤️

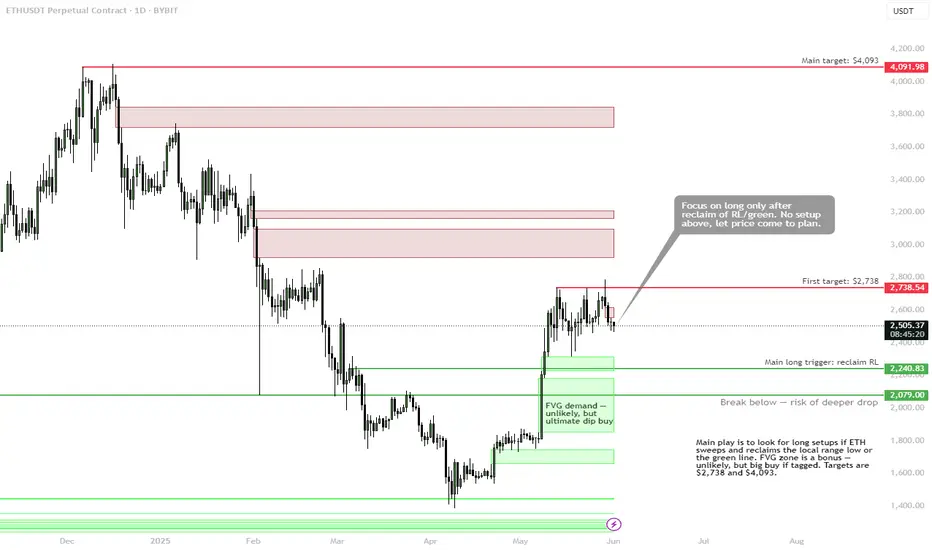
ETH (plan in progress) — Setup Only Valid on ReclaimCRYPTOCAP:ETH is consolidating beneath key resistance at $2,738, failing to show bullish continuation. The current zone offers no valid long setup until structure confirms. Eyes remain on range low sweeps and reclaim triggers.
Plan:
✅ Main Long Trigger: Reclaim of $2,240–2,250 range low
• Must see price sweep and reclaim local lows or green SR
• No setup above current levels — wait for plan to trigger
• First target: $2,738
• Main target: $4,093
🟩 FVG Demand Zone (Ultimate Dip Buy): $2,080–1,800
Unlikely to tag, but if reached — high conviction buy zone.
🚫 Break Below $2,079 → increased risk of deeper drop
• Exit bias if structure breaks down below green zone
Summary:
Let the price come to the plan — no need to chase. Focus is on range low reclaim or FVG tag as entry catalysts. Don’t long mid-range without confirmation.
📌 Discipline is an edge — great entries come to those who wait.
ETH | (reversal setup) — Waiting for Sweep & Reclaim to Trigger BINANCE:ETHUSDT is approaching a key liquidity pocket around $2,440, where multiple wicks have stacked. Price is likely to sweep this zone before any sustained move higher. The current plan favors waiting for the trap → then reacting.
Setup:
🟩 Trigger Zone: $2,440–2,400
• Expecting a sweep of $2,440
• Long setup only valid if price sweeps + reclaims on lower timeframe
• Break below $2,400 = invalidation, wait for new structure
🚫 No entry on first touch — avoid longs without a strong reclaim
🎯 Target Zone: $2,738+
First resistance comes from the H4 supply and the previous range high.
Plan:
• Monitor for liquidity grab and reclaim
• If structure holds — good R:R swing setup
• If not — stand aside, reassess at deeper levels
📌 Smart money needs liquidity. Let it sweep first — then strike.

USDJPY Will Grow! Long!
Here is our detailed technical review for USDJPY.
Time Frame: 8h
Current Trend: Bullish
Sentiment: Oversold (based on 7-period RSI)
Forecast: Bullish
The market is trading around a solid horizontal structure 144.062.
The above observations make me that the market will inevitably achieve 145.457 level.
P.S
We determine oversold/overbought condition with RSI indicator.
When it drops below 30 - the market is considered to be oversold.
When it bounces above 70 - the market is considered to be overbought.
Disclosure: I am part of Trade Nation's Influencer program and receive a monthly fee for using their TradingView charts in my analysis.
Like and subscribe and comment my ideas if you enjoy them!

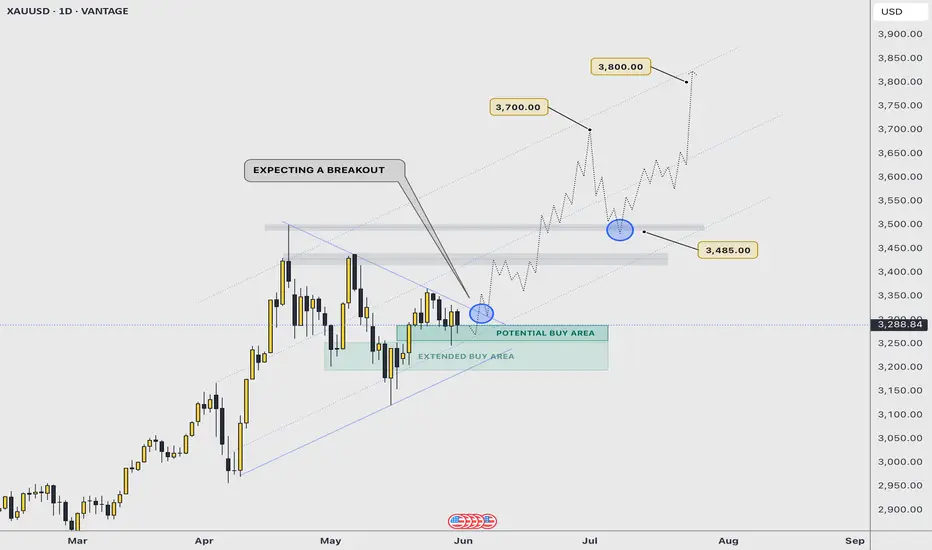
BREAKOUT SOON | $3700 - $3800 As illustrated, I’m visualising the next potential bullish continuation impulse that would take gold near the $4000 projected price.
In this idea, the path projected is based on the breakout of a rising symmetrical triangle that price formed; a strong bullish pattern that tends to be very effective when price successfully breaks out with strength.
On a fundamental aspect, things continue to hold the yellow metal on a positive route to maintain its bullish momentum and direction. Fed rates decision is getting close, and that is just the tip of the iceberg that’s going to move gold to record highs within weeks.
A key and major pivot area is near the $3200 - $3250 price range; so it’s possible we have one more attempt to break $3200.
—
GOOD LUCK
persaxu
EURUSD Possible AnalysisEURUSD has been overall bullish with retracemets here and there. It has recently made a deep retracement that could be mistaken for a shift in market structure, while in reality it's just liquidity accumulation. Price recently shifted structure back to bullish on 4h timeframe where it preceded to break more structure before retracing to sweep liquidity below a low and tap a fvg in the process. It preceded to shift structure on the 1h time frame, breaking with a huge bullish candle symbolizing increase in bullish momentum. It is currently retracing towards an orderblock that was responsible for the break and could possibly retest it and fill the imbalance above it before it continues its bullish move up to take out the latest weak high.

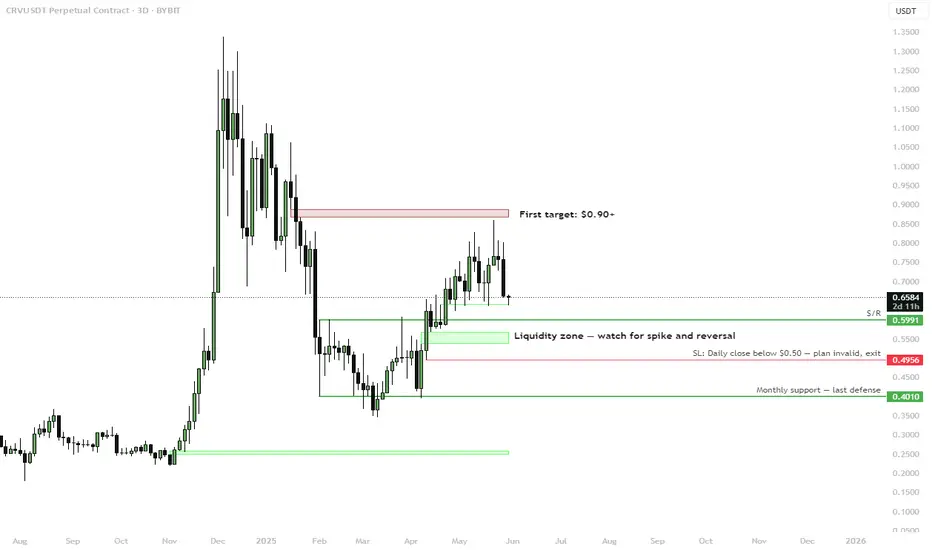
CRV (swing setup) — Watching Liquidity Zone ReactionBINANCE:CRVUSDT is pulling back into a key liquidity zone around $0.60–$0.55. This area acted as prior resistance and is now being retested as support. A spike into this zone with a bullish reaction could offer a strong swing entry.
Setup:
🟩 Liquidity Zone: $0.60–$0.55
Look for liquidity sweep and reversal signal within this zone. Key confluence with S/R flip and HTF demand.
🚫 Invalidation:
• Daily close below $0.50 = setup invalid
• Final defense at $0.4010 (monthly support)
🎯 First Target: $0.90+
Clear resistance above, likely to act as first take-profit zone if reversal plays out.
Plan:
• Monitor lower timeframes for entry trigger inside liquidity zone
• Favor patience and confirmation — this is a high-R setup if structure holds
📌 Classic SFP setup at support — risk defined, upside open.
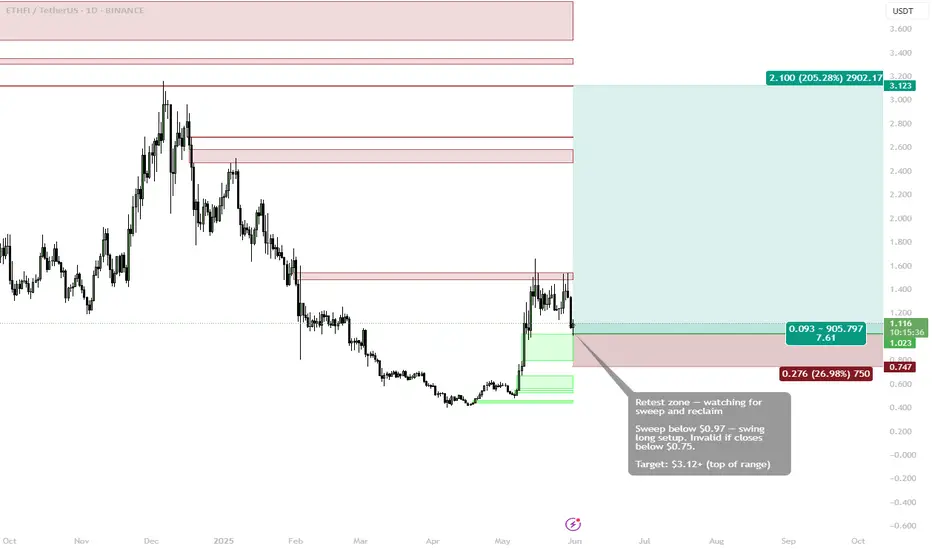
ETHFI (swing setup) — Retest in Progress Eyes on Sweep & ReclaimBINANCE:ETHFIUSDT is retesting a key breakout zone after a strong rally. Current structure suggests a possible swing long setup forming, contingent on a liquidity sweep below $0.97 and a clean reclaim.
Entry Criteria:
🟩 Retest Zone: $0.97–1.02
Looking for a sweep below $0.97 followed by a reclaim and bullish confirmation for entry.
❗ Invalidation: Close below $0.75 cancels the setup — indicates structural breakdown.
🎯 Target: $3.12+
Aiming for the top of the previous range — a 200%+ move if the reclaim holds.
📌 Big moves come from big levels — timing the reclaim is key.
BTCUSD: Bullish Continuation & Long Trade
BTCUSD
- Classic bullish setup
- Our team expects bullish continuation
SUGGESTED TRADE:
Swing Trade
Long BTCUSD
Entry Point - 10465
Stop Loss - 10321
Take Profit - 10794
Our Risk - 1%
Start protection of your profits from lower levels
Disclosure: I am part of Trade Nation's Influencer program and receive a monthly fee for using their TradingView charts in my analysis.
❤️ Please, support our work with like & comment! ❤️

USDCAD: Long Signal Explained
USDCAD
- Classic bullish formation
- Our team expects growth
SUGGESTED TRADE:
Swing Trade
Buy USDCAD
Entry Level - 1.3742
Sl - 1.3706
Tp - 1.3809
Our Risk - 1%
Start protection of your profits from lower levels
Disclosure: I am part of Trade Nation's Influencer program and receive a monthly fee for using their TradingView charts in my analysis.
❤️ Please, support our work with like & comment! ❤️

SILVER: Will Start Growing! Here is Why:
Our strategy, polished by years of trial and error has helped us identify what seems to be a great trading opportunity and we are here to share it with you as the time is ripe for us to buy SILVER.
Disclosure: I am part of Trade Nation's Influencer program and receive a monthly fee for using their TradingView charts in my analysis.
❤️ Please, support our work with like & comment! ❤️
