NZDJPY The Target Is UP! BUY!
My dear followers,
I analysed this chart on NZDJPY and concluded the following:
The market is trading on 82.050 pivot level.
Bias - Bullish
Technical Indicators: Both Super Trend & Pivot HL indicate a highly probable Bullish continuation.
Target - 83.982
Safe Stop Loss - 81.284
About Used Indicators:
A super-trend indicator is plotted on either above or below the closing price to signal a buy or sell. The indicator changes color, based on whether or not you should be buying. If the super-trend indicator moves below the closing price, the indicator turns green, and it signals an entry point or points to buy.
Disclosure: I am part of Trade Nation's Influencer program and receive a monthly fee for using their TradingView charts in my analysis.
———————————
WISH YOU ALL LUCK
Long!!
EURCHF Set To Grow! BUY!
My dear subscribers,
This is my opinion on the EURCHF next move:
The instrument tests an important psychological level 0.9353
Bias - Bullish
Technical Indicators: Supper Trend gives a precise Bullish signal, while Pivot Point HL predicts price changes and potential reversals in the market.
Target - 0.9434
My Stop Loss - 0.9307
About Used Indicators:
On the subsequent day, trading above the pivot point is thought to indicate ongoing bullish sentiment, while trading below the pivot point indicates bearish sentiment.
Disclosure: I am part of Trade Nation's Influencer program and receive a monthly fee for using their TradingView charts in my analysis.
———————————
WISH YOU ALL LUCK
LTO - Shift in Momentun in Action!Hello TradingView Family / Fellow Traders. This is Richard, also known as theSignalyst.
📚 LTO is a perfect practical example of a momentum shift in action.
It’s clear that the bears are losing steam — the impulse moves marked in red are becoming flatter and smaller, forming a wedge pattern.
Moreover, LTO just tapped into a key weekly support zone near the $0.03 round number, making it a prime area to look for potential long setups.📈
🚀For the bulls to confirm this momentum shift in their favor and aim for the $0.05 round number as the first target 🎯, a break above the last major high marked in green at $0.0345 is essential ✅.
📚 Always follow your trading plan regarding entry, risk management, and trade management.
Good luck!
All Strategies Are Good; If Managed Properly!
~Rich
USDCAD: Bulls Will Push Higher
Looking at the chart of USDCAD right now we are seeing some interesting price action on the lower timeframes. Thus a local move up seems to be quite likely.
Disclosure: I am part of Trade Nation's Influencer program and receive a monthly fee for using their TradingView charts in my analysis.
❤️ Please, support our work with like & comment! ❤️
CADCHF Will Explode! BUY!
My dear friends,
CADCHF looks like it will make a good move, and here are the details:
The market is trading on 0.6030 pivot level.
Bias - Bullish
Technical Indicators: Supper Trend generates a clear long signal while Pivot Point HL is currently determining the overall Bullish trend of the market.
Goal - 0.6097
About Used Indicators:
Pivot points are a great way to identify areas of support and resistance, but they work best when combined with other kinds of technical analysis
Disclosure: I am part of Trade Nation's Influencer program and receive a monthly fee for using their TradingView charts in my analysis.
———————————
WISH YOU ALL LUCK
GOLD BEST PLACE TO BUY FROM|LONG
GOLD SIGNAL
Trade Direction: long
Entry Level: 3,008.04
Target Level: 3,136.65
Stop Loss: 2,921.80
RISK PROFILE
Risk level: medium
Suggested risk: 1%
Timeframe: 12h
Disclosure: I am part of Trade Nation's Influencer program and receive a monthly fee for using their TradingView charts in my analysis.
✅LIKE AND COMMENT MY IDEAS✅
eth buy midterm "🌟 Welcome to Golden Candle! 🌟
We're a team of 📈 passionate traders 📉 who love sharing our 🔍 technical analysis insights 🔎 with the TradingView community. 🌎
Our goal is to provide 💡 valuable perspectives 💡 on market trends and patterns, but 🚫 please note that our analyses are not intended as buy or sell recommendations. 🚫
Instead, they reflect our own 💭 personal attitudes and thoughts. 💭
Follow along and 📚 learn 📚 from our analyses! 📊💡"
LONG ON NZD/USDNZD/USD has been oversold since last week.
It has finally given a change of character (choc) on the lower timeframe witching to bullish.
it is currently in the pullback/retracement phase of the new change.
With the dollar in a overall downtrend and getting ready to fall, this correlation should cause the NZD/USD pair to rise.
I have brought NZD/USD looking to make 200-300 pips this week.
NZDUSD: Long Trading Opportunity
NZDUSD
- Classic bullish pattern
- Our team expects retracement
SUGGESTED TRADE:
Swing Trade
Buy NZDUSD
Entry - 0.5560
Stop - 0.5509
Take - 0.5667
Our Risk - 1%
Start protection of your profits from lower levels
Disclosure: I am part of Trade Nation's Influencer program and receive a monthly fee for using their TradingView charts in my analysis.
❤️ Please, support our work with like & comment! ❤️
GBPCAD: Bullish Continuation is Expected! Here is Why:
Remember that we can not, and should not impose our will on the market but rather listen to its whims and make profit by following it. And thus shall be done today on the GBPCAD pair which is likely to be pushed up by the bulls so we will buy!
Disclosure: I am part of Trade Nation's Influencer program and receive a monthly fee for using their TradingView charts in my analysis.
❤️ Please, support our work with like & comment! ❤️
GOLD: Long Trade Explained
GOLD
- Classic bullish setup
- Our team expects bullish continuation
SUGGESTED TRADE:
Swing Trade
Long GOLD
Entry Point - 3006.4
Stop Loss - 2998.0
Take Profit - 3024.8
Our Risk - 1%
Start protection of your profits from lower levels
Disclosure: I am part of Trade Nation's Influencer program and receive a monthly fee for using their TradingView charts in my analysis.
❤️ Please, support our work with like & comment! ❤️
GBPUSD Sellers In Panic! BUY!
My dear friends,
Please, find my technical outlook for GBPUSD below:
The price is coiling around a solid key level - 1.2800
Bias - Bullish
Technical Indicators: Pivot Points Low anticipates a potential price reversal.
Super trend shows a clear buy, giving a perfect indicators' convergence.
Goal - 1.2936
About Used Indicators:
The pivot point itself is simply the average of the high, low and closing prices from the previous trading day.
Disclosure: I am part of Trade Nation's Influencer program and receive a monthly fee for using their TradingView charts in my analysis.
———————————
WISH YOU ALL LUCK
Bitcoin will grow inside upward channel to resistance levelHello traders, I want share with you my opinion about Bitcoin. Previously, the price moved inside a triangle pattern, where it faced pressure from the resistance line while holding above the lower boundary. After the breakout from this formation, BTC began forming an upward channel, signaling a shift toward a bullish structure. Inside the channel, the price reacted multiple times to the support line, especially within the buyer zone between 79600–81000 points. Every touch of this zone triggered a rebound, indicating that buyers consistently protect it. Most recently, BTC bounced again from the 81000 support level, which aligns with the lower channel boundary. This rebound shows that bullish momentum is still present, and the structure remains intact. Now, the price is stabilizing and preparing for another upward move. I expect BTC to continue rising toward the 88500 resistance level, which is both the TP1 and the upper boundary of the current channel. This level also aligns with the lower edge of the seller zone, making it a natural target for the next wave. With the price holding above key support, the confirmed channel structure, and repeated bullish reactions from the lower zone, I remain bullish and anticipate a continued move upward toward 88500 points. Please share this idea with your friends and click Boost 🚀
USDJPY Will Go Up From Support! Long!
Here is our detailed technical review for USDJPY.
Time Frame: 1D
Current Trend: Bullish
Sentiment: Oversold (based on 7-period RSI)
Forecast: Bullish
The market is trading around a solid horizontal structure 146.391.
The above observations make me that the market will inevitably achieve 150.489 level.
P.S
We determine oversold/overbought condition with RSI indicator.
When it drops below 30 - the market is considered to be oversold.
When it bounces above 70 - the market is considered to be overbought.
Disclosure: I am part of Trade Nation's Influencer program and receive a monthly fee for using their TradingView charts in my analysis.
Like and subscribe and comment my ideas if you enjoy them!
USDCAD Will Go Higher! Buy!
Take a look at our analysis for USDCAD.
Time Frame: 6h
Current Trend: Bullish
Sentiment: Oversold (based on 7-period RSI)
Forecast: Bullish
The market is testing a major horizontal structure 1.424.
Taking into consideration the structure & trend analysis, I believe that the market will reach 1.440 level soon.
P.S
Overbought describes a period of time where there has been a significant and consistent upward move in price over a period of time without much pullback.
Disclosure: I am part of Trade Nation's Influencer program and receive a monthly fee for using their TradingView charts in my analysis.
Like and subscribe and comment my ideas if you enjoy them!
CADJPY Will Go Up! Long!
Please, check our technical outlook for CADJPY.
Time Frame: 1D
Current Trend: Bullish
Sentiment: Oversold (based on 7-period RSI)
Forecast: Bullish
The market is approaching a key horizontal level 102.695.
Considering the today's price action, probabilities will be high to see a movement to 106.707.
P.S
Please, note that an oversold/overbought condition can last for a long time, and therefore being oversold/overbought doesn't mean a price rally will come soon, or at all.
Disclosure: I am part of Trade Nation's Influencer program and receive a monthly fee for using their TradingView charts in my analysis.
Like and subscribe and comment my ideas if you enjoy them!
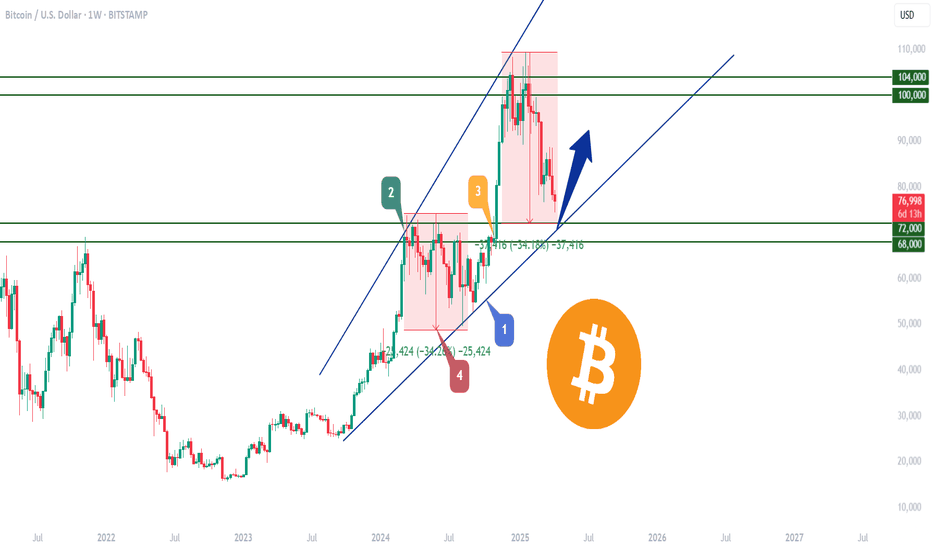
BTC is still bullish!!!🚨 CRYPTOCAP:BTC is dipping hard! 🚨
📍 All eyes on $72,000 — this could be the ultimate buy zone:
🔽 Why this level matters:
1️⃣ Bottom of the blue wedge
2️⃣ Flipped resistance → support
3️⃣ Major demand zone
4️⃣ Classic -34% pullback move
📊 This could be a textbook entry point.
Are you ready to catch the bounce?
SILVER SENDS CLEAR BULLISH SIGNALS|LONG
SILVER SIGNAL
Trade Direction: long
Entry Level: 3,050.2
Target Level: 3,274.5
Stop Loss: 2,899.9
RISK PROFILE
Risk level: medium
Suggested risk: 1%
Timeframe: 8h
Disclosure: I am part of Trade Nation's Influencer program and receive a monthly fee for using their TradingView charts in my analysis.
✅LIKE AND COMMENT MY IDEAS✅
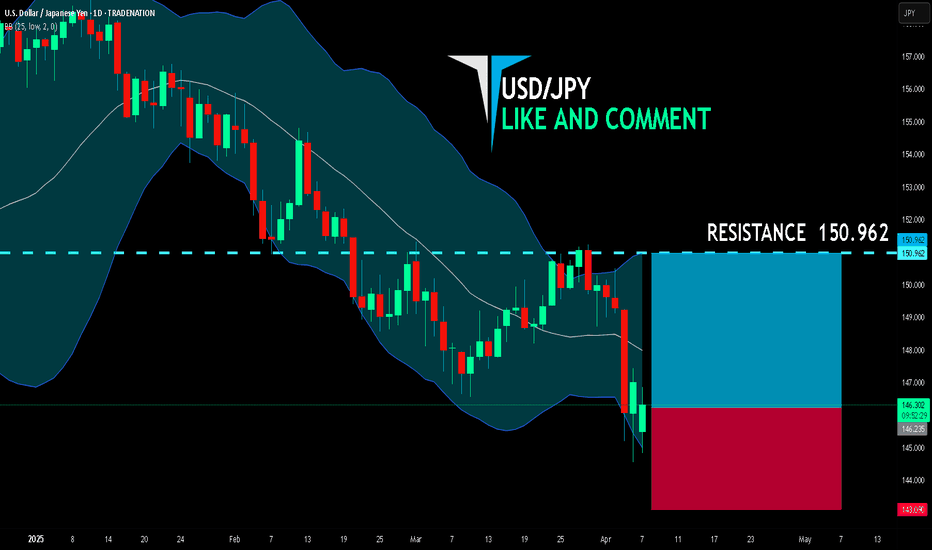
USD/JPY BULLS ARE GAINING STRENGTH|LONG
USD/JPY SIGNAL
Trade Direction: long
Entry Level: 146.235
Target Level: 150.962
Stop Loss: 143.090
RISK PROFILE
Risk level: medium
Suggested risk: 1%
Timeframe: 1D
Disclosure: I am part of Trade Nation's Influencer program and receive a monthly fee for using their TradingView charts in my analysis.
✅LIKE AND COMMENT MY IDEAS✅


