BTC - HTF confirmation pending...BINANCE:BTCUSDT
Sweeping H4/H12 range low — watching for SFP or strong bounce as a long trigger.
H4 structure broke bullish, flipped OB to breaker (unicorn overlap).
Long on sweep & SFP, target back to H4 MSB and range high.
Break below $104,400 — plan invalid, stay flat.
Wait for candle close, don’t front-run.
Long!!

Audusd Longprice is in bullish trend on the 4hr timeframe. price was consolidating around a 1hr poi and demand zone/ it recently broke through a 4hr key level and reached a 4hr poi. im expecting a minor pullback before continuing to the upside

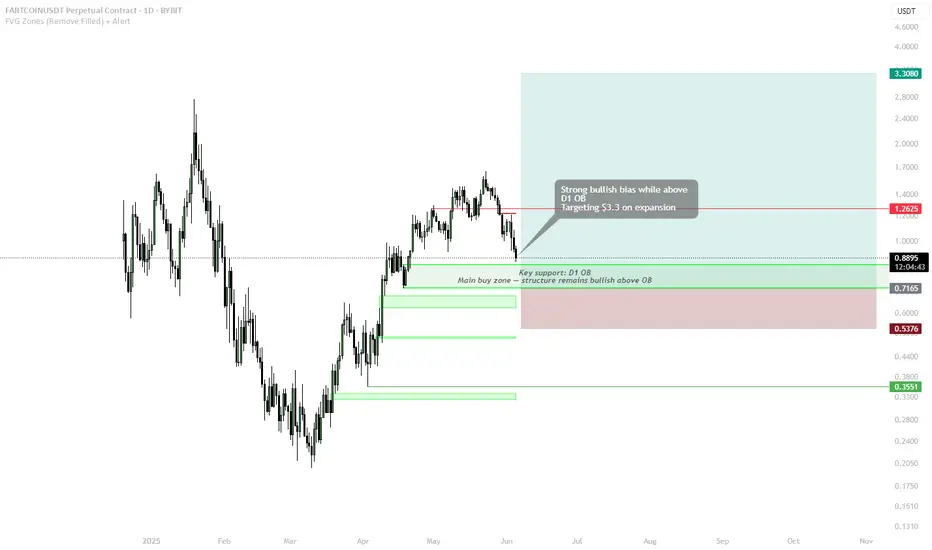
FARTCOIN | Bullish Structure Holding Above D1 OBMEXC:FARTCOINUSDT is consolidating above a key daily order block (D1 OB) that previously acted as a breakout base. The market structure remains strongly bullish as long as price holds above this level.
🟩 Key Support: $0.71–$0.86
• D1 OB cluster
• High-probability long zone if retested
• Below $0.71 = structural risk, but bullish bias holds while above
🎯 Main Target:
• $3.30 (expansion target)
• Clean upside R:R if OB holds and expansion resumes
• Intermediate resistance at $1.26 — ideal area to monitor for partial profit-taking or momentum confirmation
📌 Strategy:
• Monitor for reaction at current zone
• Spot entries or swing longs favorable above $0.71
• Structure flips bearish only below $0.35 (final invalidation)
GBPUSD Set To Grow! BUY!
My dear followers,
This is my opinion on the GBPUSD next move:
The asset is approaching an important pivot point 1.3459
Bias - Bullish
Technical Indicators: Supper Trend generates a clear long signal while Pivot Point HL is currently determining the overall Bullish trend of the market.
Goal - 1.3513
About Used Indicators:
For more efficient signals, super-trend is used in combination with other indicators like Pivot Points.
Disclosure: I am part of Trade Nation's Influencer program and receive a monthly fee for using their TradingView charts in my analysis.
———————————
WISH YOU ALL LUCK

EURNZD: Long Trading Opportunity
EURNZD
- Classic bullish setup
- Our team expects bullish continuation
SUGGESTED TRADE:
Swing Trade
Long EURNZD
Entry Point - 1.8875
Stop Loss - 1.8833
Take Profit - 1.8974
Our Risk - 1%
Start protection of your profits from lower levels
Disclosure: I am part of Trade Nation's Influencer program and receive a monthly fee for using their TradingView charts in my analysis.
❤️ Please, support our work with like & comment! ❤️

AUDNZD: Bulls Will Push
It is essential that we apply multitimeframe technical analysis and there is no better example of why that is the case than the current AUDNZD chart which, if analyzed properly, clearly points in the upward direction.
Disclosure: I am part of Trade Nation's Influencer program and receive a monthly fee for using their TradingView charts in my analysis.
❤️ Please, support our work with like & comment! ❤️

GBPAUD The Target Is UP! BUY!
My dear subscribers,
GBPAUD looks like it will make a good move, and here are the details:
The market is trading on 2.0849 pivot level.
Bias - Bullish
Technical Indicators: Both Super Trend & Pivot HL indicate a highly probable Bullish continuation.
Target - 2.0898
About Used Indicators:
The average true range (ATR) plays an important role in 'Supertrend' as the indicator uses ATR to calculate its value. The ATR indicator signals the degree of price volatility.
Disclosure: I am part of Trade Nation's Influencer program and receive a monthly fee for using their TradingView charts in my analysis.
———————————
WISH YOU ALL LUCK

USOIL Will Grow! Buy!
Take a look at our analysis for USOIL.
Time Frame: 1D
Current Trend: Bullish
Sentiment: Oversold (based on 7-period RSI)
Forecast: Bullish
The market is testing a major horizontal structure 62.890.
Taking into consideration the structure & trend analysis, I believe that the market will reach 68.865 level soon.
P.S
The term oversold refers to a condition where an asset has traded lower in price and has the potential for a price bounce.
Overbought refers to market scenarios where the instrument is traded considerably higher than its fair value. Overvaluation is caused by market sentiments when there is positive news.
Disclosure: I am part of Trade Nation's Influencer program and receive a monthly fee for using their TradingView charts in my analysis.
Like and subscribe and comment my ideas if you enjoy them!

USDCHF Will Go Higher! Long!
Here is our detailed technical review for USDCHF.
Time Frame: 9h
Current Trend: Bullish
Sentiment: Oversold (based on 7-period RSI)
Forecast: Bullish
The market is approaching a significant support area 0.819.
The underlined horizontal cluster clearly indicates a highly probable bullish movement with target 0.831 level.
P.S
Overbought describes a period of time where there has been a significant and consistent upward move in price over a period of time without much pullback.
Disclosure: I am part of Trade Nation's Influencer program and receive a monthly fee for using their TradingView charts in my analysis.
Like and subscribe and comment my ideas if you enjoy them!

GBPJPY Will Go Up! Buy!
Take a look at our analysis for GBPJPY.
Time Frame: 9h
Current Trend: Bullish
Sentiment: Oversold (based on 7-period RSI)
Forecast: Bullish
The market is on a crucial zone of demand 194.411.
The oversold market condition in a combination with key structure gives us a relatively strong bullish signal with goal 196.230 level.
P.S
Please, note that an oversold/overbought condition can last for a long time, and therefore being oversold/overbought doesn't mean a price rally will come soon, or at all.
Disclosure: I am part of Trade Nation's Influencer program and receive a monthly fee for using their TradingView charts in my analysis.
Like and subscribe and comment my ideas if you enjoy them!

GBP/NZD LONG FROM SUPPORT
GBP/NZD SIGNAL
Trade Direction: long
Entry Level: 2.245
Target Level: 2.268
Stop Loss: 2.229
RISK PROFILE
Risk level: medium
Suggested risk: 1%
Timeframe: 12h
Disclosure: I am part of Trade Nation's Influencer program and receive a monthly fee for using their TradingView charts in my analysis.
✅LIKE AND COMMENT MY IDEAS✅

GBP/AUD BULLS WILL DOMINATE THE MARKET|LONG
Hello, Friends!
GBP/AUD is making a bearish pullback on the 6H TF and is nearing the support line below while we are generally bullish biased on the pair due to our previous 1W candle analysis, thus making a trend-following long a good option for us with the target being the 2.095 level.
Disclosure: I am part of Trade Nation's Influencer program and receive a monthly fee for using their TradingView charts in my analysis.
✅LIKE AND COMMENT MY IDEAS✅

EUR/GBP BULLS WILL DOMINATE THE MARKET|LONG
EUR/GBP SIGNAL
Trade Direction: long
Entry Level: 0.837
Target Level: 0.843
Stop Loss: 0.832
RISK PROFILE
Risk level: medium
Suggested risk: 1%
Timeframe: 9h
Disclosure: I am part of Trade Nation's Influencer program and receive a monthly fee for using their TradingView charts in my analysis.
✅LIKE AND COMMENT MY IDEAS✅

EUR/CHF BULLISH BIAS RIGHT NOW| LONG
EUR/CHF SIGNAL
Trade Direction: long
Entry Level: 0.933
Target Level: 0.936
Stop Loss: 0.931
RISK PROFILE
Risk level: medium
Suggested risk: 1%
Timeframe: 2h
Disclosure: I am part of Trade Nation's Influencer program and receive a monthly fee for using their TradingView charts in my analysis.
✅LIKE AND COMMENT MY IDEAS✅

GBP/CHF BULLS ARE GAINING STRENGTH|LONG
Hello, Friends!
GBP/CHF is trending up which is obvious from the green colour of the previous weekly candle. However, the price has locally plunged into the oversold territory. Which can be told from its proximity to the BB lower band. Which presents a classical trend following opportunity for a long trade from the support line below towards the supply level of 1.112.
Disclosure: I am part of Trade Nation's Influencer program and receive a monthly fee for using their TradingView charts in my analysis.
✅LIKE AND COMMENT MY IDEAS✅

EURUSD Breakout and Potential RetraceHey Traders, in today's trading session we are monitoring EURUSD for a buying opportunity around 1.13700 zone, EURUSD was trading in a downtrend and successfully managed to break it out. Currently is in a correction phase in which it is approaching the retrace area at 1.13700 support and resistance area.
Trade safe, Joe.

AUDUSD Breakout and Potential RetraceHey Traders, in today's trading session we are monitoring AUDUSD for a buying opportunity around 0.64900 zone, AUDUSD was trading in a downtrend and successfully managed to break it out. Currently is in a correction phase in which it is approaching the retrace area at 0.64900 support and resistance zone.
Trade safe, Joe.

CADJPY UpdateAs anticipated, price has rejected the horizontal level and is now pulling back into a key demand zone on the H1–H4 timeframe.
I’m watching this area closely for bullish confirmation to take a long position toward the upper target zone. If bullish price action does not appear and bearish momentum continues, we could see an extended move down toward the weekly 100.00 level.
That said, I currently favor the upside scenario, with the expectation that the highlighted upper zone will be met — but only if the market confirms.
This setup is still theoretical. Patience is key — we trade based on confirmation, not assumption. Stay tuned for updates.

GOLD Trading Opportunity! BUY!
My dear subscribers,
This is my opinion on the GOLD next move:
The instrument tests an important psychological level 3344.4
Bias - Bullish
Technical Indicators: Supper Trend gives a precise Bullish signal, while Pivot Point HL predicts price changes and potential reversals in the market.
Target - 3358.5
My Stop Loss - 3336.9
About Used Indicators:
On the subsequent day, trading above the pivot point is thought to indicate ongoing bullish sentiment, while trading below the pivot point indicates bearish sentiment.
Disclosure: I am part of Trade Nation's Influencer program and receive a monthly fee for using their TradingView charts in my analysis.
———————————
WISH YOU ALL LUCK

CHFJPY On The Rise! BUY!
My dear friends,
CHFJPY looks like it will make a good move, and here are the details:
The market is trading on 174.39 pivot level.
Bias - Bullish
Technical Indicators: Supper Trend generates a clear long signal while Pivot Point HL is currently determining the overall Bullish trend of the market.
Goal - 174.60
About Used Indicators:
Pivot points are a great way to identify areas of support and resistance, but they work best when combined with other kinds of technical analysis
Disclosure: I am part of Trade Nation's Influencer program and receive a monthly fee for using their TradingView charts in my analysis.
———————————
WISH YOU ALL LUCK

EURAUD: Bullish Continuation
The analysis of the EURAUD chart clearly shows us that the pair is finally about to go up due to the rising pressure from the buyers.
Disclosure: I am part of Trade Nation's Influencer program and receive a monthly fee for using their TradingView charts in my analysis.
❤️ Please, support our work with like & comment! ❤️

GBPAUD: Will Start Growing! Here is Why:
Looking at the chart of GBPAUD right now we are seeing some interesting price action on the lower timeframes. Thus a local move up seems to be quite likely.
Disclosure: I am part of Trade Nation's Influencer program and receive a monthly fee for using their TradingView charts in my analysis.
❤️ Please, support our work with like & comment! ❤️

CRV - Two Scenarios for Strategic Spot BidsBINANCE:CRVUSDT
No FOMO, two clean entries.
Sweep S/R and reclaim EMA 200 — first trigger for spot longs. Equal lows at $0.61 — magnet for liquidity.
Deeper flush to demand = main buy zone ($0.40–0.56).
Stops under main demand.
Plan simple: let the market pick the entry for you.
