LITUSDT Weekly S/R| .618 Fibonacci| Price Action| Trend Evening Traders,
Today’s analysis – LITUSDT – rejecting from its .618 Fibonacii and is now trading below key resistance,
Points to consider,
- Price action impulsive
- Daily S/R Resistance
- Weekly S/R Support
- Price Action Range
LITUSDT’s immediate price action is trading under resistance, as long as price stay below, it is likely to trade lower.
The Weekly S/R is the immediate support, holding this area will create a local price action range, allowing for potential accumulation.
How price action trades within the range will dictate the immolate direction
Overall, in my opinion, LITUSDT needs form a constructive range before the next expansion
Hope this analysis helps,
Thank you for following my work
And remember,
“Once you find the system that works for your style/personality and confidence is gained, wash, rinse, repeat over and over again.” – Sunrisetrader
Long-short

BTC 200EMA 4HBTC currently retesting the 4H 200EMA as support. This also coincides with the RBR (rally base rally) demand zone area highlighted in green as additional support.
The FVG (Fair value gap) I had previously mentioned in my last post has now been filled, adding to the conclusion that although BTC could still drop from here it's looking like a strong place to start building a long position. It is key that this demand zone area holds to continue the recent bullish trend.

LTCUSDT Int-Weekly S/R| Daily S/R| .618 Fibonacci| VAH Evening Traders,
Today’s analysis – LTCUSDT – trading at a clear resistance where a trend reversal is probable,
Points to consider,
- Price action impulsive
- .618 Fibaoncci Resistance
- Daily S/R Resistance
- VAH Resistance
LTCUSDT’s immediate price action is trading at an area of technical resistance confluence, this allows for a bearish bias.
The area is in confluence with the .618 Fibonacci, VAH, Daily S/R and the Internal Weekly S/R, this deems the area for potential trend reversal.
The immediate objective is the lower Daily S/R Support, a bounce here is likely which will then need a further analysis.
Overall, in my opinion, LTCUSDT is a valid short with defined risk, price action is to be used upon discretion/ management.
Hope this analysis helps,
Thank you for following my work
And remember,
“Confidence is not "I will profit on this trade." Confidence is "I will be fine if I don't profit from this trade.”
― Yvan Byeajee

ATOMUSD Bullish OB| Monthly S/R| Psfp| InternalS/R| PAEvening Traders,
Today’s analysis – ATOMUSD- trading away from a key support region, a pullback needs to hold for a bullish continuation.
Points to consider,
- Price action impulsive
- Monthly S/R Support
- Psfp Liquidity
- Bullish OB Support
- Internal S/R Support
ATOMUSD’s immediate price action is trading with consecutive higher lows, allowing for a bullish bias.
The current level of confluence is situated around the Monthly S/R, this includes the VAH, Psfp, Internal S/R and a Bullish OB.
The overall objective is the Daily S/R, exceeding this level will lead to a trend continuation.
Overall, in my opinion, ATOMUSD is a valid long with defined risk, price action is to be used upon discretion/ management.
Hope this analysis helps,
Thank you for following my work
And remember!,
“It is always the best discretion to let the market show us where it is going and just simply follow (this would be prudent), rather than predict where the market is going and place a position (this would be gambling).” -Anne-Marie Baiynd’

Eur/UsdHello traders! In my opinion, in medium term this pair is sell.
Target:
Buy 1.0880 (sell confirmation)
Sell 1.0160
Be careful and wait for a confirmation!
Don`t forget to look at the economic calendar!
MAKE MONEY AND ENJOY LIFE 💰
THANK YOU!
GOOD LUCK!
🙏🏻🙏🏻🙏🏻

DOTUSDT Range VAL| .618 Fib| Psfp| Price Action Evening Traders,
Today’s analysis – DOTUSDT- rejection of from a key level and is now rotating towards the lows,
Points to consider,
- Price action impulsive
- POC S/R Support
- .618 Fiboancci Support
- Range VAL Support
DOTUSDT’s immediate price action is trading towards an area that has technical confluence with the .618 Fiboancci, VAL and the POC region, this allows for a bullish bias.
Holding support at the technical level will allow for a bounce back towards the range high,
Overall, in my opinion, DOTUSDT is a valid long with defines risk, price action is to be used upon discretion/ management.
Hope this analysis helps
Thank you for following my work
And remember,
“Hope is bogus emotion that only costs you money.” – Jim Cramer

06/02/23 Weekly outlookLast weeks high: $24279
Last weeks low: $23381
Midpoint: $22482.5
More of the same consolidation and choppiness last week as the week previous, with FOMC propelling BTC to a high of 24.4k, still short of where I feel like most people have their shorts positioned around 25k waiting for a swing fail. It would not surprise me if we saw a local high for a little while and BTC drops to the 21.5k range before any further leg up.
With a large FVG just under the 22.3k area looking to be filled, this is where I'm looking to do business.
Short from current level and long from 21.5

OCEANUSDT Bullish MS| Local Resistance| Higher Low| Liquidity Evening Traders,
Today’s analysis – OCEANUSDT- trading at a local resistance where a rejection is plausible,
Points to consider,
- Price Action Impulsive
- Local Psfp Resistance
- Daily S/R Resistance
- Dynamic S/R Support
- .618 Fibonacci Support
- Local VAH Support
OCEANUSDT’s immediate price action is impulsive, putting a local high here will increase the probability of price action correcting for a higher low.
The local POI will be the Dynamic S/R Support that is in confluence with the Psfp, VAH and .618 Fibonacci, allowing for a bullish bias.
Overall, price action needs to retrace for this trade to become probable, discretion is to be used upon execution/ management.
Hope this analysis helps!
Thank you for following my work
And remember,
“In order to succeed, you first have to be willing to experience failure.”
― Yvan Byeajee,

CRVUSDT Daily S/R| Psfp| .618 Fibonacci| Equal Highs Evening Traders,
Today’s analysis – CRVUSDT – trading in a consolidation with a clear set of equal highs that are likely to get taken,
Points to consider,
- Price action impulsive
- Daily S/R Support
- .618 Fibaoncci Support
- Equal Highs Objective
CRVUSDT’s immidie price action is trading in a consolidation that will breaking in the coming days.
A breaking down needs to hold at the current area of confluence, that is with, the Daily S/R, Psfp, and the .618 Fibaoncci, allowing for a bullish bias.
The immediate objective is the Equal Highs, exveeding this level will lead to a larger rise
Overall, in my opinion, CRVUSDT is a valid long with defined risk, price action is to be used upon discretion/ management.
Hope this analysis helps,
Thank you for following my work
And remember!
“You create your own game in your mind based on your beliefs, intents, perception and rules.”
― Mark Douglas

ETHUSDT Monthly S/R| HTF .618 | Psfp | Price Action Evening Traders,
Today’s analysis- ETHUSDT- trading at a key resistance zone where a rejection lower is possible,
Points to consider,
- Price action impulsive
- Monthly S/R Resistance
- HTF .618 Fiboancci Resistance
- Sfp-entry area
ETHUSDT’s immediate price action is trading in a zone that is considered resistance due to technical confluence such as the Monthly S/R, HTF .618 and Psfp, allowing for a bearish bias.
The immediate objective will be the low Psfp, this is an area of resting liquidity this a magnet for price action.
Overall, in my opinion, ETHUSDT is a valid short with defined risk, price action is to be used upon discretion/ management.
Hope this analysis helps,
Thank you for following my work
And remember,
“If you don’t respect risk, eventually they’ll carry you out.” – Larry Hite

USDJPY Weekly S/R| VAL| Psfp| Price Action Evening Traders,
Today’s analysis – USDJPY – trading at a key level of support where a bounce towards the highs is probable,
Points to consider,
- Price Action corrective
- Daily S/R support
- VAL Support
- Channel low
USDJPY’s immediate price action is trading towards an area that is in technical confluence with the .618 Fibonacci, Weekly S/R, VAL and the Psfp, allowing for a bullish bias.
Breaking out of the current channel will signify a change in market structure, this will mean a new higher high.
The immediate objective is the Daily S/R, exceeding this level will lead to high targets.
Overall, in my opinion, USDJPY is a valid long with defined risk, price action is to be used upon discretion/ management.
Hope this analysis helps!,
Thank you for following my work
And remember,
Trading is mostly a waiting game. if you want action that happens on your own terms, you’re in the wrong field.

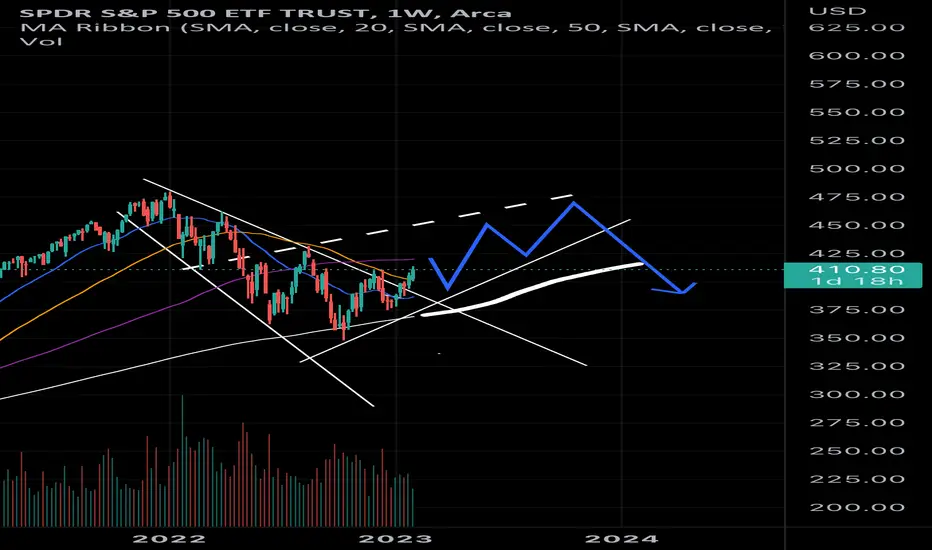
InspyreThe market does what she wants, could be an interesting set up for a drop in September.
Seems to have broken out of decending triangle.. could be an opportunity to bounce into the 430’s June/July. Delaying any recession news and pumping “soft bottom” articles. Transitioning from put to call dominant late into August. Triggering a large outflux and negative news dump, easily sliding down into the 360’s to print puts.
EURGBP | INTRADAY POTENTIAL ENTRIESA fully formed inverted head and shoulders pattern has now been spotted.
With EURO news just around the corner with ECB President Lagarde speaking, we could see a quick influx for the Euro. This could be a chance to pickup a quick few $$$
Take home 50 pips! and grab that Liquidity above!
Id then be looking to short back down to support as our weekly timeframe suggests EURO will weaken against the POUND.
We must be reactive and not predictive and wait for candle structure to give us the go ahead for the SHORT trade, if it doesn't its quite possible to break to the upside of which then we can look for a long position for another Intraday type trade.

SOLUSDT Bullish uptrend| Local PA Range| Daily S/R| .618 Evening Traders,
Today’s analysis – SOLUSDT- trading in a defined range where an up-thrust into resistance is probable,
Points to consider,
- Price action impulsive
- Daily S/R Support
- .618 Fibonacci Support
- MS Higher Low
SOLUSDT’s immediate price action is impulsive, it is potentially establishing a higher low that is in confluence with the .618 Fibonacci, Daily S/R and the VAL, allowing for a bullish bias.
The immediate market structure remains bullish, thus, there is a higher probability of price action testing resistance again.
Overall, in my opinion, SOLUSDT is a valid long with defined risk, price action is to be used upon discretion/ management.
Hope this analysis helps,
Thank you for following my work
And remember,
If you can’t take a small loss, sooner or later you will take the mother of all losses.” – Ed Seykota

GMTUSDT Daily S/R| .618 Fibonacci| Price Action| Trend Evening Traders,
Today’s analysis – GMTUSDT- trading towards a clear support level where a bounce is probable,
Points to consider,
- Price Action Corrective
- Daily S/R Support
- .618 Fibonacci Support
- Bullish Order Block
GMTUSDT’s immediate price action is coming close towards a support level that is in technical confliuenc with a Daily S/R and the .618 Fiboancci, allowing for a bullih bias.
The immediate objective is the Daily S/R Resistance, exceeding this level will lead to a bullish continuation.
Overall, in my opinion, GMTUSDT is a Valid long with defined risk, price action is to be used upon discretion/ management.
Hope this analysis helps,
Thank you for following my work
And remember,
“When you learn to let go of the need to be right, being wrong gradually lose its power to disturb you.”
― Yvan Byeajee

30/01/23 Weekly outlookLast weeks high: $23975
Last weeks low: $23148.5
Midpoint: $22321.5
A choppier week last week than the week previous. However, last week still saw BTC climb over 1k.
The range quarters are a very good guide of where to find support and resistances for the week coming. I think the majority is predicting a retest of 25k before correcting, with FOMC on the near horizon taking some profits maybe wise to de-risk against incoming volatility and just in case we correct before that 25k key level.

SHIBUSDT Local Resistance| Daily S/R| Psfp| Trend Evening Traders,
Today’s analysis – SHIBUSDT- trading at a local resistance area where a pullback will allow for a long,
Points to consider,
- Price action impulsive
- Daily S/R Support
- Range Low Support
- Psfp Objective
SHIBUSDT’s immediate price action is rejection from local resistance, allowing for a pullback into support confluence of a Daily S/R , Psfp and Range Low.
Holding the pullback will mean a potential rotation back towards range high, the overall objective is the Psfp.
Overall, in my opinion, SHIBUSDT is a valid long after a pull back with defined risk, price action is to be used upon discretion/ management.
Hope this analysis helps!
Thank you for following my work,
And remember,
“Do not anticipate and move without market confirmation—being a little late in your trade is your insurance that you are right or wrong.” -Jesse Livermore

SNR - EntryA magnificient move by GOLD since OCT, it has shown great effort in giving bull vibes along with other pairs in contrary of dollar index drop. Now the price has form a SNR by a strong support point that is getting reject from sellers, we have to give in a try as well it favors for the orderflow
cons are the price may fall as it gets rejected from the sellers on the top as well and have it mitigated more than 5 times on the support bias

LUNAUSD H&S Pattern| Pullback| Int- Daily S/R| .618 Fib| PAEvening Traders,
Today’s analysis, LUNAUSDT – trading in a trend that is potentially coming to an end, allowing for a pullback to long,
Points to consider,
- Price Action Impulsive
- Potential Head and Shoulders
- .618 Fibonacci Support
- Int-Daily S/R Confluence
- Higher Low Objective
LUNUSD’s immediate price action is impulsive and is trading with a potential head and shoulders, hinting towards a correction for a test of the lower Int- Daly S/R.
The lower level of support is in confluence with the .618 Fiboancci and the VAL of the current up-trend. Holding this level is critical for a bounce and the start of wave three.
Overall, in my opinion, LUNAUSD is a valid long with defined risk, price action is to be used upon discretion/ management.
Hope this analysis helps,
Thank you for following my work!
And remember,
“All statistics have outliers. Money management, therefore, is key to the process of good trading.”
― Yvan Byeajee


i like this for a sabe 13%, but...There is a huge bear flag after the end of the trend. i like more $DRIP for a 80%
AMD: Key Reversals, and Short-Covering RalliesAMD has been in a bear market since December 1st, 2022. For those of you who took a short position, you have had to endure three major short-covering rallies. The first short-covering rally which began on December 12th may have made you reconsider your decision to short in the first place, and you probably got out at some point. But when is the best time to get out and possibly go long? Identifying key reversals can be helpful in these situations.
In a bear market, a key reversal is when the price makes a new low but closes on or near the high (the opposite is the case in a bull market). A bar chart can help you see this better. I've placed black arrows under the obvious key reversals on the daily chart. The orange arrow shows a key reversal that may not fit the definition exactly since the price closed just above the middle and not very close to the high.
These rallies only lasted a couple of days each, and since the key reversal can't be identified until the end of the first day, the opportunity to make gains with a long position only lasted one day.
An opportunity to go long has just presented itself on January 6th with a key reversal. I'm expecting a rally on January 9th. The question is, will this rally continue to the upper resistance line, or fizzle out in a day or two and retest the support it bounced off? I'll be watching.
Disclaimer: I am not a financial advisor, and the above statements are not investment advice. My comments are only intended for educational purposes. You are solely responsible for your own trading decisions.

BNBUSDT Daily S/R| Trading Range| Price Action| Trend Evening Traders,
Today’s analysis – BNBUSDT – trading at a clear resistance where a rejection is plausible,
Points to consider,
- Price Action corrective
- Daily S/R Resistance
- Int Daily S/R Support ‘
- Pull back objective
BNBUSDT’s immediate price action is trading at a resistance, that being a key Daily S/R level, this allows for a bullish bias.
The immediate objective is the Int-daily S/R, rotating towards the lows will continue the overall range.
Overall, in my opinion, BNBUSDT is a valid short with defined risk, price action is to be used upon discretion/ management.
Hope this analysis helps,
Thank you for following my work
And remember,
“The mind is a fascinating instrument that can make or break you.”
― yvan Byeajee
