Aragon VS Bitcoin 30% Fast Growth PotentialAragon found the bottom at 24.5k satoshis, where it produced a spike, back on 27th of June. Price then went up and recently broke above the 50 Moving Average as well as the descending channel.
These are the first signals of a potential corrective move upwards, especially as the 50 Moving Average is now acting as the support. The buying opportunity could have presented itself and ANT/BTC might correct up, towards one of the Fibonacci resistance levels.
First resistance is at 36k satoshis area, confirmed by two Fibonacci levels. Break and close above it should push price higher, towards the key resistance located at 40k satoshis area. Not only this is a 50% Fibs level, but also the price where previously 50 MA was rejected, not to mention a strong psychological level.
The downside risk at this point is low in relation to the potential corrective move upwards, but if Aragon will close below 24.5k satoshis support, this would invalidate bullish outlook, where the downtrend is likely to continue.
Long-signal

Substratum Potential 20% Gain Over BitcoinSubstratum found the bottom at 3824 satoshis, tested on the 13th of June. Then price broke above the descending channel, and finally, today it broke above the 50 Moving Average suggesting the beginning of either a correctional wave up, or a long term uptrend continuation.
SUB/BTC price is likely to increase towards the 61.8% Fibonacci retracement level area, that is around 5200 satoshis. Previously price rejected this level as the support on two occasions.
The downside risk at this point is minimal, although a short term consolidation or a small move down can be expected. But only break and close below the 3824 low could result in a continuation of an uptrend and invalidate growth potential.

Substratum Upside ReversalSubstratum currently trading at the support area, between $0.3 and $0.38, that is 88.6% Fibonacci retracement level of the recent corrective wave down. Currently SUB/USD is right at the Fibs support, which could and should continue to act as the support.
As long as price stays above the $0.3, SUB should start moving upwards and could reach $1.43 area in the medium term. The $1.43 resistance is confirmed by two Fibonacci retracement levels, 38.2% Fibs applied through the all-time high, and 161.8% Fibs applied through the recent corrective wave down.
At the same time consolidation phase could take place and price might continue to range around $0.4 area. But only break and close below $0.3 could invalidate bullish outlook and send price lower.

Hcash | Hshare VS BitcionThe Hshare coin has found the support at 910 satoshis, which is 78.6% Fibonacci. The support has been rejected, along with the uptrend trendline. The high highs, higher lows pattern remains valid, and combined with the rejection of the support, current price action suggests growth.
The resistance is seen at 3225 satoshis, that is 127.2% Fibonacci retracement level. It clearly corresponds to the previous support and resistance areas formed back in 2017.
Further downtrend at this stage seems to be unlikely, nevertheless, daily break and close below 910 satoshis could push price down to 600 satoshis are to form a double bottom.

WaltonChain Facing Support AreaWaltonChain continues to trade upwards while producing higher highs and higher lows. Now WTC/USD is going through a healthy correction down after hitting the high at $18.8. The current support can be seen around $14 area which previously has acted as a resistance. The support is confirmed by the upper trendline of the descending channel, 50 Moving Average as well as the 2/1 Gann Fan trendline.
From this area price could continue rising and could go as high as $45, forming a double top near the previous resistance formed back in January. At the same time $36 resistance, that is 76.4% Fibs, should be watched closely as only break above should push price higher.
On a downside, it is possible that WaltonChain will go lower and could hit the $10 psychological support before the uptrend continues, but only break and close below $10 should invalidate bullish outlook.

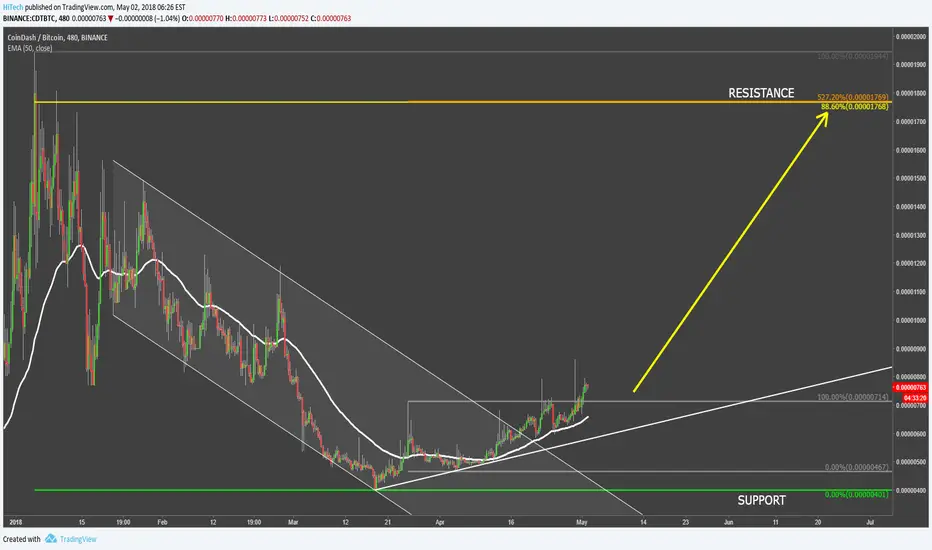
CoinDash VS Bitcoin Getting The MomentumCoinDash has found th bottom at 400 satoshis and since then has established a clear uptrend while producing higher highs and higher lows. Price broke above the descending channel as well as 50 Moving Average. The 50 Moving Average now is acting as a support which has been rejected multiple times.
It seems CDT/BTC is getting enough momentum to continue going higher, where the strong resistance is seen at 1770 satoshis. The resistance is confirmed by two Fibonacci retracement levels, 88.6% and 527.2% Fibs applied to the corrective wave after the break above the Moving Average.
On a downside, price could correct down to the uptrend trendline or even 460 satoshis support before moving higher. Although the uptrend contamination at this stage is much move favorable.
Aeron Feeling Strong Against the BitcoinAeron formed the strong bottom at 13k satoshis and rejected that level for 3 consecutive times. The most recent bounce occurred on the 11th of May, after which price started to produce higher highs and higher lows.
ARN/BTC broke above the 200 Moving Average and then above the ascending channel, suggesting the beginning of an uptrend. The strong resistance is seen at 161.8% Fibonacci retracement level, that is 31.5k satoshis. This means that it could potentially outperform the Bitcoin by almost 3 times in the medium term.
It seems that the downside risk at this point is very low and probability of the uptrend is much higher. Nevertheless, break and close below the 13k support could invalidate bullish outlook and extend the consolidation.

EURUSDthis move up is just a quick move until it breaks the trend as of now I'm just catching some quick pips for the down move as long as the trend holds if it breaks it ill wait for the retest to get another buy in

IOStoken Uptrend is Far From OverIOStoken bottomed out near $0.016, after which the uptrend begun. Price broke above the 50 Moving Average as well as the downtrend trendline. IOST/USD continues to steadily climb up while rejecting the uptrend trendline.
Fibonacci applied to the first corrective wave down after the breakout of the Moving Average shows that IOStoken has rejected 227.2% level, where it found the support. The following wave up resulted in rejection of the 427.2% Fibs resistance, however just recently price broke above, suggesting the continuation of the uptrend.
There are multiple resistance levels to watch, however the key resistance is based at 1227.2% Fibonacci retracement level, that is $0.159. Statistically coins upside targets tend to be in increments of 10 from the bottom. As the bottom has been found at $0.016, multiplied that by 10 would make it $0.16, which is perfectly inline with the final upside target.
On a downside, the correction down would be quite normal and should be expected. The nearest support is at $0.68 where IOST/USD could retrace. Break below that level could send price slightly lower before uptrend continuation would take place. But in any case, strong downtrend establishment have very low probability at this point.

Golem - signs of a Bull MarketGolem has formed a double bottom at $0.177 several weeks ago. And recently price spiked up breaking above multiple resistances. The strong rise resulted in a break above the 200 Moving Average, descending channel as well as the $0.5 resistance level.
This could suggest that buyers are starting to be active and the trend could be reversing to the upside. The first potential upside target is located at 61.8% Fibonacci retracement level that is $0.8 area, which is also correspond to the 227.2% Fibonacci channel trendline.
After the short lived rally GNT/USD could take some rest and consolidate before continue going up, perhaps the decline will be down to the 200 Moving Average. Nevertheless the trend now seems to be bullish and another wave up could be just around the corner.

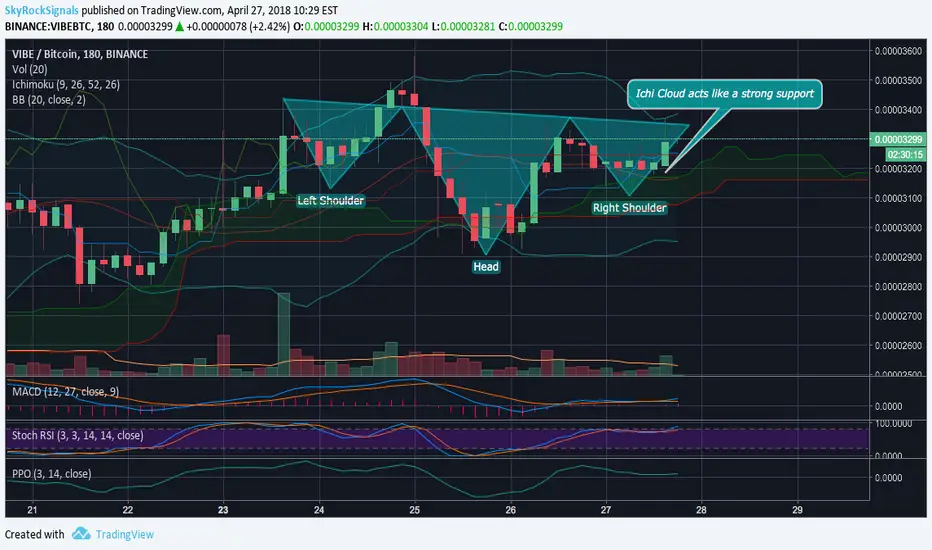
VIBEBTC Reversed H&SWe found a finished reversed H&S pattern and analyzed technical indicators which are bullish now. It seems like Ichi Cloud acts like a strong support zone, the price bounces from the upper edge of it. Chikou Span line is above Tenkan-sen line which means lagged for m periods close price is higher than the line of reverse so there should be a bounce which will start uptrend. Reversed H&S pattern has been formed which enhances our forecast
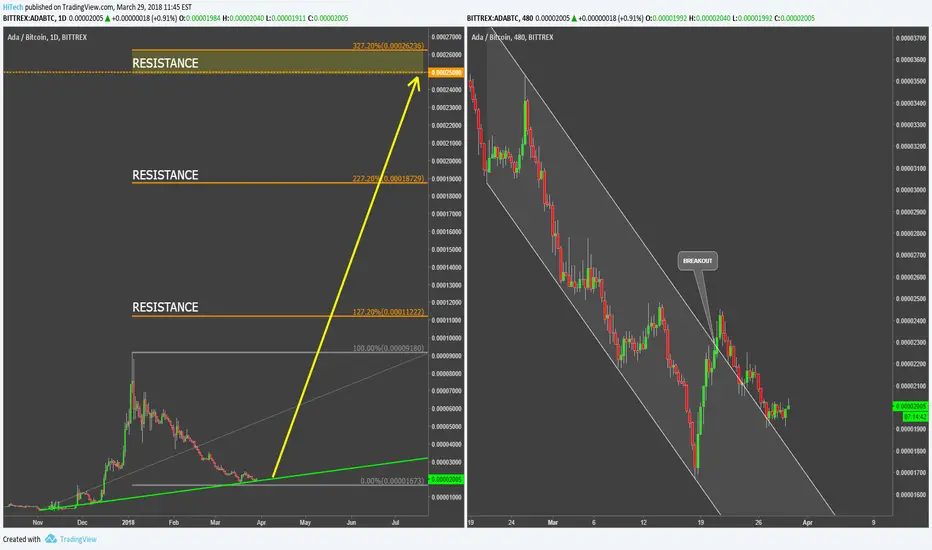
Cardano VS Bitcoin Presenting a Perfect Buying OpportunityCardano has already corrected by over 80% since reaching an all-time high at 9180 satoshis. But now it is facing the support at 1670 satoshis as the uptrend trendline has been rejected cleanly.
On a lower time-frame price broke above the descending channel and then found the support at the upper trendline of the channel. Statistically after the 80% correction cryptocurrencies tend to grow x10 time of average. Taking this in consideration, the next upside target could be as high as 26k satoshis, that is 327.2% Fibonacci retracement level applied to the last corrective wave down.
On a downside, there is not much downside potential for ADA/BTC, of course it could go slightly lower, but the trend reversal is imminent and it is only a matter of time.
Ripple VS Bitcoin To Continue RisingRipple has found the bottom at 6900 satoshis and begun to produce higher highs and higher lows. Price has broke the 50 Moving Average first, where then it found the support which has been rejected. Then it broke above the descending channel suggesting the beginning of an uptrend, or at least a correctional move up.
It is possible that XRP/BTC will correct down first before going higher, but overall trend now seems to be bullish. The first target is at 38.2% Fibonacci retracement, that is at 10k satoshis area. Second and key resistance is at 61.8% Fibonacci, that is 11k satoshis area. Break above the 61.8% Fibs should confirm long term bullish trend, while the rejection could result in yet another wave down.
On the downside, price could test the uptrend trendline first, but only break and close below 6900 satoshis might invalidate bullish outlook.

Iota next targetWe have seen previous correction of iota. Now as analyzes show it is heading to the next target at 2.299. indicators are in normal position and candlestick formation gives us good signal. If you use stop loss I have put it at 1.9144. Wish you lot of pips.

Lisk Trend Reversal Might be CloseCurrently Lisk is trading at $8.2 after it has declined from the $40 all-time high. The total loss to the USD was 80%, which is an average correction after the rally within cryptocurrency market.
LSK/USD is now facing strong support at 88.6% Fibonacci retracement. At the same time RSI is forming a bullish divergence, that might be the first sign of a trend reversal, or at the very least a correctional move up.
The could be a great long term buying opportunity, but only if a daily close will remain above the $8.18 support. Break and close below it could extend the consolidation and send price slightly lower before the beginning of the uptrend.

EURJPY BUY TRADE!Buy limit @ 130.87 (Daily Pivot/38.2%)
Stop @ 130.300 (Below s5 Daily Pivot)
TP @ 133.200 (50% Retracement/ key level)

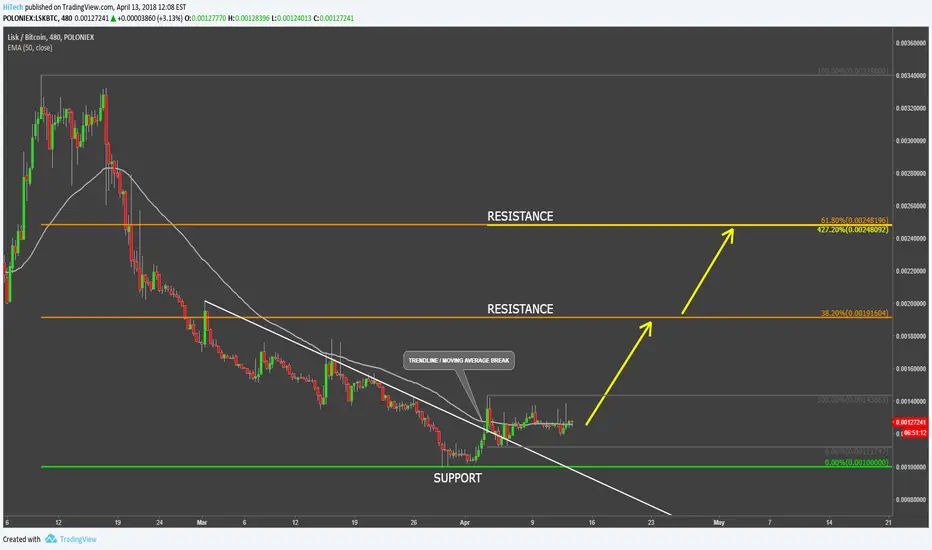
Lisk VS Bitcoin Short Term ViewLisk has found the bottom at precisely 100k satoshis. This is truly a very strong psychological support that clearly was rejected. The following wave up resulted in the break above the downtrend trendline as well as 50 Moving Average simultaneously.
This could be the very beginning of the long term uptrend continuation or at least a strong corrective move upwards. The first resistance is at 190k satoshis that is 38.2% Fibonacci retracement level. Second, the key resistance is at 250k satoshis, that is 61.8% Fibs.
While most coins have been moving upwards, Lisk has gained very little in the past couple of weeks and it could result in a strong recovery in the short term. On a downside, only a daily break and close below 100k satoshis could invalidate bullish outlook.
BAYBTC preparing to reach the next targetThe signal was given yesterday and we have made a good profit within a day, currently the coin is ready to reach the last targets as bullish Gartley butterfly pattern has been formed. Indicators are positive and trend is confirmed. Stay tuned to receive the best trading information and join our Premium channel to receive profitable signals once they appear.

Entered LONG CADJPY after engulfing in H1Engulfing in 60 chart, and in H4 we can see rejection from 83.850 monthly zone in the last candle. Target in the next zone, SL under the box that is under the monthly zone.
1.73 RR
Target 84.500
SL 83.530

Zcash Medium Term Potential 300%During the December rally, Zcash hasn't been the top choice for investors, although it showed a healthy 500% gain, reaching USD 813. On a corrective move down ZEC/USD lost almost 70% and was stopped at the 76.4% Fibonacci retracement, hitting USD 254 low.
Price failed to close below that support and what is, more importantly, 8/1 Gann Fan trendline was rejected with surgical precision. This is the key support and it has been rejected, suggesting the continuation of the uptrend.
Fibonacci retracement level applied to the last correction down as well as prior corrective wave after the downtrend trendline breakout shows that the strong resistance is at $1500 area, that is nearly 300% growth potential. At the same time, $1000 area resistance could be an obstacle as it also is a potential technical resistance and a strong psychological round number.

VIABTC Cup&HandleThe price successfully reached our previous target mentioned in the last analysis of this coin and went dip. We carefully tracked its movement and for now it has consolidated and is ready for another wave of growth. Formed Cup&handle proves VIA's bullish mood. Use this analysis for a self trading, join our telegram channel to see targets stop loss and a buying zone

Ionomy VS Bitcoin x15 Growth PotentialIonomy has been ranging between 9k and 57k satoshis for almost a year. But on the 22nd of February ION/BTC closed above the resistance, suggesting the uptrend could be emerging.
Throughout the consolidation period, price broke above the descending channels for two times and Fibonacci applied to the corrective wave after the breakout shows that the potential upside target is 420k satoshis, that is almost x15 from the current price.
The reason behind such an enormous growth potential could be the extremely low price ($3.23) in relation to the total coin supply that stands at 26,083,122 ION.

trade with >70% probability. BUY@ 1.2324 ; stop-loss @ 1.2292trade with >70% probability.
BUY@ 1.2324 ;
stop-loss @ 1.2292
