Syscoin Should Move Up 150%While producing higher highs and higher lows, Syscoin continues to trade upwards. The last correction down resulted in 70% decline, where price moved from $1 down to $0.3, where 161.8% Fibonacci support, as well as the uptrend trendline, have been rejected.
After rejecting the support SYS/USD recovered by moving up 144%, resulting in the break above the descending channel. The corrective wave down followed where 261.8% Fibonacci support and the upper trendline of the descending channel have been rejected, suggesting the continuation of the uptrend.
The strong resistance, confirmed by two Fibonacci retracement levels is located at $1.5, which is a 150% growth potential in the medium term. Currently, the price could consolidate between $0.5 and $0.75, which seem to be the accumulation zone.
Long-signal

Ripple VS Bitcoin Uptrend After ConsolidationRipple has produced a double top near 22k satoshi and corrected down, to 10k satoshis area where it found the support. The support is at 61.8% Fibonacci retracement level, where price spiked below but failed to break it with confidence.
Currently, XRP/BTC is forming a triangle pattern, which could lean in the uptrend continuation. Although the consolidation could be extended, while price will remain within the triangle.
Break and close above the downtrend trendline should confirm bullish intentions of the Ripple, sending the price up to 30k satoshis area, at 127.2% Fibonacci retracement level.
On a downside, break and close below the uptrend trendline might result in a wave down towards 76.4% Fibs, at 6.3k satoshis, where buying opportunity could be even more attractive.

trade with >70% probability. buy@ 1.2213 ; stop-loss @ 1.2259trade with >70% probability.
buy@ 1.2213 ;
stop-loss @ 1.2259

BlockNet 200% Growth PotentialFrom September up until December 2017, BlockNet has been ranging between $36 and $13, but in January 2018 price broke the range moving above the previous resistance at $36. BLOCK/USD reached the high at $56.
The following corrective move down resulted in price going back to $20 where it rejected the 88.6% Fibonacci retracement level as well s the 8/1 Gann Fan trendline suggesting that the correction has ended.
Currently, BlockNet is trading at the previous support near 36$, which now is acting a support. This could seem a good entry point for BlockNet investors, from where the price is likely to continue moving highre.
Price could grow as much as 200% from the current price reaching $100 psychological resistance confirmed by 227.2% Fibonacci retracement and 361.8% Fibonacci channel lines. At the same time break above the channel could be the safer way to trade BlockNet, but it seems that the buying opportunity is already offered.

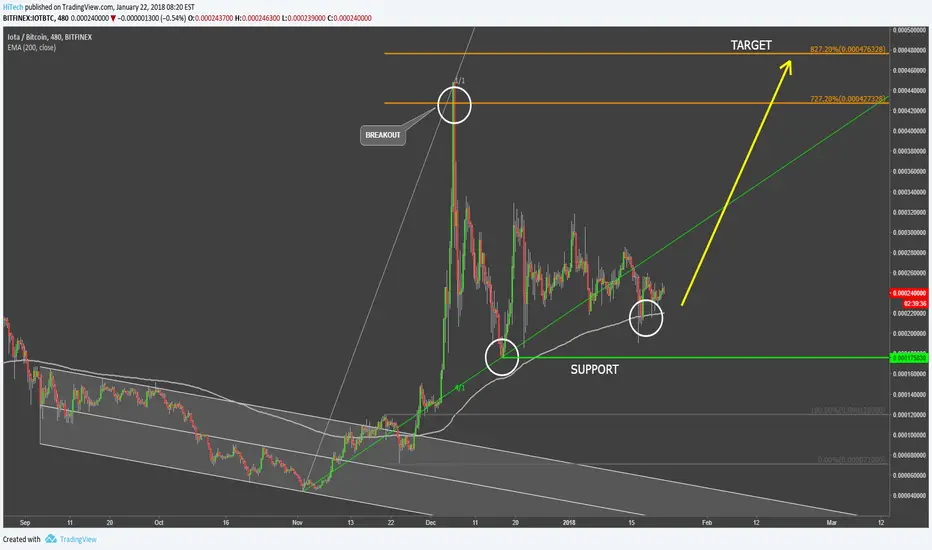
Iota VS Bitcoin Expected Upside TargetFollowing the previous idea on Iota VS Bitcoin , it went higher as expected breaking above the descending channel. But the question is how far more it'll go?
After breaking above the channel IOT/BTC corrected down to 71k satoshi and almost immediately went up to 448k satoshi. Fibonacci applied to the corrective wave after the breakout shows that price broke the 727.2% resistance level and corrected down sharply.
The correctional wave stopped at 4/1 Gann Fan trendline, that is 17.5k satoshi support. The consolidation period followed and this weekend price rejected the 200 Moving Average, suggesting that Iota is ready to go higher. The next Fibonacci resistance is at 827.2% retracement level that is 476k satoshi and this is where the expected upside target is.
The support remains at 17.5k satoshi, and there is a possibility that it will return back to this support, perhaps spiking lower. But in any case, price is expected to grow and high the upside target in the short to medium term.
Synereo (AMP) VS Bitcoin UptrendSynereo (AMP) found the support at 17k satoshi and went up breaking above the 200 Moving Average. What is more important is that AMP/BTC has also broke above a very strong resistance at 6770 sats, that previously acted as a support as well as resistance, but today price managed to clearly close above that level, not to mention that the uptrend trendline has been rejected.
From this point, 6770 sats should act as a support pushing price higher. The first strong resistance is seen at 15k satoshi, where 50% Fibonacci retracement is. In addition, 261.8% Fibs, applied to the corrective wave after the MA breakout, is also at the 15k satoshi level. It seems that the uptrend continuation is just around the corner and price could double in the coming weeks. Break above 15k sats should send the price to 17600 satoshi, and if it breaks higher then it could be the actual trend reversal, rather than the correctional wave up. Only a break and close below the 200 MA could invalidate bullish outlook.

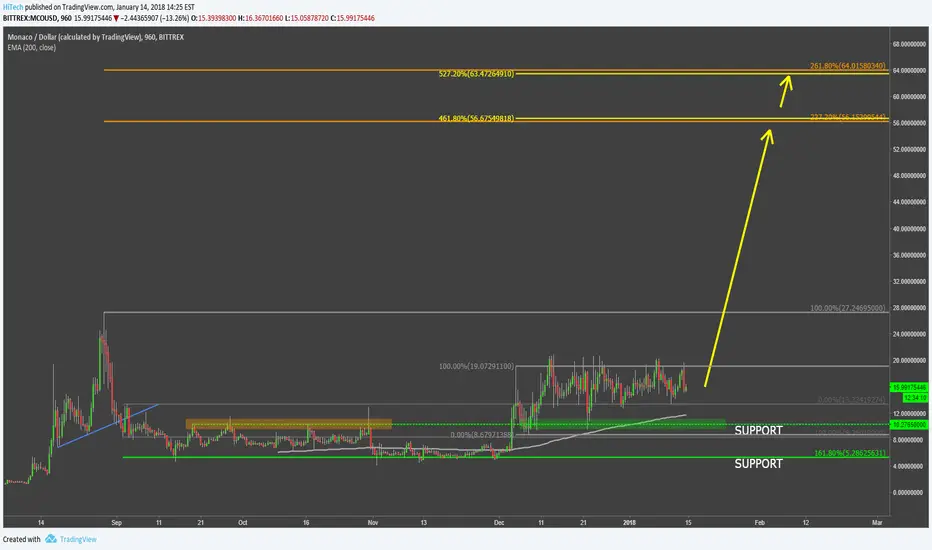
Monaco Coin Could Grow Over 300%Following the previous idea on Monaco Coin , it broke above the range zone, that was between $5 and $10. After breaking above $10 major resistance area price reached $19 and corrected back to the $10 support that has been rejected.
MCO/USD continued to trading within the $10-20 range where $10 was rejected twice. At the same time Monaco Coin continues to trade above the 200 Moving Average and at this point, the uptrend is likely to continue.
Major resistance levels are at $56 and $63 which are inline with two Fibonacci retracement levels, this means that the gain of the potential wave up could be over 300%. Only break and close below the $5 support could invalidate bullish outlook.
Namecoin Could Double In USD ValueFollowing the previous ide on Namecoin , it has reached the upside target at $5, corrected back and then went up to $8.4, breaking the resistance. The corrective wave down followed where price corrected back to the previous resistance area near $5.
This could be a potential starting point for the next wave up that could reach $10 mark that is confirmed by two Fibonacci retracement levels, 327.2% and 1227.2% as per previous analysis.

USDSEK 2300PIPS HUNT USDSEK
To open LONG positions for USDSEK , it is required:
In this situation our system indicators to confirm trade entry confirmation for movement to the upside but if the market trend continues to range this signal will become invalid. Market execution for entry, I will confirm signal once the conditions have been met.
Risk Description: Once signal is confirmed we will execute more positions on the position on H1 and 30M charts. Minimum 2350 pips will be up for grab with small risk SL at swing high. Target 5000 pips
Profit expectations: 6-20 day trade length expected before hitting profit target I will post exit strategy when signal receives a exit signal.
Trading method: RSADVANTAGE Stage 5, accurate system manually forward tested over 3 years designed to stay out of ranging markets and only target strong trends suited for swing trading. This system is made of custom adaptive volume indicators and Oscillators that properly detect trends very early and provides exit signals at dynamic S/R zones once the trend has ended. // Average yearly pips gained is 40k per pair on D1 charts alone. I have provided a similar limited version of the system on Trading view to help traders visualize the strategy.

Ionomy Might Grow 10 TimesFollowing the previous idea on Ionomy , it has reached the upside target at $3 and broke above it, reaching the $5 high. Then price corrected sharply down to the previous resistance at $2, which now is acting as a support. At the same time, ION/USD is testing the uptrend trendline and the 200 Moving Average.
This is indeed a very strong support for Ionomy which could result in rejection and the continuation of the uptrend. If support will be rejected, the next wave up could reach the previous high at $5. Breaking above that resistance would accelerate Ionomy growth and send the price up to $12 resistance, confirmed by two Fibonacci retracement levels.

PowerLedger VS Bitcoin New All-Time High?PowerLedge started an uptrend after it tested 2600 satoshi low on the 8th of December. Price consistently went higher producing higher highs and higher lows. POWR/BTC even managed to break above the previous all-time high at 11.8k satoshi reaching a new high at 14.2k satoshi.
On a corrective wave down it rejected the previous resistance at 7600sat, that has been acting as a support. Yesterday PowerLedge once again attempted to break below this resistance but failed as it only managed to produce the spikes that went lower, but no definitive breakout has been recorded. Not to mention, that price rejected the 4/1 Gann Fan trendline.
This could suggest that POWR/BTC might continue going higher where the next upside target is seen at 15.5k sats. Break above that resistance should confirm further strength and should send it much higher, therefore that level should be watched closely. On a downside note, only a break and close below the 6.4k sats could invalidate bullish outlook.

NavCoin To Form Double Top?NavCoin is clearly trending upwards while printing higher lows and higher highs. NAV/BTC gained 300% over Bitcoin in just under a week, rising from 8.6k up to 33.8k satoshi. The corrective wave down followed, and the price dropped to the 22.7k satoshi.
This is the key support for NavCoin as multiple supports were rejected. First is the previous low established just before the last wave up. Second is the downtrend trendline and third is the 3/1 Gann Fan trendline. The support is strong and should result in at least one wave up towards the previous high at 33.8k satoshi. On the downside, only a daily break and close below 22.7k level could result in further correction down.

Stellar Lumen Still FlyingLumen continues trending upwards while producing higher highs and higher lows. On the last wave up it produced an all-time high, hitting $0.97 and breaking above the 427.2% Fibonacci resistance level applied to the last wave where 200 Moving Average was rejected.
Following corrective wave down resulted in the 60% decline and price went as low as $0.4, where 200 Moving Average was rejected once again. After, XLM/USD went up breaking the downtrend trendline suggesting that the uptrend is now likely to resume. The first strong resistance is seen at the $1.18 where two Fibonacci retracement levels are inline. Only a break and close below the 200 Moving Average could invalidate bullish outlook.

Gulden Breaks Above The ChannelGulden found the bottom at 500 satoshi and started to move higher breaking above the 200 Moving Average. After the breakout price corrected back and rejected both the 200 MA and the uptrend trendline.
The next wave up followed and NLG/BTC broke above the descending channel suggesting the uptrend has started. Considering that the price was rising sharply it is possible that Gulden will take a break and consolidate for a little while, but the immediate uptrend continuation is also possible especially after price rejected the upper trendline of the descending channel.
The first target is seen at 6k satoshi, that is 38.2% Fibonacci retracement applied through the all-time high. The second target is 7.7k satoshi that is 50% Fibs that goes inline with a 361.8% retracement level of the Fibs applied to the last corrective wave down. Only break and close 500 satoshi could invalidate bullish outlook.

ByteBall Taking Over BitcoinByteBall has been trending downwards since July 2017 and was stopped at BTC 0.012 after it lost almost 100% to Bitcoin. The RSI indicator formed a bullish divergence and from BTC 0.012 support GBYTE/BTC started to rise and broke an extremely strong resistance at BTC 0.04.
The corrective wave followed and the previous resistance at 0.04 has been acting as a support, the price simply failed to go lower. Today ByteBall has broken above the previous high at BTC 0.06, confirming the beginning of an uptrend.
The potential upside targets could be one of the Fibonacci retracement levels, either 38.2%, 50% or 61.8%. Only break and close below the BTC 0.012 support could invalidate bullish outlook.

Incent Can Offer You IncentiveIncent has been ranging for an extended period of time although recently it has shown good performance while rising from $0.05 up to $1. Price established an all-time new high and it seems that the upside momentum is just getting stronger.
INCNT/USD broke above the 227.2% Fibonacci resistance and continues to trade above the 200 Moving Average. With the higher highs and higher lows being printed, the price is expected to rise up to one of the Fibonacci resistance levels, with the final target being at $3.48. Only break and close below the 200 MA could invalidate bullish outlook.

EURUSD Potential Buying OpportunityThe zone between $1.191 and $1.19 is an area where there will likely be some strong buy orders. I will be looking to get long in that area and ride out a short-term up move toward the $1.1935-1.195. There is no major economic news to look out for until Thursday 1/11/18 when the EU GDP figure is released.

Stratis Could Be Ready To Move HigherStratis has been in a heavy uptrend since the beginning of November and from $2 it has grown up to $22, gaining almost 900%. Indeed its a huge growth but it seems that Stratis is not done yet and there could be more gains to collect.
After reaching $22 all-time high price went back to $19, where it found the support confirmed by the 161.8% Fibonacci retracement level applied to the previous all-time high. From this price STRAT/USD could continue going up and the next strong resistance is seen at 261.8% retracement level, that is $26. Only a break and close below $19 support could invalidate bullish outlook.

Monero VS Bitcion Expecting More GainsFollowing the previous idea on Monero VS Bitcoin , it hit the upside target at btc 0.22 and went higher up to btc 0.029. Although price corrected back to the previous resistance which is now acting as a support.
This price seems a good entry point for a short-term trend up. The next strong resistance is located very close to the btc 0.03 psychological round number, that is confirmed by the 76.4% Fibonacci retracement level. It is quite likely that the next wave will be going up to test that resistance. Break above could push it even further, but it is yet to be seen if Monero indeed that strong. Only a break below the 200 Moving Average could invalidate bullish outlook.

ParkByte VS Bitcoin Strong Upside PotentialParkByte found the support at 5k satoshi after which it started to move higher, breaking above the downtrend trendline and the 200 Moving Average, reaching 11k satoshi. On a corrective wave down, PKB/BTC rejected the 200 Moving Average which is now acting as a strong support.
Such price action suggests that the uptrend could be just around the corner especially after price started to produce higher lows and higher highs, reaching today 14k satoshi. The upside potential is strong, where ParkByte could outperform the Bitcoin by four times while targeting 38k satoshi. This is the price where two Fibonacci are inline, first is 38.2% level applied through the all-time high, and second is 88.6% retracement applied from 12th October high to 8th of December low. On a downside, only a break and close below the 4k satoshi support could invalidate bullish outlook.

Komodo Uptrend To ContinueFollowing the previous idea on Komodo , it has reached the upside target at $7 and broke higher reaching the $14.4 high. The corrective wave down followed while price rejected the support 727.2% Fibonacci, that is $7.1.
Currently, it seems that the uptrend is likely to continue to test next Fibonacci resistance level at $1727.2% retracement level, that is $14.7. While the support is holding, uptrend should remain valid pushing Komodo to new all-time highs. Break and close below could invalidate bullish outlook.

ParkByte Has The Potential To Double In ValueParkByte has been trending upwards since it tested the low at $0.08 on the 11th of July. Price broke the 200 Moving Average and continues to trade above it. PKB/USD at the same time has been trading within the ascending channel, but on the 25th of December managed to close above, signaling that the uptrend could accelerate.
The buying opportunity is there and considering the recent price action, ParkByte could more than double in value against USD, targeting $3 psychological resistance level. At this price two Fibonacci confirming the resistance, first is the 127.2% applied to the corrective wave down from June, and the 361.8% Fibs applied to the corrective wave after the ascending channel breakout. Keep in mind that break below the $6.5 support could invalidate bullish outlook.

Gnosis vs. Bitcoin, Good entry for 560% run!GNOBTC
Good to entry now, or near Blue line.
After breakout Blue line targets:
Target 1: 0445 (160%)
Target 2: 0675 (294%)
Target 3: 0861 (400%)
Target 4: 1047 (560%)
