ALPHA$for my opinion dorp+base=rolley is the most useful pattern in market
in there we saw sth like that.
my idea is on the chart and i'll get position if i get ent.trigger
GOODLUCK
Long-term

AudUsd Channel TrendHaven't had much chart time lately, but decided to do a quick mark up. Started on the weekly time frame and drew a trend line along with the S/R line. From there skipped down to 4hr and noticed the channel where I proceeded to mark up possible reversal areas. Wouldn't mind jumping in once the current zone is broken.

is it possible to get above 60k again ?hello guys
I wanted to keep the chart simple and I know we have a lot of resistance in our way.
if you look at the channel, we had 2 perfect bounces, and last time the price reached the top of the channel.
I'm not talking about a week, this is a long-term vision.
maybe we get a test on 39 - 40k in the coming days or maybe we just see consolidation above 40k.
why do I think this channel can be accurate ?
because if you look at the middle of the channel it's around 52 - 53k, which is important to break that level!
we need something like this path to reach 60k.
......
this is Bollinger band + MACD
we will touch the middle line soon or later (if I remember correctly it's 21 SMA or MA ).
if you look at the picture, we had 1 false breakout like last time + divergence on MACD and buy signal on MACD as well.
I remember when BTC was around 28 29k , the people were bearish and looking for 25k and 20k. people waited for 30k this time and it didn't happen as well!
the time will tell us it was bottom or not.
please share your idea with me and let me know what do you think about it !!!
.....
do your own research !
it's not financial advice.
take care and don't use high leverage, please :)

Review BTC this is long term BTC Channel.
if break 45600-46000 in daily i think it can grow up to 53000 , 65000 and top of the channel 71000.
other wise the price will test again bottom of the channel

NFLX Long opportunityWe are looking to buy NFLX if the price breaks the trend line, we notice a Support level after the gap, the market tested 356 level twice rejected and run-up.
Waiting for opening and confirmations.

$ACWX relative to $SPY potential (3/5)Conviction: 3/5
Overall still in LT (2009) down channel, so trade is quite risky... you are trading against the trend...
HOWEVER:
bounced off MT (2018) trend support
RSI looks pretty good
SPY ourperformance against world is pretty outrageous in the last 2 years, so some mean-reversion is likely
Trade duration... 3-5 months.
Much better trade is to wait for breakout confirmation, and wait for entry from likely retest.

$ACWX decision point!Unclear what is going to happen... probably not a good idea to trade this right now.
Can trade small position within the channel, although risky to trade against the trend...
Bull case:
potential bull flag setup
good relative value (in terms of performance) to S&P 500
holding peak-price support from 2017 so far
better to wait for confirmation of bull flag?
Bear case:
touching medium/long-term (2011) channel resistance
RSI-W at low levels, but not oversold yet

LUNA playLong play for luna. Long until the blue line if breaks we could see massive uptrend if not, you know what to do

4HR GOLDEN CROSS IS SOO NEAR4h golden cross is near thi is very important for bulls..
see thi btc history of after golden cross

Good time to load up on ALT's or your favorite projectsAs per crypto, Volatility has been quite interesting to watch.
We're headed for hyperinflation due to sh*tty fiscal policy by most governments, I think crypto assets will always have a place.
Floating above the 200EMA, bounced off the trendline nicely and still on course. I honestly think 1T is a good floor price, so much growth for protocols and digital utilization.
It's a new paradigm as they say, power to the people. It would be a good time to load up if you are willing to risk it and forget till 2030.
(Disclaimer, not financial advice, just my opinion)

LTCBTC - Don't miss the 7x growthBINANCE:LTCBTC triple divergence on the MACD on the 1W timeframe. This was only in 2017, after which LTC grew 7 times. Now the price is at a minimum since 2017, with a similar divergence.
At the same time, there is a strong downtrend on 1W. And if this week closes below 0.002994, there is a high probability of falling to the area of 0.002091 - 0.002464. There are also no reversal setups on 1D yet.
I plan to buy LTC 10% of the amount from the current ones. The rest of the amount is distributed in the range of the expected fall, or I will wait for a good setup on 1D to enter.

EURNZD - BUY ONLY - Reversal Daily Pattern
SL : 1.608
TP 1: 1.79
TP 2 : 1.956 ~ 1.98
Buy Limit : 1.64920
SL : 1.63
Tp : 1.710
TP2 : 1.737
TP3 : 1.793

USDCHF - Reversal Sign - Weekly Sideway Movement (TP : 0.747)
Analysis : Double Bottom : Irregular Wave pattern,but Expecting Weekly Sideway.
Status : Oversold - Weekly
Buy : 0.717x area
SL : 0.70890
TP : 0.747
TP : 0.72281
SL : 0.71
* If you need any analysis, Please let me know, I will try to do my best.
Trade only 0.01 lot.

USOIL BULLISH USOil is currently creating a Bullish Flag on the 1H and 4H. This is indicating bullish momentum is soon to come.
Potential Targets are $96 and $104.

Litecoin Weekly Hot Fibonacci RetracementWaiting for a consolidation and a nice structer. Fibonacci levels between 61.8% and 78.6%.

Case of cough bear DAXThe year 2022 has started with macroeconomic anxiety and clamor around monetary policy talking points, while stock markets have been wreaked by volatility. Whether this turns out to be a well-deserved respite for the broader bull run or a long-drawn slide to infamy remains to be seen.
In any eventuality, TA should help to draw a game plan and aid us to grasp opportunities even if headwinds prevail.
The above chart depicts a hypothesis for DAX performance index using harmonic patterns:
A standard retracement from January 2022 top works out to a key turning point at level 14500. However, the structure would not be invalidated until the barrier fails at level 13800. Meeting that criteria, a relief rally would ensue until 15800, fulling the pattern. It should be noted that the definition of the pattern still implies a bearish outcome. Timeframe for the action to play out is between Feb and mid-May or early June 2022.
In regards to crypto markets; some enthusiasts could argue stock comparisons to be irrelevant or unfit. However, inferring from how the market is developing from here on out the gyrations between asset classes may become more cohesive when institutional involvement and their active participation increase.

#BTC Cross EMA50#BTC Update
Bulls have claimed the EMA50 ($42700)
Next Resistance zone is EMA100 ($46000)
SEND IT 🏋🏻♀️

#SHIB RunningSHIB Broke the falling channel with massive volume.
More To come...
Send it to $0.000065

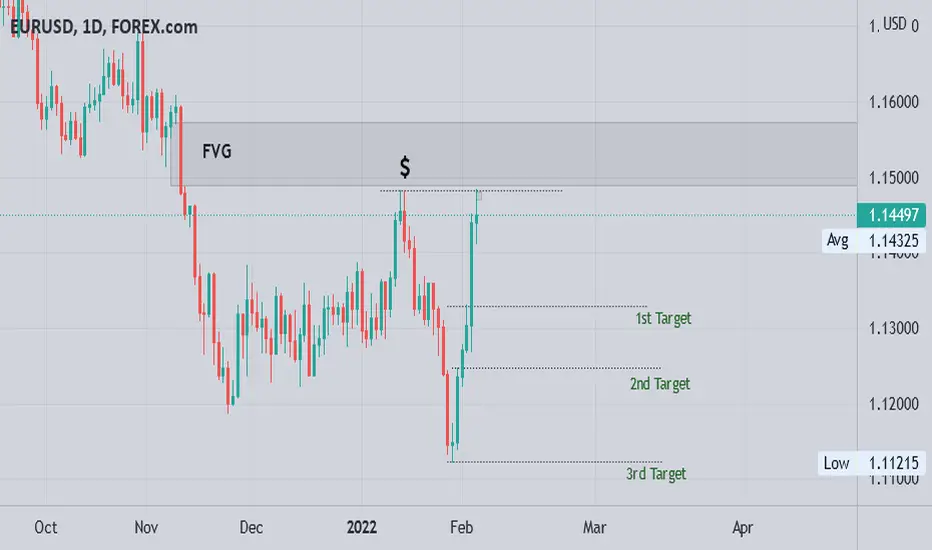
EUR/USDEUR/USD is gonna be bearish this entire week or maybe for longer. seeing EUR/USD trying to reach out those targets is possible..
POSITINAL BUY TATA CONSUMER Formation of pol & Flagpositinal buy at 750, SL 700,Target 799, 850,900. mujhe pol and flag pettern najar aarah hai, , do your analysis brfore buy

BTC DAILY POST (1/3) XABCD PATTERNShere are the XABCD Patterns I found on the bitcoin chart : )
---------------------------------------------------------------------------------------------------------------------------------------------------------------------------------------
If you enjoyed this post and agree with me, a like and a sub would be very nice : )
If you have any other ideas or simply disagree, manifest yourself in the comments ⬇️⬇️⬇️
Stay updated for more content
Have a nice Day : ) Bye!
---------------------------------------------------------------------------------------------------------------------------------------------------------------------------------------

Analysis USDJPYHello traders, I see that UJ rejected the 61% to the upside already. That gave the confirmation of the divergence on the RSI. If you want more confirmation, lets wait for candle structure to form. Wait reach my targets since it is the beginning of the month where most news comes out.

GBPUSD Long Term AnalysisIf price breaks structure and trendline looking for price to reach back to the top.
