Long-term

24.01 -28.08 Price trend changingHello, i build trend lines and at 24-28.01 that's levels support&resistance levels will cross. So i think it will start of bull run for GRT.

LINKing the linesLINK has had a rough time since May 2021 and has fallen >50% from its ATH. Despite the fall, the chart confirms clear long-term support since March 2020 (almost 2 years!). It has recently bounced from the lower trend line so it can continue upward within the triangle and meet the descending trend line as resistance.
In the mid-term the price can bounce within the triangle (unless a bullish breakout occurs earlier) until it decides which way to go. With the ~2 year support line I think a breakout is more likely but I will revisit as/if it approaches that area. Potential mid-long term targets are marked on the chart based on resistance points.
With this being a long-term hold entering through DCA will reduce the risk.
Please note I am not a financial advisor and this is not financial advice. All ideas are for educational purposes only :)
Please feel free to leave your comments, questions and thoughts below!

Empower Clinics Turnaround through the Deep Crab?Welcome to my extensive and detailed analysis on Empower Clinics.
This analysis was first published by me Highrisk221 on 29/11/2021 at 20:15.
Date and time information is based on Berlin time zone
We look at Empower Clinics in the 4 hours chart
As we can see in the chart, the price action has formed a Harmonic Trend Reversal Pattern, a Deep Crab :
Target 1 0.350 CAD
Target 2 0.420 CAD
Target 3 0.610 CAD
Target 4 0.710
Target 5 0.995
The MAximal target for this pattern is given as 1.285 CAD.
The whole analysis gets an invalidation as soon as the price falls below 0.105CAD.
If you liked this idea, I would appreciate a click on the Like button ;)
If you have any questions, suggestions or a different opinion, don't be afraid to use the comment function.
Thanks a lot
Disclaimer/ Disclaimer of liability
Always do your own research before investing and seek the advice of someone trained to do so.
The analysis shown here is to be understood as my personal opinion on the possible price development of Gamestop GME, it was prepared to the best of my knowledge and belief.
However, I can not guarantee or warrant the accuracy, completeness or timeliness.
This analysis was published for informative and scientific purposes only.
It is not suitable for imitation or investment basis, and must not be understood as investment advice, buy, sell, hold or trade recommendation.
It is expressly discouraged, a trading decision or investment, based on my analysis or other published by me, information, articles, content or the like, to perform or make.
My analyses are always based on probability calculations and on my personal experience, so this analysis must be considered as a probability statement, which neither completely, partially so or so similar, must or can occur.
This analysis does not take into account any fundamental data!
You should also be aware that trading and speculation with CFDs, foreign exchange, futures, currencies, options, warrants, cryptocurrencies, shares, securities as well as other financial and trading instruments, whether leveraged or not leveraged, is always accompanied by an enormously high risk of loss, whereby you can lose both part and your entire capital and possibly beyond (note margin call).
Before making any trading decisions or investments, always do your own due diligence and consider your investment objectives, financial circumstances, needs as well as your level of experience and expertise.
In addition, always seek advice from an investment advisor, financial advisor and/or bank.
Also, always check with your broker, bank, etc. about the exact and individual risks, terms and conditions, and whether or not you are subject to margin calls.
On average, over 70-90% of investors lose their capital when trading such financial products.
You always act on your own responsibility and therefore bear the sole risk.
I therefore accept no liability for any damage/losses that you may incur or suffer as a result of your own actions.

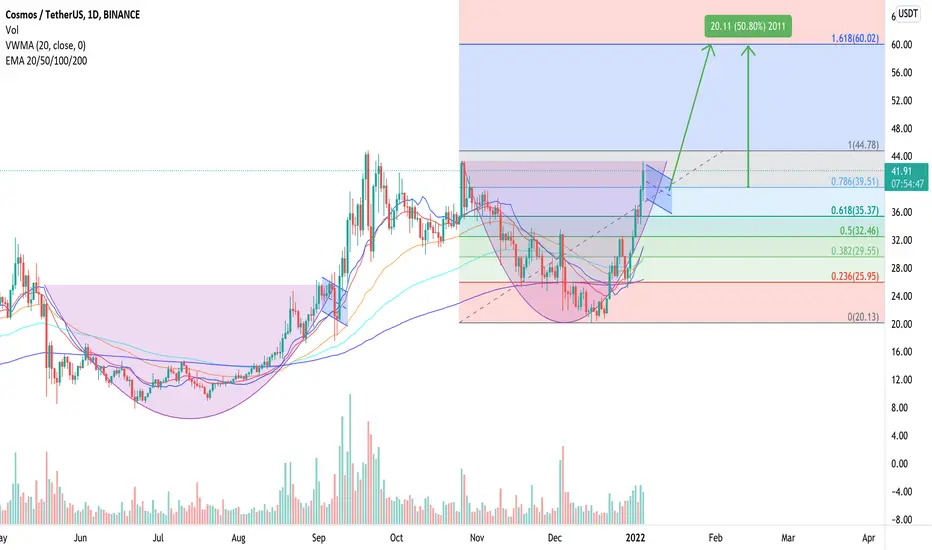
Splitting the ATOM (Long-term Analysis)ATOM has been performing well despite the rocky road BTC is paving. In its previous breakout, ATOM formed a cup & handle pattern which resulted in a strong breakout. It looks like ATOM is performing a similar pattern which began at the end of Oct 2021.
- It dropped from a high;
- It paused when it dropped from the high which rounded the bottom of the cup;
- It is re-testing the high at the beginning of the cup; and
- The volume on the right side of the cup is on average lower than on the left
A small retrace in price can occur to either the 78.6 or 61.8 levels followed by a breakout to complete this bullish pattern. In the event of a strong breakout ATOM could make its way to the 161.8 fib forming a new ATH.
On the other hand, ATOM could do what NEAR token is doing and simply keep moving up and breaking its resistances with ease.
Never buy at an ATH.
Which scenario do you think is most likely?
Please note I am not a financial advisor and this is not financial advice. All ideas are for educational purposes only :)
Please feel free to leave your comments, questions and thoughts below!
"TWOU" "2U"A player who make a difference in the Edu market.
Educational Services industry is $1.4tr in 2021.
What do you think will happen by 2025? 2030?
Exactly!!

Communications is KeyIn my honest opinion here. When looking at S&P through RRG, Communications sector XLC looks really good long term. Short term watch out as we could go as low as 70's or more before the bounce. But this should offer a nice low point of buy in, providing the FED does not mess it up. Pay attention to Communications news over this time span. maybe a week or two max.

MEIP LongAnalysis of the MEIP instrument and the possibility of its future movement relative to price ranges.

CBAY LongAnalysis of the CBAY instrument and the possibility of its future movement relative to price ranges.

lONG TERMWAVEWS/USDT
have in down trend ıt wıll have to start a new trend lıne to going up
it will be start in buy zone

TRON - TRX - Double bottom - Position - Long-termA double bottom is formed following a single rounding bottom pattern which can also be the first sign of a potential reversal. Rounding bottom patterns will typically occur at the end of an extended bearish trend. The double bottom formation constructed from two consecutive rounding bottoms can also infer that investors are following the security to capitalize on its last push lower toward a support level. A double bottom will typically indicate a bullish reversal which provides an opportunity for investors to obtain profits from a bullish rally. After a double bottom, common trading strategies include long positions that will profit from a rising security price.
$TRON $TRX

The Money MAKERMKR saw a huge rise in May 2021 followed by a sharp fall due to the market conditions at the time. Ever since, it has failed to get close to making a new ATH. It is currently trading just above one of its long-term support lines and will be testing its long-term resistance (black line) over the coming days. The volume being traded is low so MKR will only break through the resistance if there is good momentum. Until then I believe it will hold above its support and continue to trade close to it.
In the event that there is enough volume to break the resistance, a strong bullish wave may form with potential mid to long-term targets marked on the chart.
Please note that this is not financial advice and I am not a financial advisor. All ideas are for educational purposes only :)
Please feel free to comment with your thoughts and ideas!


Predictable targets for Bitcoin in long termThe trend line is the bitcoin uptrend line in the weekly timeframe, which has broken down. Of course, this failure is not substantial, and the red arrow indicates that the trading volume of the red candlesticks was below the 10-day average. So we can hope that candles and volume will not confirm the break of the trend line. Also, on the Ichimoku indicator, we have the support line of SinkoSpan A, which may prevent prices from falling below $ 46,000. But if this trend line is broken down, the next target will be the support of 29,000, and in case of possible failure, the strong support will be 20,000.
Also, the diameter of the Ichimoku cloud indicates a slow decline in the price and sideways trend of bitcoins. With this, until the bitcoin price stabilizes, there is no recommendation for long positions on cryptocurrencies.

BTCUSDT LONG LONG CYCLEDo you see what i see in chart? it might come true :) i just made few calculation for gain ratio and cycle time ratio, and it aimed late 2024 with 120k as new ATH.
this is my idea ,not an advise .
