15% for MEME soonMEME is showing strength as market is bullish, I am expecting continuation with 15% minimum gain tomorrow.
NOT A FINANCIAL ADVICE
MANAGE YOUR RISK AND ALWAYS USE STOPLOSS
LONG

SOL — Breakout Watch & Range Play1. Watch for breakout above trendline
2. Hold support 151–147 for bullish scenario
3. Target: 168.4 (pre month high)
4. Stop: below 125.9 (pre month low)

GBPUSD: Bullish Continuation & Long Signal
GBPUSD
- Classic bullish pattern
- Our team expects retracement
SUGGESTED TRADE:
Swing Trade
Buy GBPUSD
Entry - 1.3503
Stop - 1.3453
Take - 1.3608
Our Risk - 1%
Start protection of your profits from lower levels
Disclosure: I am part of Trade Nation's Influencer program and receive a monthly fee for using their TradingView charts in my analysis.
❤️ Please, support our work with like & comment! ❤️

EURUSD: Long Trading Opportunity
EURUSD
- Classic bullish setup
- Our team expects bullish continuation
SUGGESTED TRADE:
Swing Trade
Long EURUSD
Entry Point - 1.1685
Stop Loss - 1.1664
Take Profit - 1.1728
Our Risk - 1%
Start protection of your profits from lower levels
Disclosure: I am part of Trade Nation's Influencer program and receive a monthly fee for using their TradingView charts in my analysis.
❤️ Please, support our work with like & comment! ❤️

Gold can reach resistance level, break it and continue to riseHello traders, I want share with you my opinion about Gold. Recently, price formed a clean upward wedge pattern and is showing strong bullish behaviour. After bouncing off the support level at 3275, the price entered the buyer zone (3255 - 3275) and reversed with a confident impulse up, signalling renewed interest from buyers. From there, price has consistently respected the support line, printing higher lows and slowly climbing back toward the resistance level at 3410. This level has acted as a significant rejection area before, but this time, the structure looks stronger. Each pull-back has been shallow, and buyers are stepping in faster. The momentum is slowly building. Now the price is trading just below resistance and moving with a bullish trajectory. I expect Gold to continue its climb, first reaching the Resistance Level, and then targeting the seller zone (3410 - 3430). That’s why I’ve set my TP at 3430 points - right inside this upper area where I anticipate profit-taking and potential reversal. Given the bullish pattern structure, the wedge formation, and the strength of recent impulses, I stay bullish and expect further growth in the coming sessions. Please share this idea with your friends and click Boost 🚀
Disclaimer: As part of ThinkMarkets’ Influencer Program, I am sponsored to share and publish their charts in my analysis.

EURAUD: Expecting Bullish Movement! Here is Why:
It is essential that we apply multitimeframe technical analysis and there is no better example of why that is the case than the current EURAUD chart which, if analyzed properly, clearly points in the upward direction.
Disclosure: I am part of Trade Nation's Influencer program and receive a monthly fee for using their TradingView charts in my analysis.
❤️ Please, support our work with like & comment! ❤️

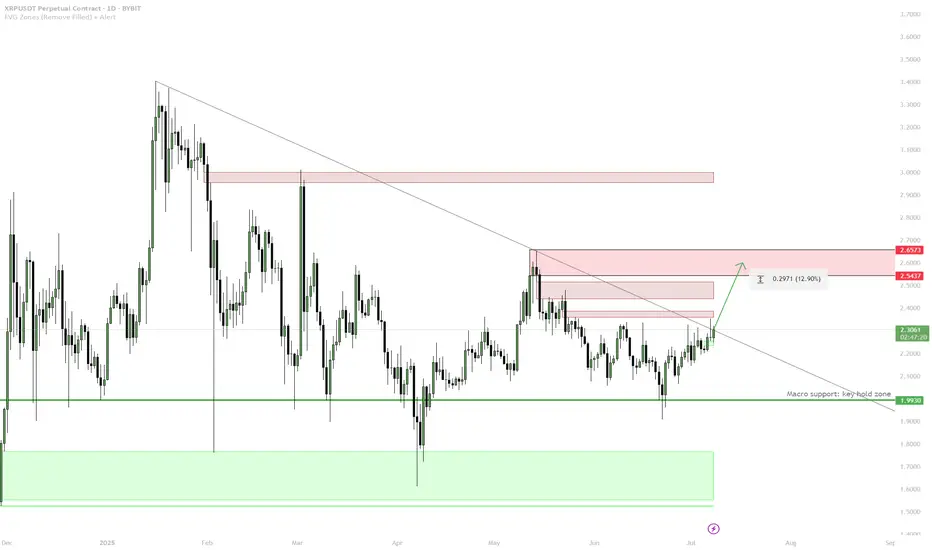
XRP — Macro Support Hold & Redbox Target1. Macro support (1.99) held — bullish bias
2. Enter on confirmed break and hold above trendline
3. TP1: 2.54–2.60 (first redbox)
4. TP2: 2.65+ (next supply)
5. Stop: Below macro support = invalid
After 45% Profit On Last Trade, I Am Re-entering UMACTrading Family,
On our stock trades, using my new liquidity indicator, we have been solidly beating the market with a cool 15% profit since our first trade with it. If you had held the SPY from the same time, your profit would have been a more meager 6.5%. Our indicator is proving beneficial, to say the least. And the last time it gave me a buy signal on UMAC, we banked 45% in profit on my last exit. I then determined that if it did not give me a sell signal (it hasn't), I would look to re-enter at that 7.66 level. We have reached that level, and I have dipped my toes back in at 7.94. I would look to double up my position if we drop even further to that 6.44 level, but I don't know that we will. My target of 11.76 will give us another 48% profit on this trade, and I have a SL set at 6.18 for a nice 2.17 rrr.
Let's go!
Stew

NZDUSD: Bulls Will Push Higher
The analysis of the NZDUSD chart clearly shows us that the pair is finally about to go up due to the rising pressure from the buyers.
Disclosure: I am part of Trade Nation's Influencer program and receive a monthly fee for using their TradingView charts in my analysis.
❤️ Please, support our work with like & comment! ❤️

Ethereum can make a small correction before it continues to growHello traders, I want share with you my opinion about Ethereum. After a long period of consolidation within a descending triangle, Ethereum broke out and started forming a steady upward channel. The impulse move from the buyer zone gave the market fresh bullish energy. We saw the price pushing through key resistance levels, showing strong momentum and confidence from buyers. Eventually, ETH reached a local peak and is now hovering just above the current support level at 2835. This area is crucial - it previously acted as resistance and has now turned into a support area, giving bulls a chance to regroup. Based on the structure, I expect a short-term correction toward the support area, followed by a continuation to the upside. The trend remains strong, and the impulse is not yet exhausted. That’s why I set my TP at 3240 points, which aligns with the upper expansion target based on previous movement. Given the breakout, strong uptrend, and support zone now being retested, I remain bullish and anticipate further growth from the current levels. Please share this idea with your friends and click Boost 🚀
Disclaimer: As part of ThinkMarkets’ Influencer Program, I am sponsored to share and publish their charts in my analysis.

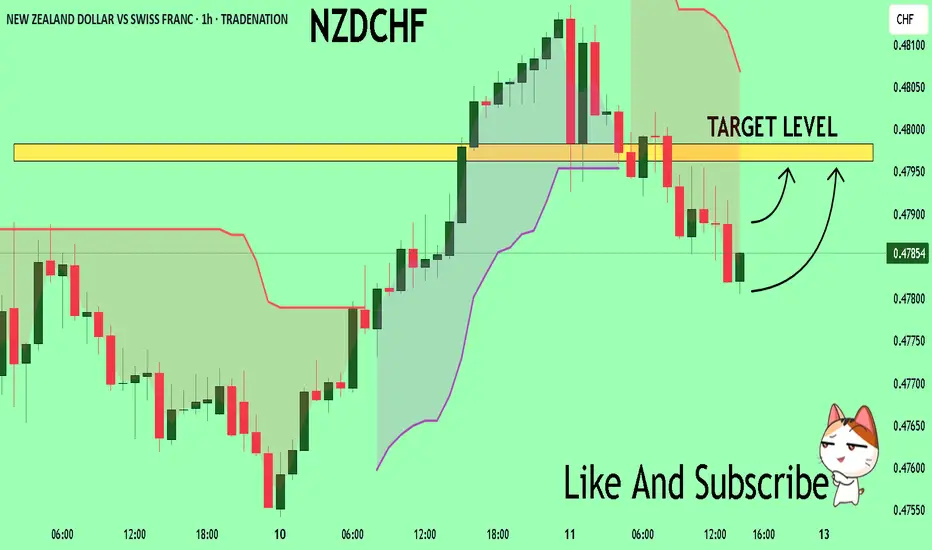
NZDCHF My Opinion! BUY!
My dear friends,
Please, find my technical outlook for NZDCHF below:
The instrument tests an important psychological level 0.4784
Bias - Bullish
Technical Indicators: Supper Trend gives a precise Bullish signal, while Pivot Point HL predicts price changes and potential reversals in the market.
Target - 0.4796
About Used Indicators:
Super-trend indicator is more useful in trending markets where there are clear uptrends and downtrends in price.
Disclosure: I am part of Trade Nation's Influencer program and receive a monthly fee for using their TradingView charts in my analysis.
———————————
WISH YOU ALL LUCK
EURO - Price will continue to grow inside rising channelHi guys, this is my overview for EURUSD, feel free to check it and write your feedback in comments👊
Recently, price entered to rising channel, where it soon reached the support level, which coincided with the support area.
After this movement, the price broke this level, but soon turned around and corrected the support line of the channel.
Next, EUR went back to $1.1365 level and broke it again, after which it made a retest and continued to move up.
In a short time, EUR rose to the resistance line of the channel, made a correction, and then grew to $1.1700 support level.
Price broke this level too and reached the resistance line of the channel, but not long ago corrected.
At the moment, I expect that the Euro can correct to the support line of the channel and then rise to $1.1900
If this post is useful to you, you can support me with like/boost and advice in comments❤️
Disclaimer: As part of ThinkMarkets’ Influencer Program, I am sponsored to share and publish their charts in my analysis.

THE LONG SHOT 〉POTENTIAL OUTLOOKAs illustrated, I'm trying to visualize how a potential continuation impulse could look like during " Bullish July " and toward the end of the year (depending on how aggressive buyers step in; specially central banks and institutions).
As you can see on this Daily chart, price respected a long term trend line + is forming higher lows, funneling into a shorter and shorter range of accumulation.
This is a very strong bullish behavior; when price gets tighter and tighter respecting a resistance level, but making higher lows. It tends to indicate that price is accumulating and "loading" (sort of speak).
Now, analyzing gold from the fundamental aspect, one MUST align those factors with price. In other words: DOES IT MAKE SENSE TO BE BULLISH OR "THINK" PRICE COULD RISE?
Well, ask yourself and do the research on the following (but not limited to) questions:
1. How is the US dollar doing? (Since it is the world's "reserve" currency)
2. Are the interest rates in the USA favoring the economy?
3. How is the world economy as a whole doing?
- inflation in the top world powers and important economies?
4. How is international trade policy looking like for the world?
- Positive or negative? Are countries happy with each other currently, trading without any issues? (Or maybe... there's a tariff war and a trade war goin on?...)
5. Politically speaking, is the general public UNITED or POLARIZED? (politics is a key fundamental aspect for the price of gold, as it either adds to uncertainty and tensions, or it calms things down).
6. Geopolitically speaking (and most importantly); is the "conflict" (war) ending, getting better, resolving? ...
7. Where is the money going and flowing? Black rock, vanguard, and other top hedge funds; where are they investing their money? ( because central banks keep BUYING gold... )
Those are some of many many questions one must study and understand, in order to align the technical aspects of the price of the yellow metal.
If any question/factor DOES NOT POINT to bullishness in price, then the technical and price projection of any analysis starts to have weakness.
On the other hand, if the fundamental factors and questions in play INDEED POINT toward an uncertain situation, adding bullishness to the price, any analysis and bullish projection simply has those aspects to its favor.
--
GOOD LUCK!
persaxu

EURUSD Will Go Up! Buy!
Here is our detailed technical review for EURUSD.
Time Frame: 6h
Current Trend: Bullish
Sentiment: Oversold (based on 7-period RSI)
Forecast: Bullish
The market is trading around a solid horizontal structure 1.169.
The above observations make me that the market will inevitably achieve 1.177 level.
P.S
The term oversold refers to a condition where an asset has traded lower in price and has the potential for a price bounce.
Overbought refers to market scenarios where the instrument is traded considerably higher than its fair value. Overvaluation is caused by market sentiments when there is positive news.
Disclosure: I am part of Trade Nation's Influencer program and receive a monthly fee for using their TradingView charts in my analysis.
Like and subscribe and comment my ideas if you enjoy them!

TOTAL Q3 As Q2 closes, Q3 begins...
The 2nd quarter of 2025 made up for a lot of the losses of Q1 peaking at $3.5T in the middle of the quarter. Since the peak a steady downtrend channel has formed and continues to be the case going into Q3.
What can we expect to see in the next 3 months in the crypto market? For me there are two different scenarios that are bullish, and one that is bearish IMO:
Bullish scenario 1 - The most likely scenario I think is a breakout above the downtrend channel and a move towards the range top. My reasoning for this comes from what we know about the driving forces in the market. Just last week BTC ETFs had a $2.2B net inflow, MSTR bought another 4,980BTC for $531.9m, various ETFs on the way for other majors such as SOL. Crucially the M2 money supply is at a record ATH. What that means is huge demand and the means to purchase with a what feels like a deadline closing in.
Bullish scenario 2 - We see a trend continuation until the range midpoint which has provided support before. It would coincide with the bottom of the trend channel and therefor I believe would provide a good launchpad for long positions.
Bearish scenario - For me this is the least likely situation but one that must be prepared for, a loss of the range midpoint would be a major setback, one that would mean a potential revisit of the range low in a symmetrical move down mirroring Q2s move up. The reason I believe this is the least likely is there is just too much in favor of risk on assets like crypto currently, I've mentioned the fuel that is the M2 money supply piling up to be deployed. A US interest rate cut all but confirmed for September and the institutional race for acquiring these assets before it is too late.
In conclusion just keeping it simple on the chart, a breakout above the trend channel is a great long opportunity to target the highs.
If BTC continues the grind down a great place for it to turn bullish is the range midpoint as has happened previously.
In the event BTC loses the midpoint a retest of the weekly low would make sense to me.

BTC — Harmonic Parabolic Scenario 1. Rise to 110–111k by July 4–5
2. Drop into July 9–10
3. Parabolic move after July 10
4. TP: ATH+
5. Stop: scenario invalid if no breakout

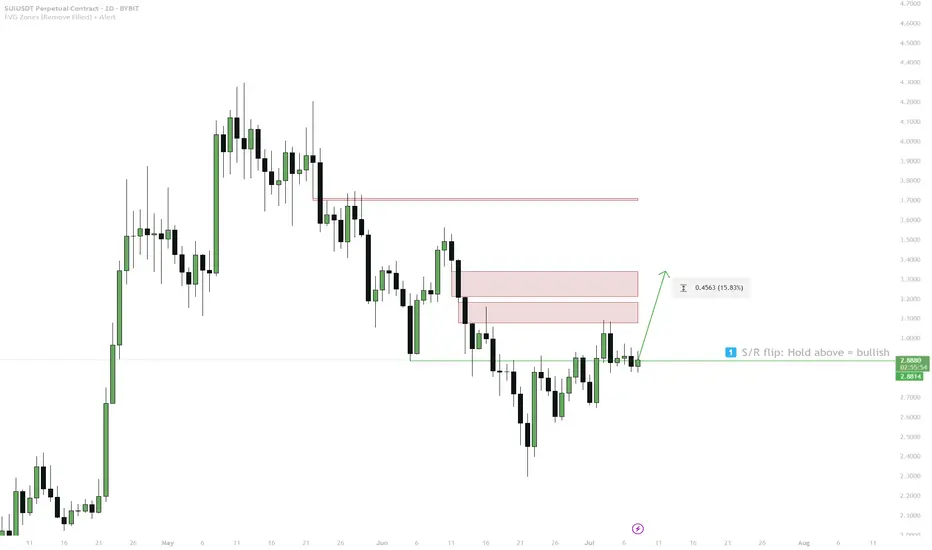
SUI — 1D S/R Flip & FVG Target1. Hold above 1D S/R + BOS (blue box) = bullish bias
2. Entry: Only long above blue box
3. Target: 3.32 (FVG)
4. Stop: Below blue box = invalid
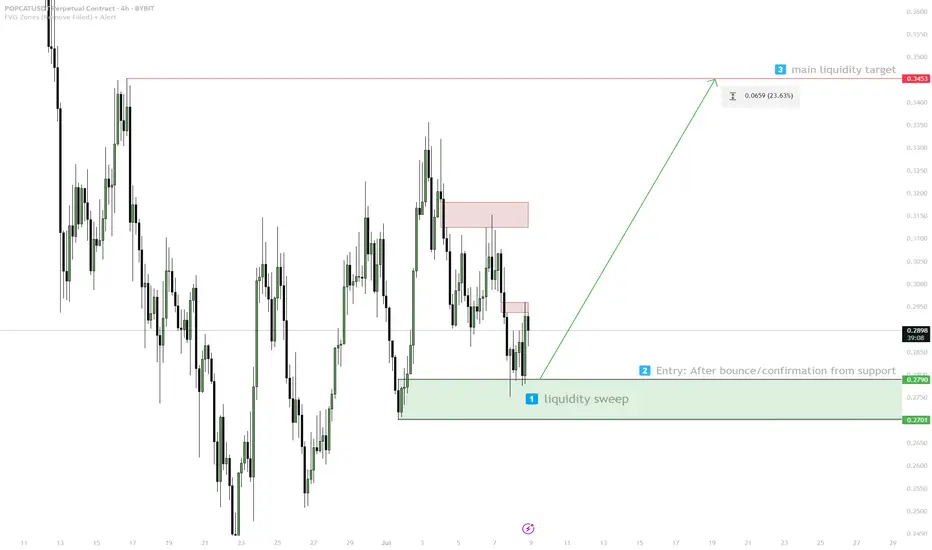
POPCAT — Liquidity Target Play1. Watch for sweep/liquidity grab in 0.270–0.279
2. Enter on confirmed bounce
3. Target: 0.3453 (liquidity zone)
4. Stop: below 0.270 — invalid
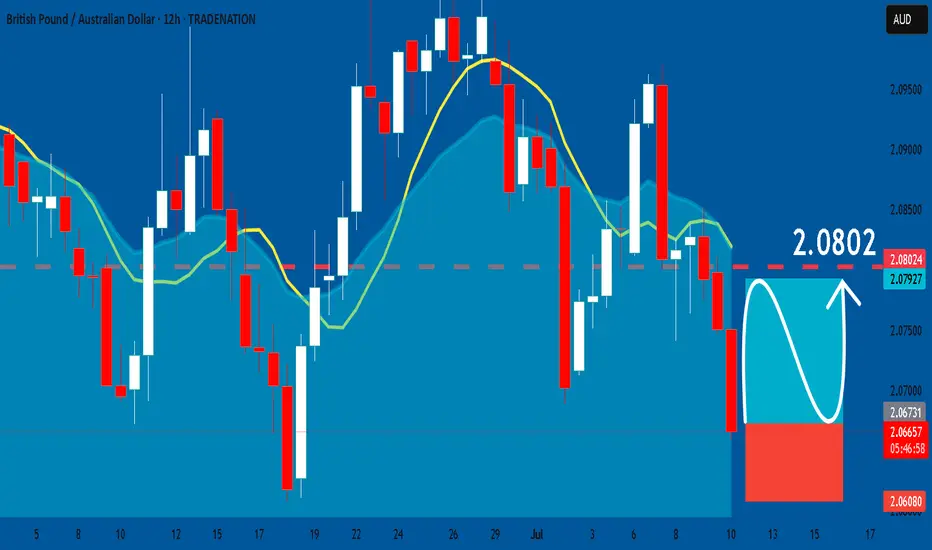
GBPAUD: Long Trade Explained
GBPAUD
- Classic bullish formation
- Our team expects growth
SUGGESTED TRADE:
Swing Trade
Buy GBPAUD
Entry Level - 2.0672
Sl - 2.0608
Tp - 2.0802
Our Risk - 1%
Start protection of your profits from lower levels
Disclosure: I am part of Trade Nation's Influencer program and receive a monthly fee for using their TradingView charts in my analysis.
❤️ Please, support our work with like & comment! ❤️
EURAUD Set To Grow! BUY!
My dear followers,
This is my opinion on the EURAUD next move:
The asset is approaching an important pivot point 1.7833
Bias - Bullish
Safe Stop Loss - 1.7781
Technical Indicators: Supper Trend generates a clear long signal while Pivot Point HL is currently determining the overall Bullish trend of the market.
Goal - 1.7932
About Used Indicators:
For more efficient signals, super-trend is used in combination with other indicators like Pivot Points.
Disclosure: I am part of Trade Nation's Influencer program and receive a monthly fee for using their TradingView charts in my analysis.
———————————
WISH YOU ALL LUCK

Bitcoin can rebound up from support line of upward wedgeHello traders, I want share with you my opinion about Bitcoin. In this chart, we can see how the price dropped from the 102800 support level, which coincided with the buyer zone, and later entered to wedge upward. In this pattern, price made an impulse up from the support line of the wedge pattern and broke the 102800 support level, after making a retest, and continued to move up. Bitcoin rose to the current support level, which coincided with a support area and even entered this area, but soon turned around and fell below. Next, price rose to this area again and then made a correction movement, after which it turned around and made an impulse up to the resistance line of the wedge, breaking the 108000 level. After this movement, the price bounced from this line and fell back to the current support level, where it some time traded in the support area. Later price rebounded and continued to move up. Now, I expect that BTC can correct to support line of the wedge and then rise to the resistance line of this pattern. That's why I set my TP at the 112600 points, which coincided with this line. Please share this idea with your friends and click Boost 🚀
Disclaimer: As part of ThinkMarkets’ Influencer Program, I am sponsored to share and publish their charts in my analysis.

GOLD: Long Trade with Entry/SL/TP
GOLD
- Classic bullish formation
- Our team expects pullback
SUGGESTED TRADE:
Swing Trade
Long GOLD
Entry - 3315.7
Sl - 3312.0
Tp - 3322.6
Our Risk - 1%
Start protection of your profits from lower levels
Disclosure: I am part of Trade Nation's Influencer program and receive a monthly fee for using their TradingView charts in my analysis.
❤️ Please, support our work with like & comment! ❤️

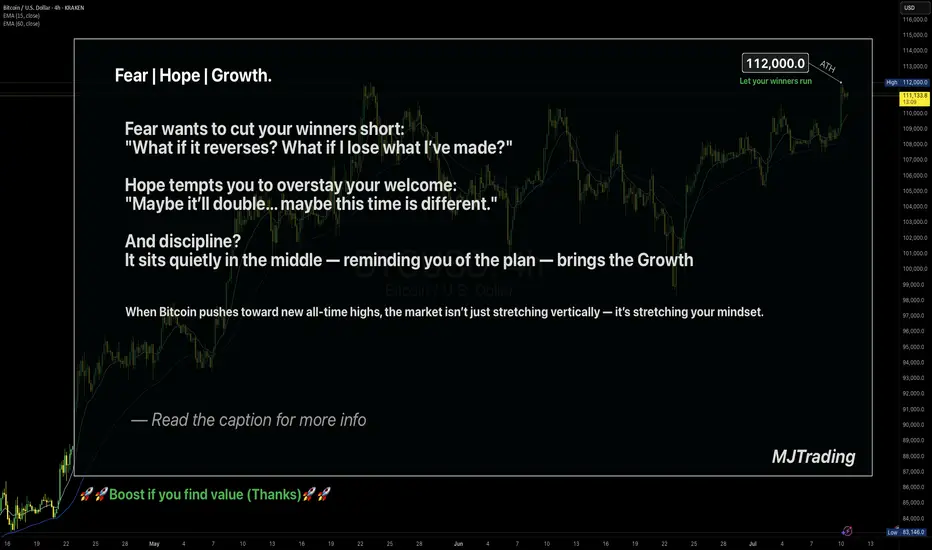
Let your winners run🧠 Fear | Hope | Growth – When Trading Meets Emotion
The message on the chart isn't just poetic — it's real psychology.
🔹 Fear wants to cut your winners short.
It sneaks in after a small move in your favor.
"What if it reverses? I better lock this in."
And just like that, a great trade turns into a missed opportunity.
🔹 Hope drags you into holding too long.
It dreams: "Maybe it doubles... maybe this time it'll be massive."
But it's not guided by data — it's driven by fantasy.
🔹 Discipline is what sits in the middle.
Quiet. Neutral.
It doesn’t scream or seduce — it just follows the plan.
And that’s where Growth lives — not just on the PnL, but in your psychology.
When Bitcoin pushes toward new ATHs, these emotions get amplified.
The real question becomes: Can you manage yourself, not just your trade?
📌 A Real Example from My Desk
In my earlier BTCUSD idea — “Another Edge – Decision Time” (shared above) —
I sent that setup to one of my managed clients.
He entered long exactly at the edge of the channel — a clean, strategic buy.
Price moved beautifully in our favor…
But he manually closed the trade at 106,600 — long before the move matured.
Why?
Because fear of giving back profit overwhelmed the original plan.
The chart was right. The timing was right.
But the exit was emotional, not tactical.
✅ The trade made money.
❌ But the lesson is clear: a profitable trade doesn’t always mean a disciplined one.
🎯 Final Takeaway:
“Fear kills your winners. Hope kills your timing. Discipline grows your equity and your character.”
🗣 What would you have done in that position?
Held longer? Closed at resistance? Let it run toward ATH?
Let’s talk psychology — drop your thoughts 👇
#MJTrading
#TradingPsychology #BTCUSD #FearHopeDiscipline #LetYourWinnersRun #PriceAction #BTCATH #ForexMindset #CryptoStrategy