gbpjpy long outlookif anyone see any different lmk what you see. whati am seeing based off weekly chart is price breaking ristance asreas and moving on up to another ristsance zone. what do you guys think
?
LONG

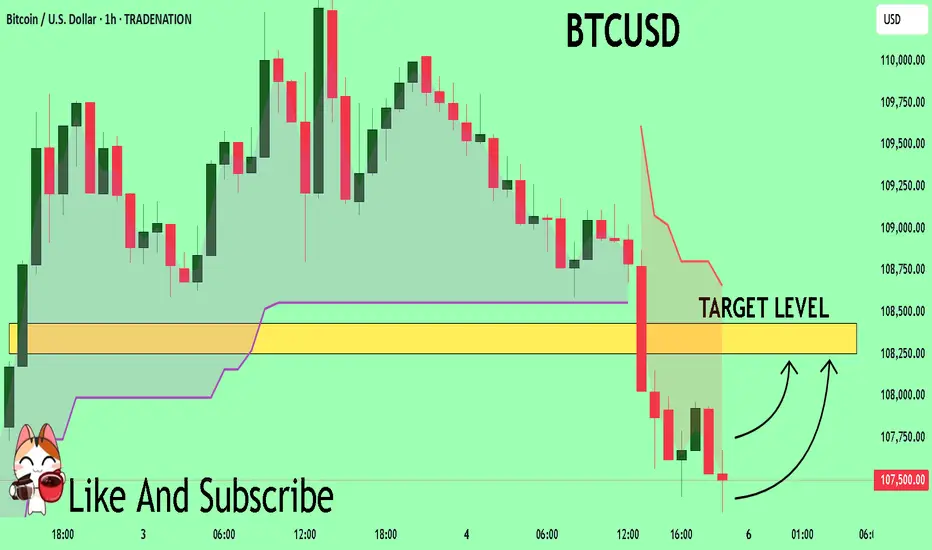
BTCUSD What Next? BUY!
My dear subscribers,
My technical analysis for BTCUSD is below:
The price is coiling around a solid key level - 10750
Bias - Bullish
Technical Indicators: Pivot Points Low anticipates a potential price reversal.
Super trend shows a clear buy, giving a perfect indicators' convergence.
Goal - 10825
About Used Indicators:
By the very nature of the supertrend indicator, it offers firm support and resistance levels for traders to enter and exit trades. Additionally, it also provides signals for setting stop losses
Disclosure: I am part of Trade Nation's Influencer program and receive a monthly fee for using their TradingView charts in my analysis.
———————————
WISH YOU ALL LUCK
EURUSD: Growth & Bullish Forecast
Balance of buyers and sellers on the EURUSD pair, that is best felt when all the timeframes are analyzed properly is shifting in favor of the buyers, therefore is it only natural that we go long on the pair.
Disclosure: I am part of Trade Nation's Influencer program and receive a monthly fee for using their TradingView charts in my analysis.
❤️ Please, support our work with like & comment! ❤️
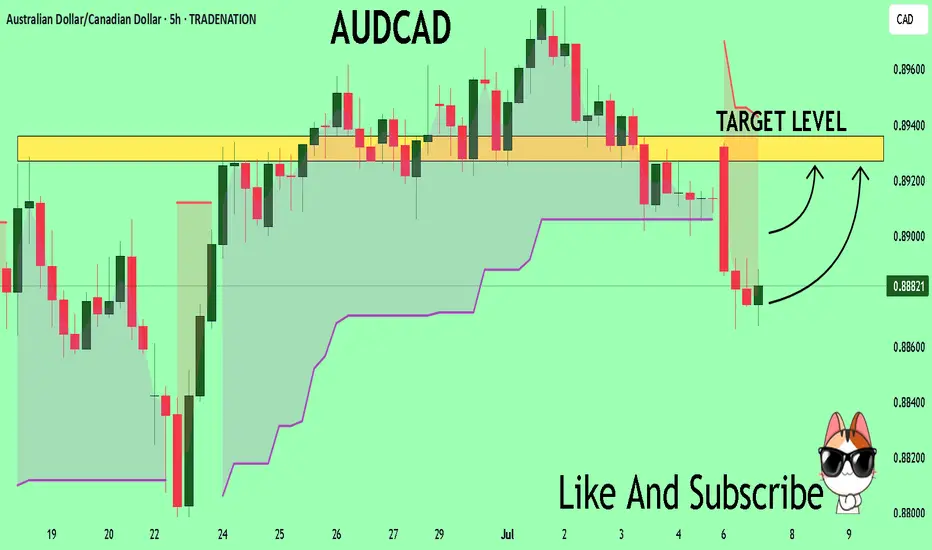
AUDCAD Trading Opportunity! BUY!
My dear subscribers,
AUDCAD looks like it will make a good move, and here are the details:
The market is trading on 0.8881 pivot level.
Bias - Bullish
Technical Indicators: Both Super Trend & Pivot HL indicate a highly probable Bullish continuation.
Target - 0.8927
About Used Indicators:
The average true range (ATR) plays an important role in 'Supertrend' as the indicator uses ATR to calculate its value. The ATR indicator signals the degree of price volatility.
Disclosure: I am part of Trade Nation's Influencer program and receive a monthly fee for using their TradingView charts in my analysis.
———————————
WISH YOU ALL LUCK
AUDUSD Potential UpsidesHey Traders, in today's trading session we are monitoring AUDUSD for a buying opportunity around 0.64600 zone, AUDUSD is trading in an uptrend and currently is in a correction phase in which it is approaching the trend at 0.64600 support and resistance area.
Trade safe, Joe.

EURUSD - Looking for the RTLooking for the RT on the upper supply zone, long term target for EURUSD is 1.200-1.2200. However, on RT we can potentially expect a larger pull back but will analyse PA.

NKE - Fallen-Angel reversal + weekly divergence - LongNKE - Nike from Smart Money divergent scanner back on the 15th of April. It's also a fallen angel pattern; it's rolled up beautifully and hitting its first target. Some small insider buying.

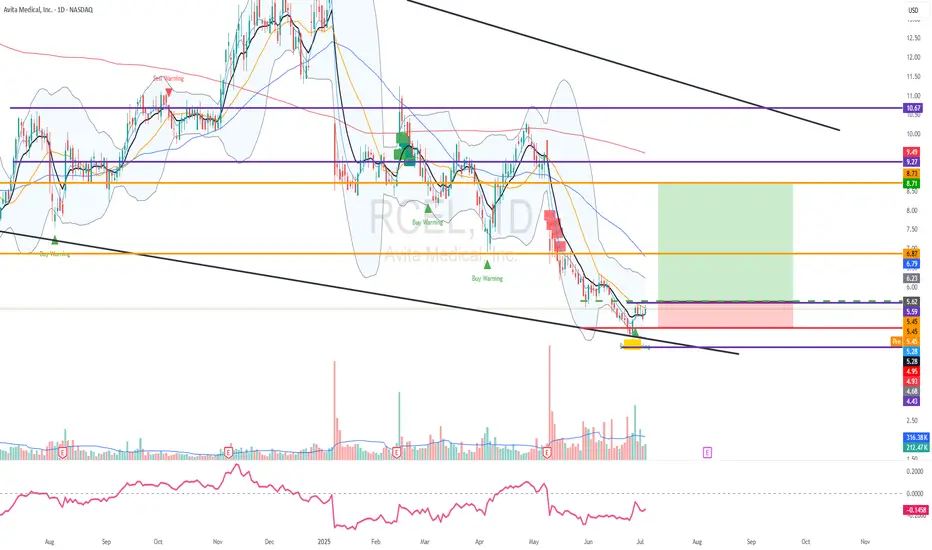
RCEL - Long-term falling wedge - Long setupWe've got smart money divergence on the smart money divergence scan on the 27th of June. If you look at the weekly chart, you'll see that there is a falling wedge pattern. And longer-term support that dates back eight years, and yes, that is still relevant. This is a speculative setup. Acorn likes this setup because of the long-term support. It has got some longer-term momentum potential. In the short term
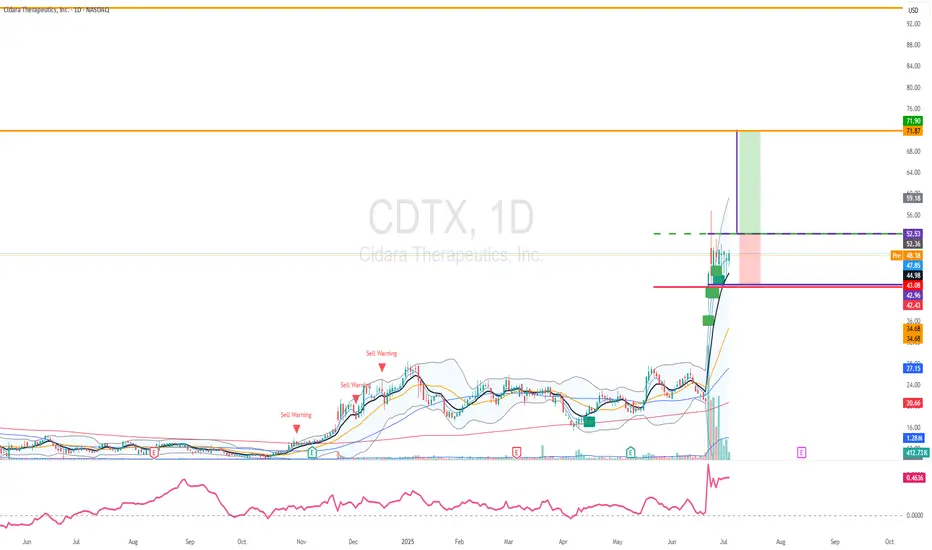
CDTX - Multi-day Smart Surge - Long setupCDTX is the next one. CDTX smart surge on the weekly for two weeks in a row! Smart surge on the daily five days in a row. This had some major smart surge back then when it started in April. This had some major buying, RA Capital Management purchased 100 million dollars worth, roughly, on June 26th, as reported. So we are looking for a break.
OLMA - Smart Surge + weekly divergence - Long setupOLMA - This is from the Smart Surge scan on Friday, the 27th of June. It was also from our smart money divergent scan on Friday, the 13th of June, where you can see it potentially bottomed there. And originally, I was also on a smart money divergent scan when it bottomed in April.

USDCHF Will Go Up From Support! Buy!
Take a look at our analysis for USDCHF.
Time Frame: 12h
Current Trend: Bullish
Sentiment: Oversold (based on 7-period RSI)
Forecast: Bullish
The market is on a crucial zone of demand 0.794.
The oversold market condition in a combination with key structure gives us a relatively strong bullish signal with goal 0.809 level.
P.S
The term oversold refers to a condition where an asset has traded lower in price and has the potential for a price bounce.
Overbought refers to market scenarios where the instrument is traded considerably higher than its fair value. Overvaluation is caused by market sentiments when there is positive news.
Disclosure: I am part of Trade Nation's Influencer program and receive a monthly fee for using their TradingView charts in my analysis.
Like and subscribe and comment my ideas if you enjoy them!

GBPNZD Will Go Up! Long!
Here is our detailed technical review for GBPNZD.
Time Frame: 9h
Current Trend: Bullish
Sentiment: Oversold (based on 7-period RSI)
Forecast: Bullish
The market is trading around a solid horizontal structure 2.264.
The above observations make me that the market will inevitably achieve 2.285 level.
P.S
Overbought describes a period of time where there has been a significant and consistent upward move in price over a period of time without much pullback.
Disclosure: I am part of Trade Nation's Influencer program and receive a monthly fee for using their TradingView charts in my analysis.
Like and subscribe and comment my ideas if you enjoy them!

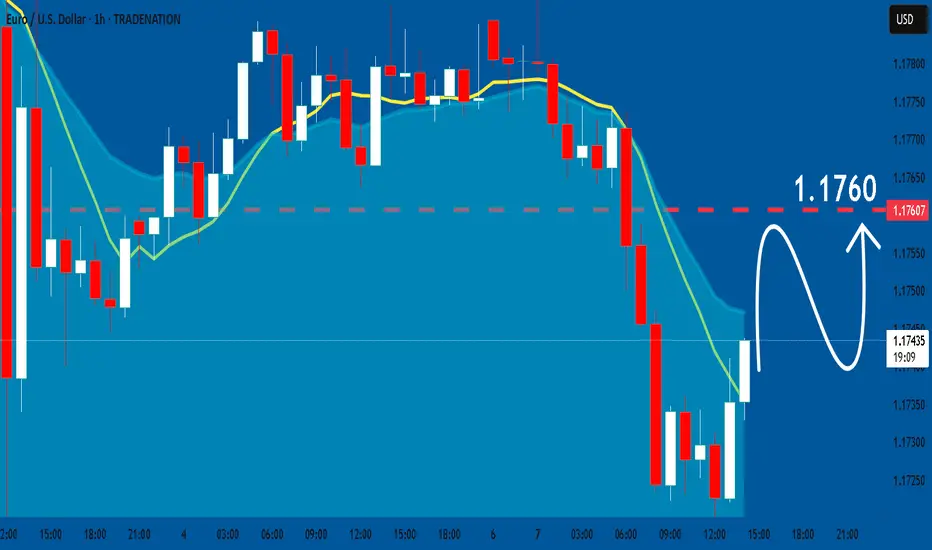
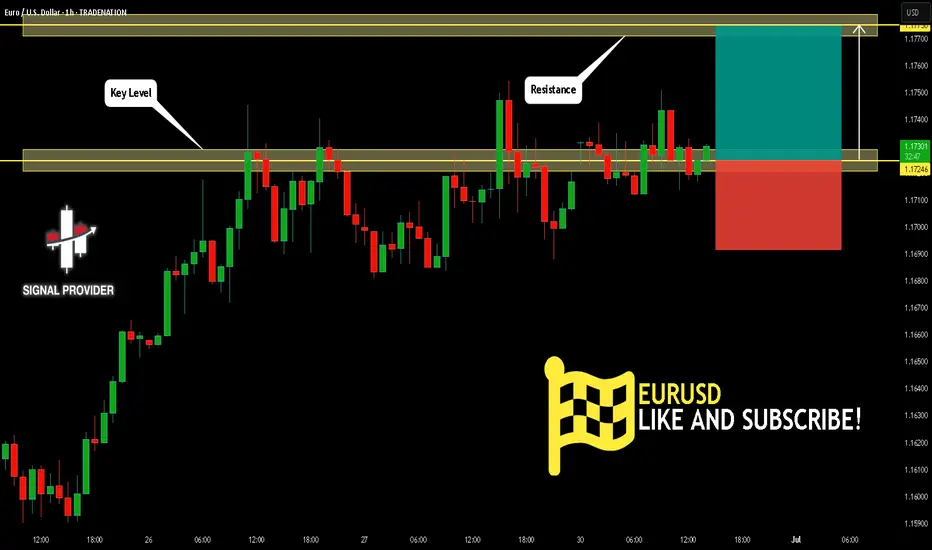
EURUSD Will Go Higher From Support! Long!
Take a look at our analysis for EURUSD.
Time Frame: 1h
Current Trend: Bullish
Sentiment: Oversold (based on 7-period RSI)
Forecast: Bullish
The market is on a crucial zone of demand 1.172.
The oversold market condition in a combination with key structure gives us a relatively strong bullish signal with goal 1.177 level.
P.S
We determine oversold/overbought condition with RSI indicator.
When it drops below 30 - the market is considered to be oversold.
When it bounces above 70 - the market is considered to be overbought.
Disclosure: I am part of Trade Nation's Influencer program and receive a monthly fee for using their TradingView charts in my analysis.
Like and subscribe and comment my ideas if you enjoy them!
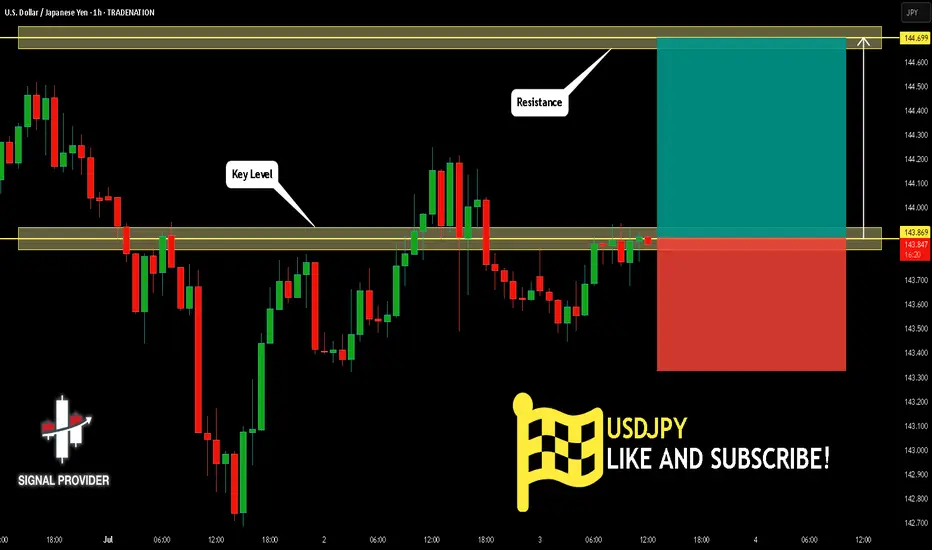
USDJPY Is Bullish! Buy!
Take a look at our analysis for USDJPY.
Time Frame: 1h
Current Trend: Bullish
Sentiment: Oversold (based on 7-period RSI)
Forecast: Bullish
The market is on a crucial zone of demand 143.869.
The oversold market condition in a combination with key structure gives us a relatively strong bullish signal with goal 144.699 level.
P.S
We determine oversold/overbought condition with RSI indicator.
When it drops below 30 - the market is considered to be oversold.
When it bounces above 70 - the market is considered to be overbought.
Disclosure: I am part of Trade Nation's Influencer program and receive a monthly fee for using their TradingView charts in my analysis.
Like and subscribe and comment my ideas if you enjoy them!
GOLD BEST PLACE TO BUY FROM|LONG
GOLD SIGNAL
Trade Direction: long
Entry Level: 3,312.57
Target Level: 3,353.45
Stop Loss: 3,285.24
RISK PROFILE
Risk level: medium
Suggested risk: 1%
Timeframe: 4h
Disclosure: I am part of Trade Nation's Influencer program and receive a monthly fee for using their TradingView charts in my analysis.
✅LIKE AND COMMENT MY IDEAS✅

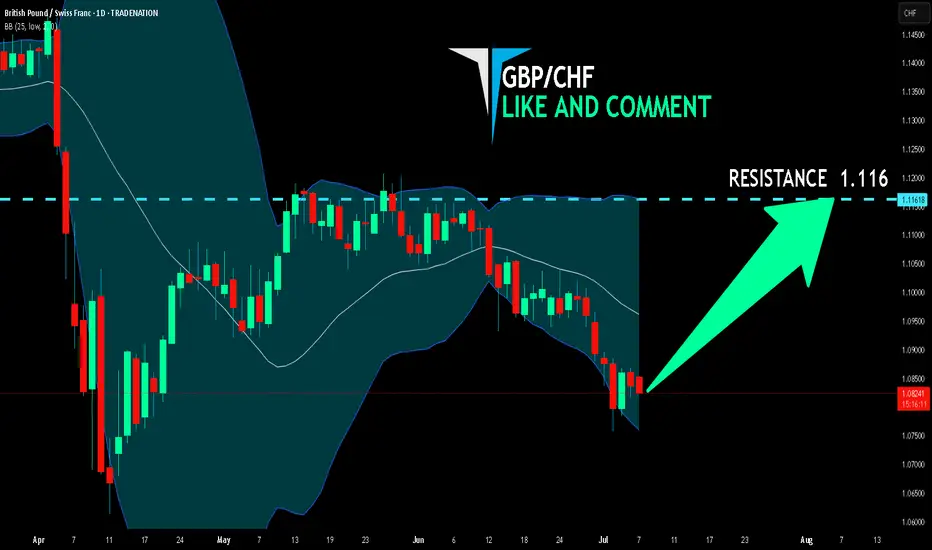
GBP/CHF LONG FROM SUPPORT
Hello, Friends!
GBP/CHF pair is in the downtrend because previous week’s candle is red, while the price is obviously falling on the 1D timeframe. And after the retest of the support line below I believe we will see a move up towards the target above at 1.116 because the pair oversold due to its proximity to the lower BB band and a bullish correction is likely.
Disclosure: I am part of Trade Nation's Influencer program and receive a monthly fee for using their TradingView charts in my analysis.
✅LIKE AND COMMENT MY IDEAS✅
EURO - Price can continue to grow inside rising channelHi guys, this is my overview for EURUSD, feel free to check it and write your feedback in comments👊
The price traded in a flat range between $1.1500 and $1.1750 for an extended period, testing both extremes multiple times with low volatility and indecision.
A breakout above $1.1750 initially looked promising but turned into a fakeout when sellers quickly pushed the price back below $1.1725, trapping aggressive longs.
After that shakeout, buyers regained control and propelled EUR into a rising channel, marked by higher highs and higher lows since the end of June.
Price has since respected the lower boundary of this rising channel near $1.1725–$1.1750, using it as reliable support for continued gains.
With two confirmed breakouts and the channel structure intact, bullish momentum suggests the pair can extend its move higher within the channel.
I expect Euro to continue climbing toward the next key resistance at $1.1980, where the upper channel line and structural supply zone converge.
If this post is useful to you, you can support me with like/boost and advice in comments❤️
Disclaimer: As part of ThinkMarkets’ Influencer Program, I am sponsored to share and publish their charts in my analysis.

HelenP I. Gold can correct to trend line and then bounce upHi folks today I'm prepared for you Gold analytics. If we look at the chart, we can see that gold has formed a broadening wedge pattern with several touches of the trend line, which acts as a dynamic support. After a strong drop, the price found support near the 3295 level and rebounded, forming a local upward movement. However, bulls have not yet shown a strong impulse, and the price is still trading below the resistance zone between 3390 and 3400 points. Currently, the price is hovering just above the trend line, and appears to be testing this support again. I expect a short decline, possibly to the area around 3295 - 3285 points - that’s the key support zone. If this area holds and we see a bounce, it will confirm that buyers are still active and ready to push the price up again. In this case, we could see gold continue moving inside the wedge pattern and aim for the upper resistance. My goal is set at the 3390 level, right near the wedge's upper border and strong resistance. This target matches the local highs from previous attempts, and if bulls gain momentum, they may try to break through this zone. But for now, I remain cautiously bullish and expect gold to bounce off the trend line and move upward toward the resistance. If you like my analytics you may support me with your like/comment.❤️
Disclaimer: As part of ThinkMarkets’ Influencer Program, I am sponsored to share and publish their charts in my analysis.

USOIL: Will Keep Growing! Here is Why:
The charts are full of distraction, disturbance and are a graveyard of fear and greed which shall not cloud our judgement on the current state of affairs in the USOIL pair price action which suggests a high likelihood of a coming move up.
Disclosure: I am part of Trade Nation's Influencer program and receive a monthly fee for using their TradingView charts in my analysis.
❤️ Please, support our work with like & comment! ❤️

US30 Will Move Higher! Buy!
Take a look at our analysis for US30.
Time Frame: 1h
Current Trend: Bullish
Sentiment: Oversold (based on 7-period RSI)
Forecast: Bullish
The market is testing a major horizontal structure 44,556.0.
Taking into consideration the structure & trend analysis, I believe that the market will reach 44,867.4 level soon.
P.S
Please, note that an oversold/overbought condition can last for a long time, and therefore being oversold/overbought doesn't mean a price rally will come soon, or at all.
Disclosure: I am part of Trade Nation's Influencer program and receive a monthly fee for using their TradingView charts in my analysis.
Like and subscribe and comment my ideas if you enjoy them!

EURNZD Is Bullish! Long!
Please, check our technical outlook for EURNZD.
Time Frame: 9h
Current Trend: Bullish
Sentiment: Oversold (based on 7-period RSI)
Forecast: Bullish
The market is approaching a key horizontal level 1.944.
Considering the today's price action, probabilities will be high to see a movement to 1.965.
P.S
The term oversold refers to a condition where an asset has traded lower in price and has the potential for a price bounce.
Overbought refers to market scenarios where the instrument is traded considerably higher than its fair value. Overvaluation is caused by market sentiments when there is positive news.
Disclosure: I am part of Trade Nation's Influencer program and receive a monthly fee for using their TradingView charts in my analysis.
Like and subscribe and comment my ideas if you enjoy them!

NG1! SENDS CLEAR BULLISH SIGNALS|LONG
NG1! SIGNAL
Trade Direction: long
Entry Level: 3.387
Target Level: 3.635
Stop Loss: 3.222
RISK PROFILE
Risk level: medium
Suggested risk: 1%
Timeframe: 9h
Disclosure: I am part of Trade Nation's Influencer program and receive a monthly fee for using their TradingView charts in my analysis.
✅LIKE AND COMMENT MY IDEAS✅

GBPUSD Sellers In Panic! BUY!
My dear friends,
Please, find my technical outlook for GBPUSD below:
The price is coiling around a solid key level - 1.3638
Bias - Bullish
Technical Indicators: Pivot Points Low anticipates a potential price reversal.
Super trend shows a clear buy, giving a perfect indicators' convergence.
Goal - 1.3653
About Used Indicators:
The pivot point itself is simply the average of the high, low and closing prices from the previous trading day.
Disclosure: I am part of Trade Nation's Influencer program and receive a monthly fee for using their TradingView charts in my analysis.
———————————
WISH YOU ALL LUCK
