HelenP. I Gold will make small correction and then continue growHi folks today I'm prepared for you Euro analytics. In this chart, we can see how the price declined to the 3245 support level, which coincided with the support zone, and then started to grow. In a short time, it reached the 3395 resistance level, which coincided with the resistance zone, and then dropped to the trend line, breaking two levels, and made a gap. After this movement, the price started to grow in a wedge and soon reached the support level, which broke it and continued to rise next. Later, it made a correction to the 3245 level and then continued to move up and reached the resistance level. Price bounced from this level and corrected, after which it turned around and rose to the resistance line of the wedge pattern, breaking the 3395 resistance level. But soon, it turned around and corrected to the trend line. Not a long time ago, price exited from the wedge, fell to the support level, and then started to grow. For this case, I expect that XAUUSD will make a small correction. Then I think it can continue to grow and reach the 3395 resistance level, which is my current goal. If you like my analytics you may support me with your like/comment.❤️
Disclaimer: As part of ThinkMarkets’ Influencer Program, I am sponsored to share and publish their charts in my analysis.
LONG

GOLD – Bullish Flag Breakout After Demand Zone Test
Price pulled back into the major demand zone (blue area), rejected with a strong wick, and formed a bullish flag structure. The breakout above the flag channel suggests continuation toward recent highs.
Trade Plan:
✅ Entry:
Above 3344 (breakout confirmation)
✅ Stop Loss:
Below 3332 (last swing low)
✅ Target:
3357–3360 (previous resistance zone)
Context:
• Demand zone respected
• EMA support aligning
• Clear breakout candle with volume
Risk Management:
Max risk per trade: 1%
Zoom in M5:
#Gold #XAUUSD #PriceAction #BreakoutTrading #MJTrading #ForexSignals #CommodityTrading

GBPUSD Will Go Up! Buy!
Take a look at our analysis for GBPUSD.
Time Frame: 8h
Current Trend: Bullish
Sentiment: Oversold (based on 7-period RSI)
Forecast: Bullish
The market is on a crucial zone of demand 1.370.
The oversold market condition in a combination with key structure gives us a relatively strong bullish signal with goal 1.378 level.
P.S
Please, note that an oversold/overbought condition can last for a long time, and therefore being oversold/overbought doesn't mean a price rally will come soon, or at all.
Disclosure: I am part of Trade Nation's Influencer program and receive a monthly fee for using their TradingView charts in my analysis.
Like and subscribe and comment my ideas if you enjoy them!

EURUSD Potential UpsidesHey Traders, in today's trading session we are monitoring EURUSD for a buying opportunity around 1.17600 zone, EURUSD is trading in an uptrend and currently is in a correction phase in which it is approaching the trend at 1.17600 support and resistance area.
Trade safe, Joe.

USDCAD Expected Growth! BUY!
My dear friends,
My technical analysis for USDCAD is below:
The market is trading on 1.3649 pivot level.
Bias - Bullish
Technical Indicators: Both Super Trend & Pivot HL indicate a highly probable Bullish continuation.
Target - 1.3697
Recommended Stop Loss - 1.3624
About Used Indicators:
A pivot point is a technical analysis indicator, or calculations, used to determine the overall trend of the market over different time frames.
Disclosure: I am part of Trade Nation's Influencer program and receive a monthly fee for using their TradingView charts in my analysis.
———————————
WISH YOU ALL LUCK

HelenP. I Bitcoin may continue grow and break resistance levelHi folks today I'm prepared for you Bitcoin analytics. After looking at this chart, we can see how the price broke the resistance level, which coincided with the resistance zone, and continued to move down next. When the price almost reached the support level, it turned around and tried to grow, but failed and dropped to the support zone. After this movement, BTC turned around and made an impulse up to the resistance zone, breaking the resistance level one more time. Then it reached the trend line and started to decline in a broadening wedge, where it broke the resistance level again. Later, the price even declined below the support level, breaking this level too and falling to the support line of the wedge pattern. Next, price turned around and made a strong impulse up to the resistance level, thereby breaking the support level with the trend line, exiting from the broadening wedge too. Bitcoin made a retest of the trend line and then continued to grow. In my opinion, BTCUSD will correct to almost to trend line and then rise to the resistance level. Then it can break this level and continue to move up; therefore, I set my goal at 111000 points. If you like my analytics you may support me with your like/comment ❤️
Disclaimer: As part of ThinkMarkets’ Influencer Program, I am sponsored to share and publish their charts in my analysis.

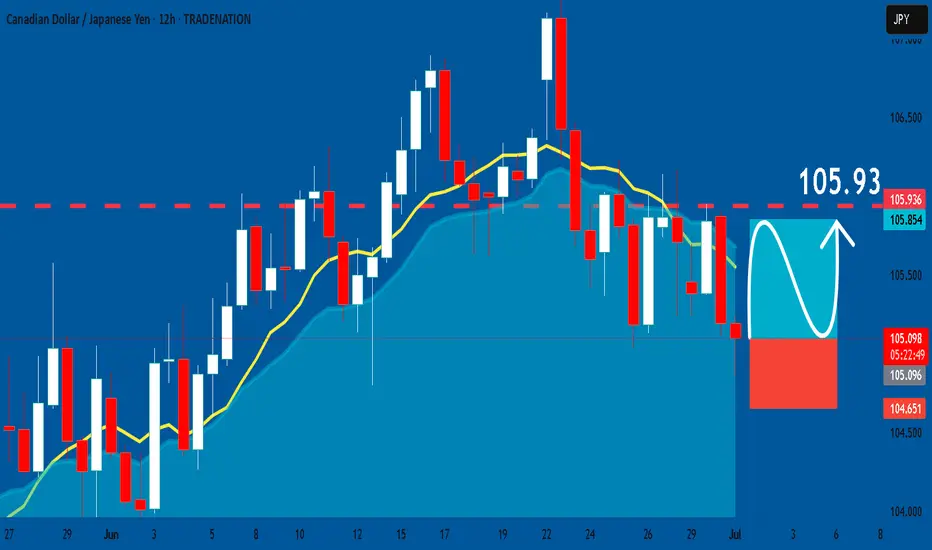
CADJPY: Bullish Continuation & Long Signal
CADJPY
- Classic bullish formation
- Our team expects pullback
SUGGESTED TRADE:
Swing Trade
Long CADJPY
Entry - 105.09
Sl - 104.65
Tp - 105.93
Our Risk - 1%
Start protection of your profits from lower levels
Disclosure: I am part of Trade Nation's Influencer program and receive a monthly fee for using their TradingView charts in my analysis.
❤️ Please, support our work with like & comment! ❤️
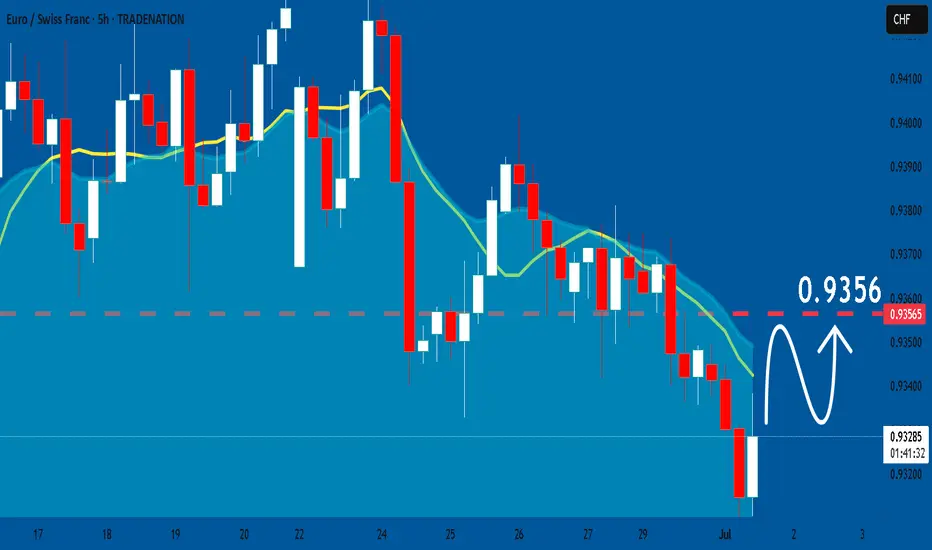
EURCHF: Bullish Continuation
Remember that we can not, and should not impose our will on the market but rather listen to its whims and make profit by following it. And thus shall be done today on the EURCHF pair which is likely to be pushed up by the bulls so we will buy!
Disclosure: I am part of Trade Nation's Influencer program and receive a monthly fee for using their TradingView charts in my analysis.
❤️ Please, support our work with like & comment! ❤️
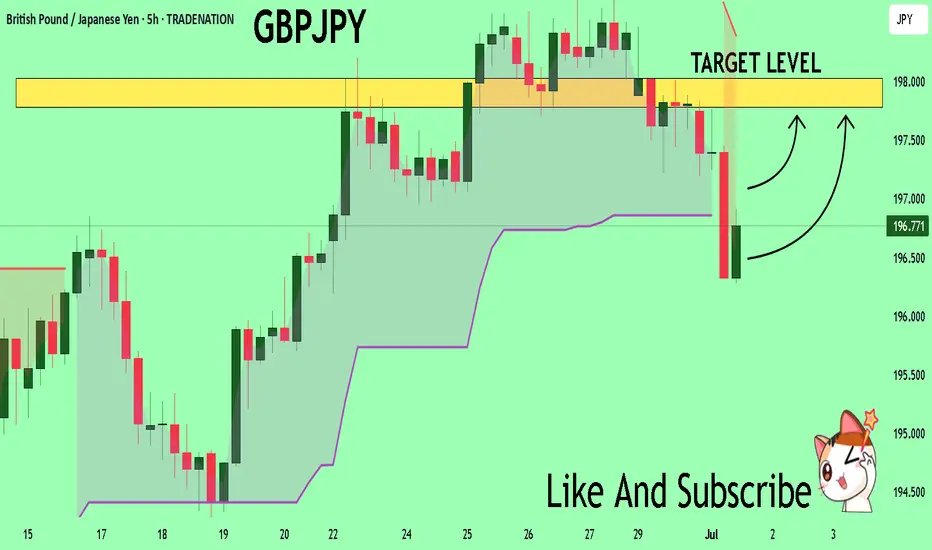
GBPJPY On The Rise! BUY!
My dear friends,
Please, find my technical outlook for GBPJPY below:
The instrument tests an important psychological level 196.72
Bias - Bullish
Technical Indicators: Supper Trend gives a precise Bullish signal, while Pivot Point HL predicts price changes and potential reversals in the market.
Target - 197.78
About Used Indicators:
Super-trend indicator is more useful in trending markets where there are clear uptrends and downtrends in price.
Disclosure: I am part of Trade Nation's Influencer program and receive a monthly fee for using their TradingView charts in my analysis.
———————————
WISH YOU ALL LUCK
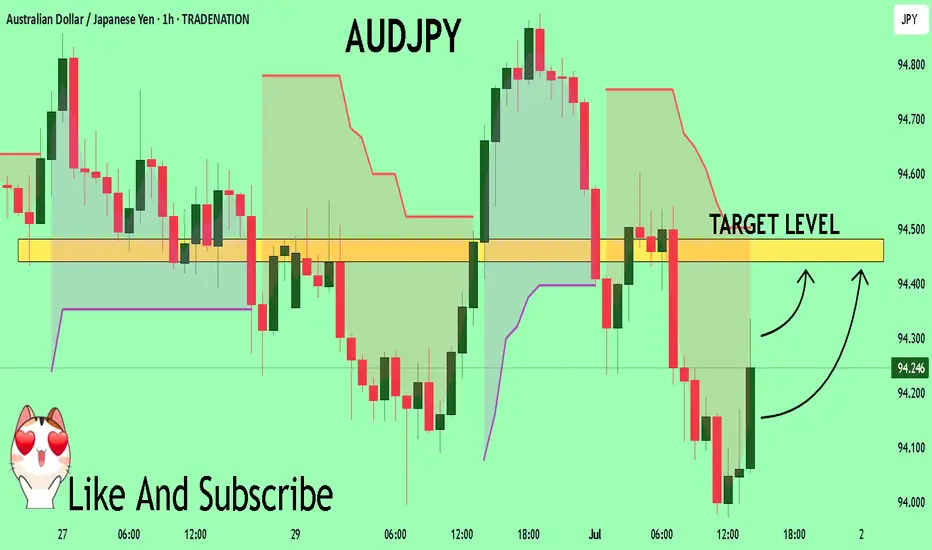
AUDJPY Trading Opportunity! BUY!
My dear subscribers,
My technical analysis for AUDJPY is below:
The price is coiling around a solid key level - 94.200
Bias - Bullish
Technical Indicators: Pivot Points Low anticipates a potential price reversal.
Super trend shows a clear buy, giving a perfect indicators' convergence.
Goal - 94.441
About Used Indicators:
By the very nature of the supertrend indicator, it offers firm support and resistance levels for traders to enter and exit trades. Additionally, it also provides signals for setting stop losses
Disclosure: I am part of Trade Nation's Influencer program and receive a monthly fee for using their TradingView charts in my analysis.
———————————
WISH YOU ALL LUCK
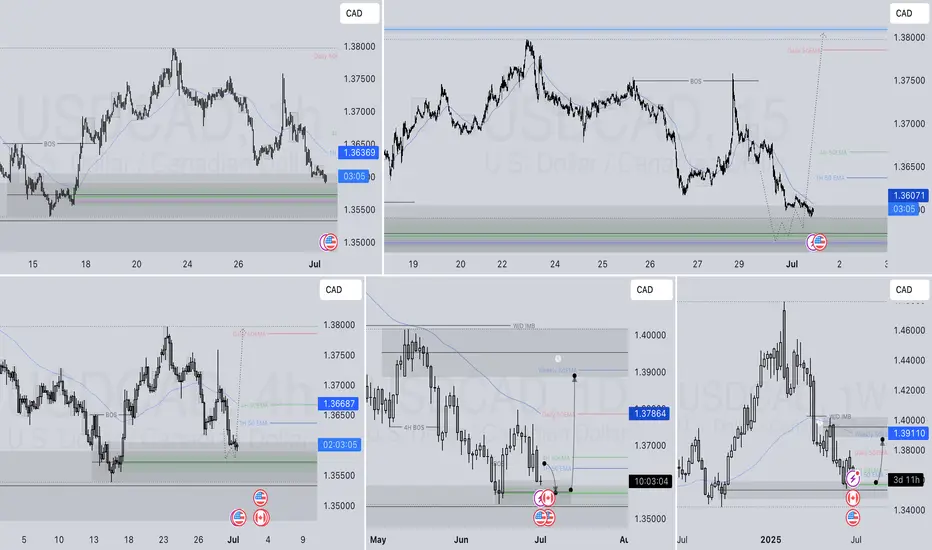
USDCAD LONG DAILY FORECAST Q3 D1 W27 Y25USDCAD LONG DAILY FORECAST Q3 D1 W27 Y25
IS USDCAD FINALLY READY TO LONG !
Professional Risk Managers👋
Welcome back to another FRGNT chart update📈
Diving into some Forex setups using predominantly higher time frame order blocks alongside confirmation breaks of structure.
Let’s see what price action is telling us today! 👀
💡Here are some trade confluences📝
✅Daily Order block identified
✅4H Order Block identified
✅1H Order Block identified
🔑 Remember, to participate in trading comes always with a degree of risk, therefore as professional risk managers it remains vital that we stick to our risk management plan as well as our trading strategies.
📈The rest, we leave to the balance of probabilities.
💡Fail to plan. Plan to fail.
🏆It has always been that simple.
❤️Good luck with your trading journey, I shall see you at the very top.
🎯Trade consistent, FRGNT X
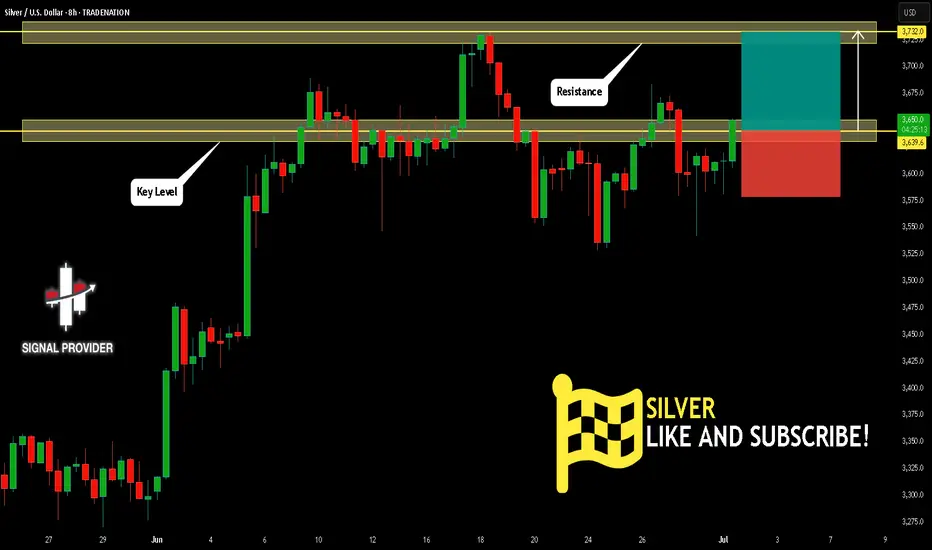
SILVER Will Move Higher! Long!
Please, check our technical outlook for SILVER.
Time Frame: 8h
Current Trend: Bullish
Sentiment: Oversold (based on 7-period RSI)
Forecast: Bullish
The price is testing a key support 3,639.6.
Current market trend & oversold RSI makes me think that buyers will push the price. I will anticipate a bullish movement at least to 3,732.0 level.
P.S
The term oversold refers to a condition where an asset has traded lower in price and has the potential for a price bounce.
Overbought refers to market scenarios where the instrument is traded considerably higher than its fair value. Overvaluation is caused by market sentiments when there is positive news.
Disclosure: I am part of Trade Nation's Influencer program and receive a monthly fee for using their TradingView charts in my analysis.
Like and subscribe and comment my ideas if you enjoy them!
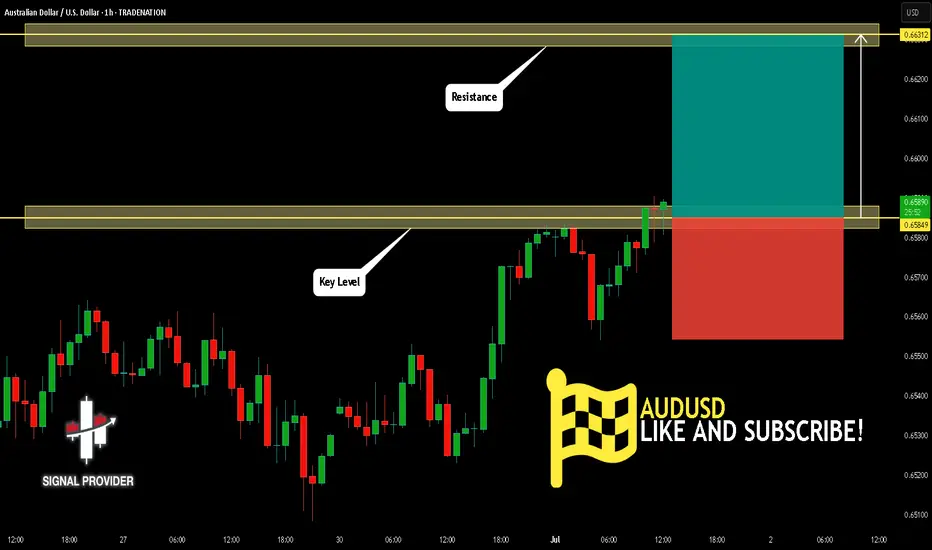
AUDUSD Is Bullish! Buy!
Here is our detailed technical review for AUDUSD.
Time Frame: 1h
Current Trend: Bullish
Sentiment: Oversold (based on 7-period RSI)
Forecast: Bullish
The market is trading around a solid horizontal structure 0.658.
The above observations make me that the market will inevitably achieve 0.663 level.
P.S
We determine oversold/overbought condition with RSI indicator.
When it drops below 30 - the market is considered to be oversold.
When it bounces above 70 - the market is considered to be overbought.
Disclosure: I am part of Trade Nation's Influencer program and receive a monthly fee for using their TradingView charts in my analysis.
Like and subscribe and comment my ideas if you enjoy them!
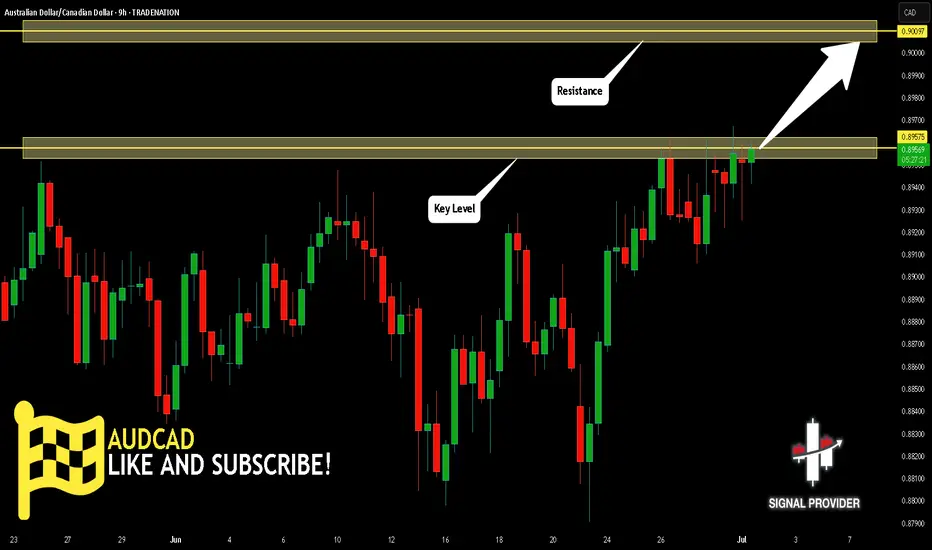
AUDCAD Is Going Up! Long!
Please, check our technical outlook for AUDCAD.
Time Frame: 9h
Current Trend: Bullish
Sentiment: Oversold (based on 7-period RSI)
Forecast: Bullish
The market is approaching a key horizontal level 0.895.
Considering the today's price action, probabilities will be high to see a movement to 0.900.
P.S
Please, note that an oversold/overbought condition can last for a long time, and therefore being oversold/overbought doesn't mean a price rally will come soon, or at all.
Disclosure: I am part of Trade Nation's Influencer program and receive a monthly fee for using their TradingView charts in my analysis.
Like and subscribe and comment my ideas if you enjoy them!
GBP/NZD BEST PLACE TO BUY FROM|LONG
Hello, Friends!
Bullish trend on GBP/NZD, defined by the green colour of the last week candle combined with the fact the pair is oversold based on the BB lower band proximity, makes me expect a bullish rebound from the support line below and a retest of the local target above at 2.267.
Disclosure: I am part of Trade Nation's Influencer program and receive a monthly fee for using their TradingView charts in my analysis.
✅LIKE AND COMMENT MY IDEAS✅

FARTCOIN — Perfect Swing Long Up 27%, Dips Are for BuyingDips into $1.06–1.09 (1H FVG + BOS) are for buying.
Still bullish while above $0.92–0.93 OB. Eyeing $1.43 next.

CHILLGUY Breaking Out — Rotating Gains Into Next Meme Runner🎯 Trading Plan:
Watch for a sweep into the red box and LTF reclaim for spot entry
Targets: $0.117 (yearly high), then $0.129–$0.158 if strong momentum
Manual invalidation: 1D close below red box
🚨 Risk Warning:
No spot entry unless sweep/reclaim at supply zone
Exit if 1D candle closes below supply zone

TOSHI — Watching for Bullish Breakout Above Daily Supply🎯 Trading Plan:
Wait for breakout and daily close above $0.48–0.50 supply zone
Spot long trigger only after confirmed flip
Stay sidelined below supply — no forced trades
🚨 Risk Warning:
No bullish confirmation unless above supply
Protect capital — no entries on hope

BTC — ATH or Lower High? Patience for the Next SwingBINANCE:BTCUSDT | 4h
Patience here — waiting for the next high-probability swing.
Major levels to watch: $111,990 (range high), $108,950 (weekly), $100,300–103,000 (demand).
Next move: ATH attempt or another lower high? Will act when the reaction sets up.

DXY USD Dollar Bearish Short term, then bullishI am not a financial advisor. This is not meant to be and does not constitute financial, investment, trading, or any other types of advice or recommendation.

AUDJPY – Trade the Range… Until It EndsHello TradingView Family / Fellow Traders. This is Richard, also known as theSignalyst.
📈AUDJPY has been trading within a big range marked in red.
Moreover, the it is retesting the lower bound of its rising channel marked in blue.
🏹 Thus, the highlighted blue circle is a strong area to look for buy setups as it is the intersection of support and lower blue trendline acting as a non-horizontal support.
📚 As per my trading style:
As #AUDJPY approaches the blue circle zone, I will be looking for bullish reversal setups (like a double bottom pattern, trendline break , and so on...)
📚 Always follow your trading plan regarding entry, risk management, and trade management.
Good luck!
All Strategies Are Good; If Managed Properly!
~Rich
Disclosure: I am part of Trade Nation's Influencer program and receive a monthly fee for using their TradingView charts in my analysis.

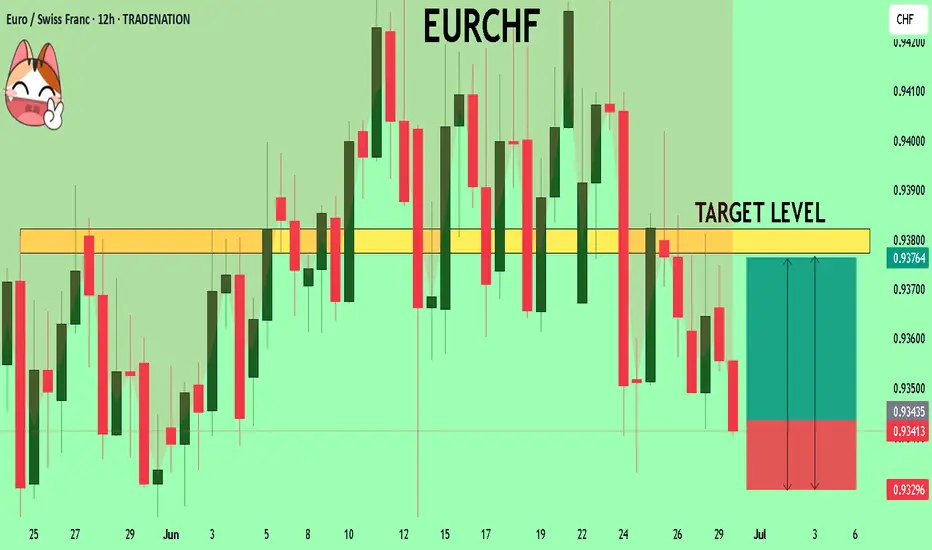
EURCHF What Next? BUY!
My dear friends,
Please, find my technical outlook for EURCHF below:
The instrument tests an important psychological level 0.9343
Bias - Bullish
Technical Indicators: Supper Trend gives a precise Bullish signal, while Pivot Point HL predicts price changes and potential reversals in the market.
Target - 0.9377
Recommended Stop Loss - 0.9329
About Used Indicators:
Super-trend indicator is more useful in trending markets where there are clear uptrends and downtrends in price.
Disclosure: I am part of Trade Nation's Influencer program and receive a monthly fee for using their TradingView charts in my analysis.
———————————
WISH YOU ALL LUCK
GOLD - Price can grow to resistance line of wedge patternHi guys, this is my overview for XAUUSD, feel free to check it and write your feedback in comments👊
Some time ago price bounced from $3390 level and declined, but soon turned back and even entered to resistance area.
After this, the price dropped from this area and then started to grow inside the wedge, where it at once made an impulse up.
Price reached $3390 level one more time and broke it, after which it continued to grow to the resistance line of the wedge.
When it reached this line, price turned around and in a short time declined below $3390 level, breaking and then made a retest.
Later, Gold broke $3300 level and fell to the support line of the wedge, after which it rose to the resistance area.
Now I expect that Gold can make a correction to almost support line and then bounce up to $3320 resistance line of the wedge.
If this post is useful to you, you can support me with like/boost and advice in comments❤️
Disclaimer: As part of ThinkMarkets’ Influencer Program, I am sponsored to share and publish their charts in my analysis.
