USOIL: Long Trading Opportunity
USOIL
- Classic bullish pattern
- Our team expects retracement
SUGGESTED TRADE:
Swing Trade
Buy USOIL
Entry - 65.03
Stop - 62.60
Take - 69.73
Our Risk - 1%
Start protection of your profits from lower levels
Disclosure: I am part of Trade Nation's Influencer program and receive a monthly fee for using their TradingView charts in my analysis.
❤️ Please, support our work with like & comment! ❤️
LONG

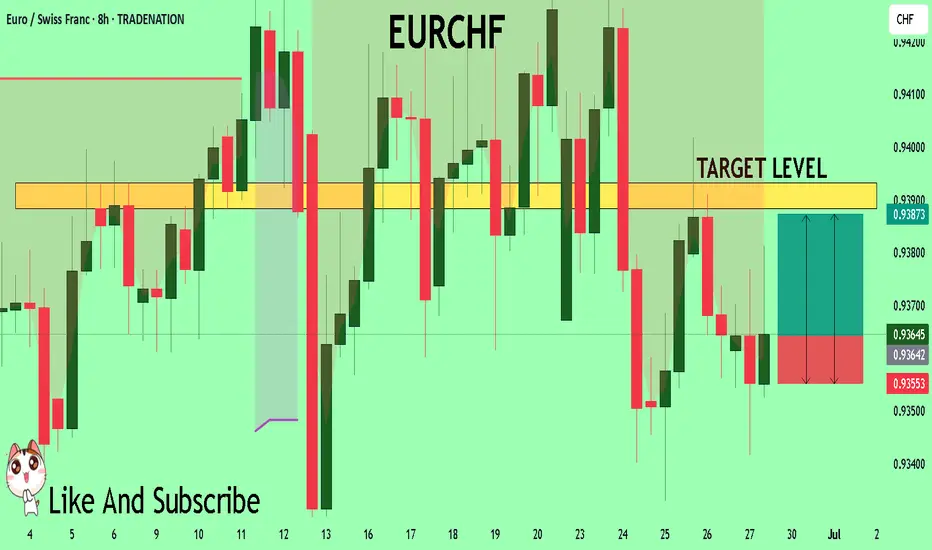
EURCHF Massive Long! BUY!
My dear friends,
Please, find my technical outlook for EURCHF below:
The price is coiling around a solid key level - 0.9364
Bias - Bullish
Technical Indicators: Pivot Points Low anticipates a potential price reversal.
Super trend shows a clear buy, giving a perfect indicators' convergence.
Goal - 0.9388
Safe Stop Loss - 0.9355
About Used Indicators:
The pivot point itself is simply the average of the high, low and closing prices from the previous trading day.
Disclosure: I am part of Trade Nation's Influencer program and receive a monthly fee for using their TradingView charts in my analysis.
———————————
WISH YOU ALL LUCK
SILVER: Bulls Will Push
The price of SILVER will most likely increase soon enough, due to the demand beginning to exceed supply which we can see by looking at the chart of the pair.
Disclosure: I am part of Trade Nation's Influencer program and receive a monthly fee for using their TradingView charts in my analysis.
❤️ Please, support our work with like & comment! ❤️

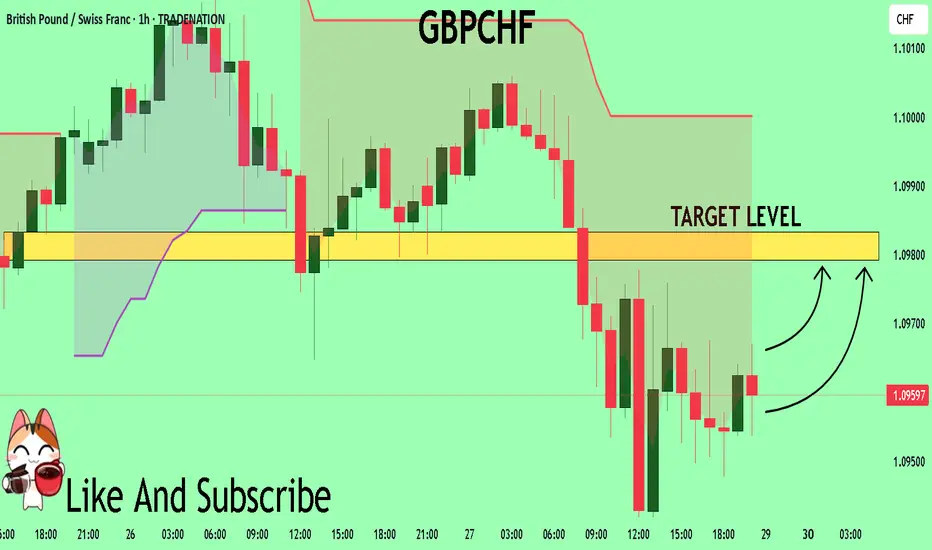
GBPCHF Technical Analysis! BUY!
My dear subscribers,
GBPCHF looks like it will make a good move, and here are the details:
The market is trading on 1.0959 pivot level.
Bias - Bullish
Technical Indicators: Both Super Trend & Pivot HL indicate a highly probable Bullish continuation.
Target - 1.0979
About Used Indicators:
The average true range (ATR) plays an important role in 'Supertrend' as the indicator uses ATR to calculate its value. The ATR indicator signals the degree of price volatility.
Disclosure: I am part of Trade Nation's Influencer program and receive a monthly fee for using their TradingView charts in my analysis.
———————————
WISH YOU ALL LUCK
GBPJPY Potential UpsidesHey Traders, in the coming week we are monitoring GBPJPY for a buying opportunity around 198.100 zone, GBPJPY is trading in an uptrend and currently is in a correction phase in which it is approaching the trend at 198.100 support and resistance area.
Trade safe, Joe.

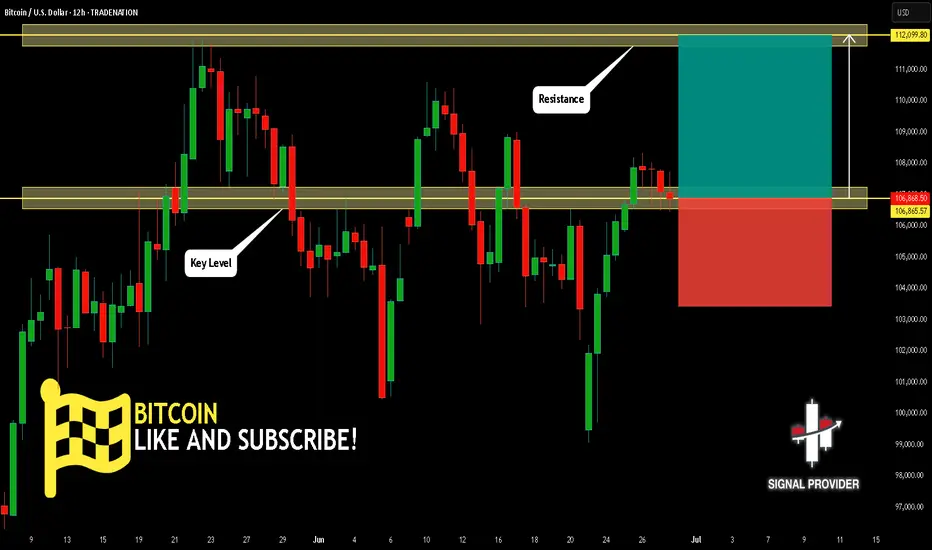
BITCOIN Is Bullish! Buy!
Here is our detailed technical review for BITCOIN.
Time Frame: 12h
Current Trend: Bullish
Sentiment: Oversold (based on 7-period RSI)
Forecast: Bullish
The market is approaching a significant support area 106,865.57.
The underlined horizontal cluster clearly indicates a highly probable bullish movement with target 112,099.80 level.
P.S
Overbought describes a period of time where there has been a significant and consistent upward move in price over a period of time without much pullback.
Disclosure: I am part of Trade Nation's Influencer program and receive a monthly fee for using their TradingView charts in my analysis.
Like and subscribe and comment my ideas if you enjoy them!
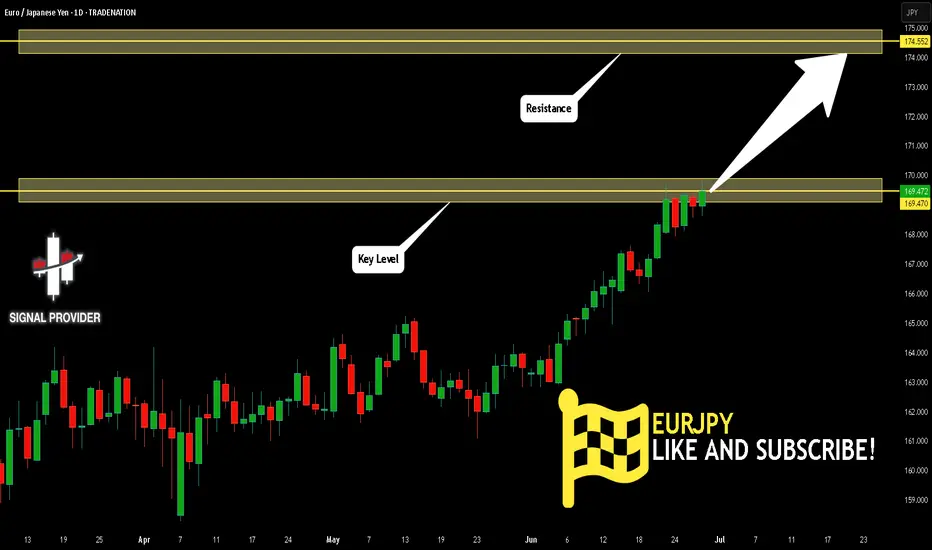
EURJPY Is Very Bullish! Long!
Take a look at our analysis for EURJPY.
Time Frame: 1D
Current Trend: Bullish
Sentiment: Oversold (based on 7-period RSI)
Forecast: Bullish
The market is on a crucial zone of demand 169.470.
The oversold market condition in a combination with key structure gives us a relatively strong bullish signal with goal 174.552 level.
P.S
Please, note that an oversold/overbought condition can last for a long time, and therefore being oversold/overbought doesn't mean a price rally will come soon, or at all.
Disclosure: I am part of Trade Nation's Influencer program and receive a monthly fee for using their TradingView charts in my analysis.
Like and subscribe and comment my ideas if you enjoy them!
GBPCHF Is Going Up! Buy!
Please, check our technical outlook for GBPCHF.
Time Frame: 2h
Current Trend: Bullish
Sentiment: Oversold (based on 7-period RSI)
Forecast: Bullish
The price is testing a key support 1.095.
Current market trend & oversold RSI makes me think that buyers will push the price. I will anticipate a bullish movement at least to 1.098 level.
P.S
The term oversold refers to a condition where an asset has traded lower in price and has the potential for a price bounce.
Overbought refers to market scenarios where the instrument is traded considerably higher than its fair value. Overvaluation is caused by market sentiments when there is positive news.
Disclosure: I am part of Trade Nation's Influencer program and receive a monthly fee for using their TradingView charts in my analysis.
Like and subscribe and comment my ideas if you enjoy them!

SUI | — Key Buy Trigger AheadPrice is drifting lower and approaching a high-confluence retracement zone. A key bullish setup may form if price sweeps the 0.618–0.666 Fibonacci region and reclaims the level with strength.
📌 Buy Trigger:
• Sweep into the $2.38–2.5 zone
• Look for reclaim and bullish reversal for long entry
• Structure remains constructive while above monthly support ($1.91)
📈 Reclaim Level for Strength:
• $2.83 — clearing this confirms bullish intent
• Flip = strength toward $3.80 and beyond
🎯 Targets:
• $2.83 → Range reclaim level
• $3.50–3.60 → local resistance
• $5.36–5.37 → full upside liquidity target
🟥 Invalidation:
• Clean break below $1.90 (monthly support) = full invalidation
📌 Best setups form when liquidity is swept and price reclaims structure. Wait for the flush and follow strength.

AUDUSD Potential UpsidesHey Traders, in today's trading session we are monitoring AUDUSD for a buying opportunity around 0.65300 zone, AUDUSD is trading in an uptrend and currently is in a correction phase in which it is approaching the trend at 0.65300 support and resistance area.
Trade safe, Joe.

AUDNZD On The Rise! BUY!
My dear followers,
This is my opinion on the AUDNZD next move:
The asset is approaching an important pivot point 1.0782
Bias - Bullish
Technical Indicators: Supper Trend generates a clear long signal while Pivot Point HL is currently determining the overall Bullish trend of the market.
Goal - 1.0797
About Used Indicators:
For more efficient signals, super-trend is used in combination with other indicators like Pivot Points.
Disclosure: I am part of Trade Nation's Influencer program and receive a monthly fee for using their TradingView charts in my analysis.
———————————
WISH YOU ALL LUCK

ARTY - Play-and-Earn Launch Poised to Ignite Rally Toward $1.80Hi guys, this is my overview for ARTYUSDT, feel free to check it and write your feedback in comments👊
After consolidating in a flat range between $0.36 and $0.74 for months, ARTY triggered a bullish breakout, climbing rapidly toward $1.83.
Following this surge, price corrected back to the $0.27–$0.36 support area, which absorbed selling pressure and formed a reliable accumulation base.
On June 30th, Artyfact will launch its inaugural Play-and-Earn mode, poised to attract hundreds of thousands of new users and significantly boost ARTY demand.
This upcoming catalyst underpins the bull case, reinforcing buyers’ confidence and justifying another leg higher from current levels near $1.62.
Key downside support remains at $1.00–$1.08, where any retracements could offer favorable long entries ahead of resumed uptrend momentum.
My three upside targets are $1.00 for the first level, $1.40 as intermediate resistance, and $1.80 near the previous all-time high.
If this post is useful to you, you can support me with like/boost and advice in comments❤️

GOLD Trading Opportunity! BUY!
My dear subscribers,
GOLD looks like it will make a good move, and here are the details:
The market is trading on 3270.6 pivot level.
Bias - Bullish
My Stop Loss - 3260.7
Technical Indicators: Both Super Trend & Pivot HL indicate a highly probable Bullish continuation.
Target - 3289.4
About Used Indicators:
The average true range (ATR) plays an important role in 'Supertrend' as the indicator uses ATR to calculate its value. The ATR indicator signals the degree of price volatility.
Disclosure: I am part of Trade Nation's Influencer program and receive a monthly fee for using their TradingView charts in my analysis.
———————————
WISH YOU ALL LUCK

HelenP. I Gold will rebound up from trend line to $3400 levelHi folks today I'm prepared for you Gold analytics. After looking at this chart, we can see how the price after a prolonged consolidation inside a large wedge pattern, XAUUSD, approached the ascending trend line again - this line has acted as a key support several times in the past. This time is no exception: the price reacted to it with a bullish bounce. We can see a confluence here — trend line support coincides with the lower boundary of the wedge and the local support zone at 3270 - 3250 points. Now the price is trading above this line, showing early signs of recovery. Given the symmetry of this structure and past behavior, I expect gold to continue rising from current levels. The nearest major obstacle lies in the resistance zone around 3400 - 3420, which acted as a turning point before. That’s why my current goal is set at the 3400 level. If bulls hold the trend line, we may see a steady move toward this key resistance. Given the trend line reaction, wedge structure, and current momentum, I remain bullish and expect further growth. If you like my analytics you may support me with your like/comment ❤️
Disclaimer: As part of ThinkMarkets’ Influencer Program, I am sponsored to share and publish their charts in my analysis.

GOLD Will Grow! Long!
Here is our detailed technical review for GOLD.
Time Frame: 1h
Current Trend: Bullish
Sentiment: Oversold (based on 7-period RSI)
Forecast: Bullish
The market is trading around a solid horizontal structure 3,290.38.
The above observations make me that the market will inevitably achieve 3,315.54 level.
P.S
We determine oversold/overbought condition with RSI indicator.
When it drops below 30 - the market is considered to be oversold.
When it bounces above 70 - the market is considered to be overbought.
Disclosure: I am part of Trade Nation's Influencer program and receive a monthly fee for using their TradingView charts in my analysis.
Like and subscribe and comment my ideas if you enjoy them!

EURGBP Will Go Higher! Long!
Here is our detailed technical review for EURGBP.
Time Frame: 9h
Current Trend: Bullish
Sentiment: Oversold (based on 7-period RSI)
Forecast: Bullish
The market is approaching a significant support area 0.852.
The underlined horizontal cluster clearly indicates a highly probable bullish movement with target 0.856 level.
P.S
The term oversold refers to a condition where an asset has traded lower in price and has the potential for a price bounce.
Overbought refers to market scenarios where the instrument is traded considerably higher than its fair value. Overvaluation is caused by market sentiments when there is positive news.
Disclosure: I am part of Trade Nation's Influencer program and receive a monthly fee for using their TradingView charts in my analysis.
Like and subscribe and comment my ideas if you enjoy them!

USD/CHF SENDS CLEAR BULLISH SIGNALS|LONG
Hello, Friends!
The BB lower band is nearby so USD-CHF is in the oversold territory. Thus, despite the downtrend on the 1W timeframe I think that we will see a bullish reaction from the support line below and a move up towards the target at around 0.801.
Disclosure: I am part of Trade Nation's Influencer program and receive a monthly fee for using their TradingView charts in my analysis.
LIKE AND COMMENT MY IDEAS

Gold Potential UpsidesHey Traders, in today's trading session we are monitoring XAUUSD for a buying opportunity around 3,300 zone, Gold is trading in an uptrend and currently is in a correction phase in which it is approaching the trend at 3,300 support and resistance area.
Trade safe, Joe.

GBPUSD Potential UpsidesHey Traders, in today's trading session we are monitoring GBPUSD for a buying opportunity around 1.37000 zone, GBPUSD is trading in an uptrend and currently is in a correction phase in which it is approaching the trend at 1.37000 support and resistance area.
Trade safe, Joe.

US30 - ShortLooking for the Short on US30 final pull back before we see extension to the upside 45,000.

NC HAMMER CRYPTOOn my videos posted on another platform that starts with a Y. You can see once it breaks the wedge it typically has a bullish outcome. Good luck and have fun with it.

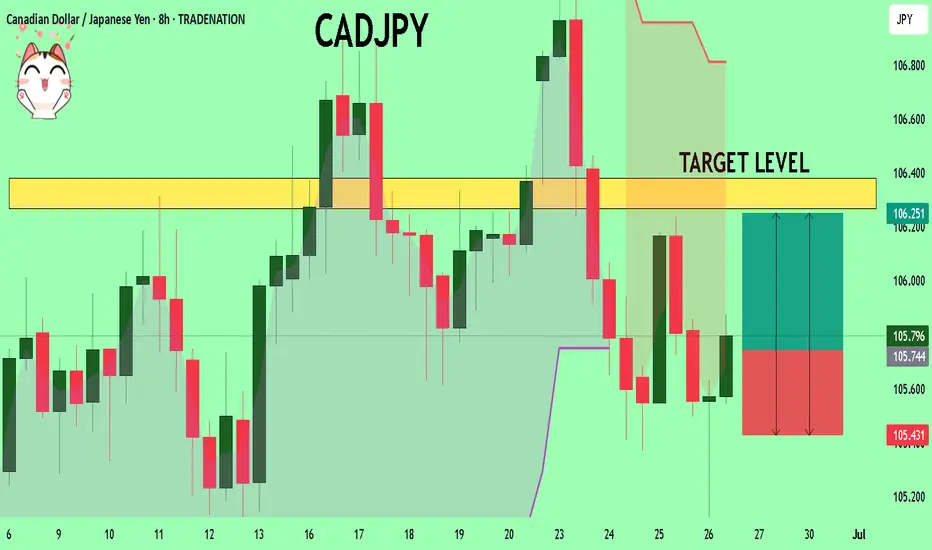
CADJPY What Next? BUY!
My dear friends,
Please, find my technical outlook for CADJPY below:
The instrument tests an important psychological level 105.74
Bias - Bullish
Technical Indicators: Supper Trend gives a precise Bullish signal, while Pivot Point HL predicts price changes and potential reversals in the market.
Target - 106.26
Recommended Stop Loss - 105.43
About Used Indicators:
Super-trend indicator is more useful in trending markets where there are clear uptrends and downtrends in price.
Disclosure: I am part of Trade Nation's Influencer program and receive a monthly fee for using their TradingView charts in my analysis.
———————————
WISH YOU ALL LUCK
USDCAD: Bullish Continuation is Expected! Here is Why:
Our strategy, polished by years of trial and error has helped us identify what seems to be a great trading opportunity and we are here to share it with you as the time is ripe for us to buy USDCAD.
Disclosure: I am part of Trade Nation's Influencer program and receive a monthly fee for using their TradingView charts in my analysis.
❤️ Please, support our work with like & comment! ❤️
