AUDUSD Breakout and Potential RetraceHey Traders, in today's trading session we are monitoring AUDUSD for a buying opportunity around 0.64900 zone, AUDUSD was trading in a downtrend and successfully managed to break it out. Currently is in a correction phase in which it is approaching the retrace area at 0.64900 support and resistance zone.
Trade safe, Joe.
LONG

CADJPY UpdateAs anticipated, price has rejected the horizontal level and is now pulling back into a key demand zone on the H1–H4 timeframe.
I’m watching this area closely for bullish confirmation to take a long position toward the upper target zone. If bullish price action does not appear and bearish momentum continues, we could see an extended move down toward the weekly 100.00 level.
That said, I currently favor the upside scenario, with the expectation that the highlighted upper zone will be met — but only if the market confirms.
This setup is still theoretical. Patience is key — we trade based on confirmation, not assumption. Stay tuned for updates.

GOLD Trading Opportunity! BUY!
My dear subscribers,
This is my opinion on the GOLD next move:
The instrument tests an important psychological level 3344.4
Bias - Bullish
Technical Indicators: Supper Trend gives a precise Bullish signal, while Pivot Point HL predicts price changes and potential reversals in the market.
Target - 3358.5
My Stop Loss - 3336.9
About Used Indicators:
On the subsequent day, trading above the pivot point is thought to indicate ongoing bullish sentiment, while trading below the pivot point indicates bearish sentiment.
Disclosure: I am part of Trade Nation's Influencer program and receive a monthly fee for using their TradingView charts in my analysis.
———————————
WISH YOU ALL LUCK

CHFJPY On The Rise! BUY!
My dear friends,
CHFJPY looks like it will make a good move, and here are the details:
The market is trading on 174.39 pivot level.
Bias - Bullish
Technical Indicators: Supper Trend generates a clear long signal while Pivot Point HL is currently determining the overall Bullish trend of the market.
Goal - 174.60
About Used Indicators:
Pivot points are a great way to identify areas of support and resistance, but they work best when combined with other kinds of technical analysis
Disclosure: I am part of Trade Nation's Influencer program and receive a monthly fee for using their TradingView charts in my analysis.
———————————
WISH YOU ALL LUCK

EURAUD: Bullish Continuation
The analysis of the EURAUD chart clearly shows us that the pair is finally about to go up due to the rising pressure from the buyers.
Disclosure: I am part of Trade Nation's Influencer program and receive a monthly fee for using their TradingView charts in my analysis.
❤️ Please, support our work with like & comment! ❤️

GBPAUD: Will Start Growing! Here is Why:
Looking at the chart of GBPAUD right now we are seeing some interesting price action on the lower timeframes. Thus a local move up seems to be quite likely.
Disclosure: I am part of Trade Nation's Influencer program and receive a monthly fee for using their TradingView charts in my analysis.
❤️ Please, support our work with like & comment! ❤️

BITCOIN Will Move Higher! Long!
Please, check our technical outlook for BITCOIN.
Time Frame: 1h
Current Trend: Bullish
Sentiment: Oversold (based on 7-period RSI)
Forecast: Bullish
The price is testing a key support 105,496.60.
Current market trend & oversold RSI makes me think that buyers will push the price. I will anticipate a bullish movement at least to 106,868.68 level.
P.S
The term oversold refers to a condition where an asset has traded lower in price and has the potential for a price bounce.
Overbought refers to market scenarios where the instrument is traded considerably higher than its fair value. Overvaluation is caused by market sentiments when there is positive news.
Disclosure: I am part of Trade Nation's Influencer program and receive a monthly fee for using their TradingView charts in my analysis.
Like and subscribe and comment my ideas if you enjoy them!

EURGBP Is Very Bullish! Buy!
Take a look at our analysis for EURGBP.
Time Frame: 1D
Current Trend: Bullish
Sentiment: Oversold (based on 7-period RSI)
Forecast: Bullish
The market is testing a major horizontal structure 0.841.
Taking into consideration the structure & trend analysis, I believe that the market will reach 0.852 level soon.
P.S
Overbought describes a period of time where there has been a significant and consistent upward move in price over a period of time without much pullback.
Disclosure: I am part of Trade Nation's Influencer program and receive a monthly fee for using their TradingView charts in my analysis.
Like and subscribe and comment my ideas if you enjoy them!

SILVER Will Go Up! Buy!
Take a look at our analysis for SILVER.
Time Frame: 10h
Current Trend: Bullish
Sentiment: Oversold (based on 7-period RSI)
Forecast: Bullish
The market is testing a major horizontal structure 3,324.9.
Taking into consideration the structure & trend analysis, I believe that the market will reach 3,432.4 level soon.
P.S
The term oversold refers to a condition where an asset has traded lower in price and has the potential for a price bounce.
Overbought refers to market scenarios where the instrument is traded considerably higher than its fair value. Overvaluation is caused by market sentiments when there is positive news.
Disclosure: I am part of Trade Nation's Influencer program and receive a monthly fee for using their TradingView charts in my analysis.
Like and subscribe and comment my ideas if you enjoy them!

AUDJPY Will Go Up From Support! Long!
Please, check our technical outlook for AUDJPY.
Time Frame: 4h
Current Trend: Bullish
Sentiment: Oversold (based on 7-period RSI)
Forecast: Bullish
The price is testing a key support 92.389.
Current market trend & oversold RSI makes me think that buyers will push the price. I will anticipate a bullish movement at least to 92.931 level.
P.S
Overbought describes a period of time where there has been a significant and consistent upward move in price over a period of time without much pullback.
Disclosure: I am part of Trade Nation's Influencer program and receive a monthly fee for using their TradingView charts in my analysis.
Like and subscribe and comment my ideas if you enjoy them!

USDJPY Will Go Higher From Support! Buy!
Take a look at our analysis for USDJPY.
Time Frame: 2h
Current Trend: Bullish
Sentiment: Oversold (based on 7-period RSI)
Forecast: Bullish
The market is on a crucial zone of demand 143.192.
The oversold market condition in a combination with key structure gives us a relatively strong bullish signal with goal 144.216 level.
P.S
We determine oversold/overbought condition with RSI indicator.
When it drops below 30 - the market is considered to be oversold.
When it bounces above 70 - the market is considered to be overbought.
Disclosure: I am part of Trade Nation's Influencer program and receive a monthly fee for using their TradingView charts in my analysis.
Like and subscribe and comment my ideas if you enjoy them!


ABBV - Are you Ready?Hello TradingView Family / Fellow Traders. This is Richard, also known as theSignalyst.
📈ABBV has been in a correction phase and it is currently approaching the lower bound of the red and blue channels.
Moreover, the green zone is a strong round number $150 and structure!
🏹 Thus, the highlighted blue circle is a strong area to look for buy setups as it is the intersection of structure and lower trendlines acting as non-horizontal support.
📚 As per my trading style:
As #ABBV approaches the blue circle, I will be looking for bullish reversal setups (like a double bottom pattern, trendline break , and so on...)
📚 Always follow your trading plan regarding entry, risk management, and trade management.
Good luck!
All Strategies Are Good; If Managed Properly!
~Rich

KAITO | waiting for FVG sweep$KAITO
Failed to reclaim monthly resistance, drifting down.
Eyes on $1.77–1.58 for bounce, but main long setup is $1.30–1.20 (1D FVG cluster).
Momentum fading — waiting for liquidity flush.
Break below $0.88 — bulls out.
Watching for SFP or reversal in main zones before entering.
📌 Patience required — wait for a proper sweep and confirmation before acting. Strong setups form when fear peaks.

CADJPY LongPrice recently broke structure to the upside (BoS), confirming a bullish shift in momentum after forming a double bottom around the 101.50–102.00 region.
Currently, price is consolidating beneath the 104.90–105.00 resistance area, with a clear lower timeframe supply zone just above. If bulls sustain pressure, we could see a short-term rally toward the 106.00 zone, where the next supply awaits.
However, the key level to watch is 107.600, aligning with a major Daily Timeframe Supply Zone. This zone may act as a strong reversal point or profit-taking area for swing traders.

LDO - Next Impulse Starting Soon!Hello TradingView Family / Fellow Traders. This is Richard, also known as theSignalyst.
After breaking above the $0.8 major high, LDO has shifted from bearish to bullish from a long-term perspective. 📈
This week, it has been undergoing a correction phase within a falling channel marked in red. 🔻
For the bulls to take over and kick off the next impulsive wave toward the $1.5 mark, a breakout above the upper red trendline is needed. 🚀
📚 Always follow your trading plan regarding entry, risk management, and trade management.
Good luck!
All Strategies Are Good; If Managed Properly!
~Rich

GBPJPY What Next? BUY!
My dear subscribers,
This is my opinion on the GBPJPY next move:
The instrument tests an important psychological level 193.34
Bias - Bullish
Technical Indicators: Supper Trend gives a precise Bullish signal, while Pivot Point HL predicts price changes and potential reversals in the market.
Target - 194.37
About Used Indicators:
On the subsequent day, trading above the pivot point is thought to indicate ongoing bullish sentiment, while trading below the pivot point indicates bearish sentiment.
Disclosure: I am part of Trade Nation's Influencer program and receive a monthly fee for using their TradingView charts in my analysis.
———————————
WISH YOU ALL LUCK

AUDNZD: Long Trade Explained
AUDNZD
- Classic bullish formation
- Our team expects growth
SUGGESTED TRADE:
Swing Trade
Buy AUDNZD
Entry Level - 1.0766
Sl - 1.0740
Tp - 1.0812
Our Risk - 1%
Start protection of your profits from lower levels
Disclosure: I am part of Trade Nation's Influencer program and receive a monthly fee for using their TradingView charts in my analysis.
❤️ Please, support our work with like & comment! ❤️

GBPCAD: Long Trade with Entry/SL/TP
GBPCAD
- Classic bullish formation
- Our team expects pullback
SUGGESTED TRADE:
Swing Trade
Long GBPCAD
Entry - 1.8543
Sl - 1.8509
Tp - 1.8596
Our Risk - 1%
Start protection of your profits from lower levels
Disclosure: I am part of Trade Nation's Influencer program and receive a monthly fee for using their TradingView charts in my analysis.
❤️ Please, support our work with like & comment! ❤️

USDCAD: Growth & Bullish Continuation
Remember that we can not, and should not impose our will on the market but rather listen to its whims and make profit by following it. And thus shall be done today on the USDCAD pair which is likely to be pushed up by the bulls so we will buy!
Disclosure: I am part of Trade Nation's Influencer program and receive a monthly fee for using their TradingView charts in my analysis.
❤️ Please, support our work with like & comment! ❤️

EURUSD: Expecting Bullish Movement! Here is Why:
Balance of buyers and sellers on the EURUSD pair, that is best felt when all the timeframes are analyzed properly is shifting in favor of the buyers, therefore is it only natural that we go long on the pair.
Disclosure: I am part of Trade Nation's Influencer program and receive a monthly fee for using their TradingView charts in my analysis.
❤️ Please, support our work with like & comment! ❤️

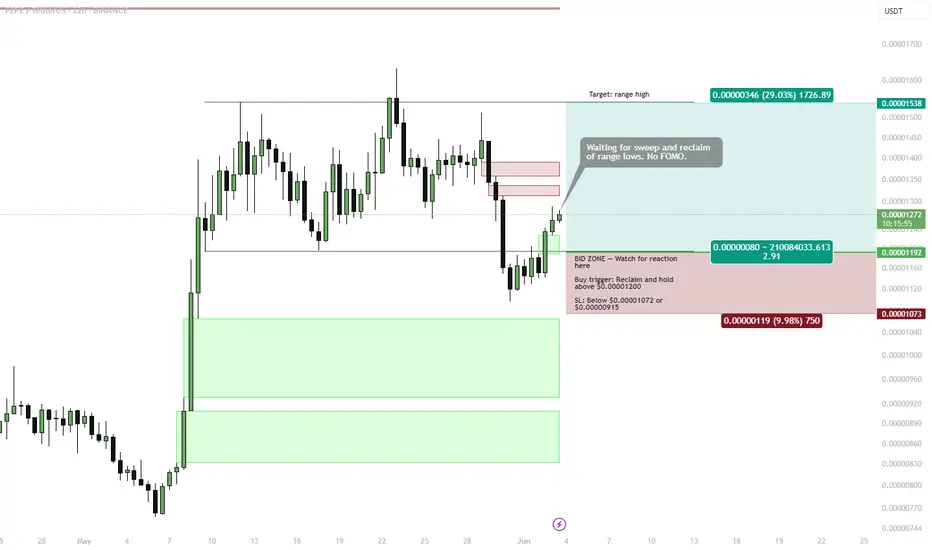
PEPE | range play — Reclaim Setup Targeting Range HighPrice has swept the range lows and is now attempting a reclaim of the lower boundary around 0.00001200. This creates a potential long setup targeting the range high if structure holds.
Setup:
🟩 Buy Trigger: Reclaim and hold above 0.00001200
• Entry confirmed after bullish reclaim
• SL: Below 0.00001072 or conservative below 0.00000915
📌 BID ZONE: 0.00001120–0.00001190
• Watch for reaction here — ideal place to enter during a retest
🎯 Target:
• Range High: 0.00001538 (~+29%)
Risk-Reward:
• R:R ≈ 2.9
• Setup remains invalid if price drops below bid zone or fails to hold the reclaim
Note:
⛔ No FOMO. Wait for confirmation — reclaim first, entry second.
SUI conditional breakout setup — Wait for Flip of BOS ZonePrice is currently testing a Break of Structure (BOS) zone near $3.26–3.46. However, the structure remains bearish as long as price remains under this zone. The long setup is only valid after a confirmed breakout and retest.
Setup:
🟩 Buy Trigger: Break and retest above $3.46
• No trade while price remains under the box
• Breakout + retest = confirmation to enter longs
• Target - resistance cluster around $5
• Stop-loss: below recent swing lows
📌 BOS Zone: $3.26–3.46
• Acting as a key inflection zone
• Once flipped, becomes the base for continuation higher
🚫 No longs inside/under box — wait for clear structure shift
Summary:
Setup requires patience — this is a breakout-retest strategy, not a bottom-picking one. Let the chart confirm direction before entering.
