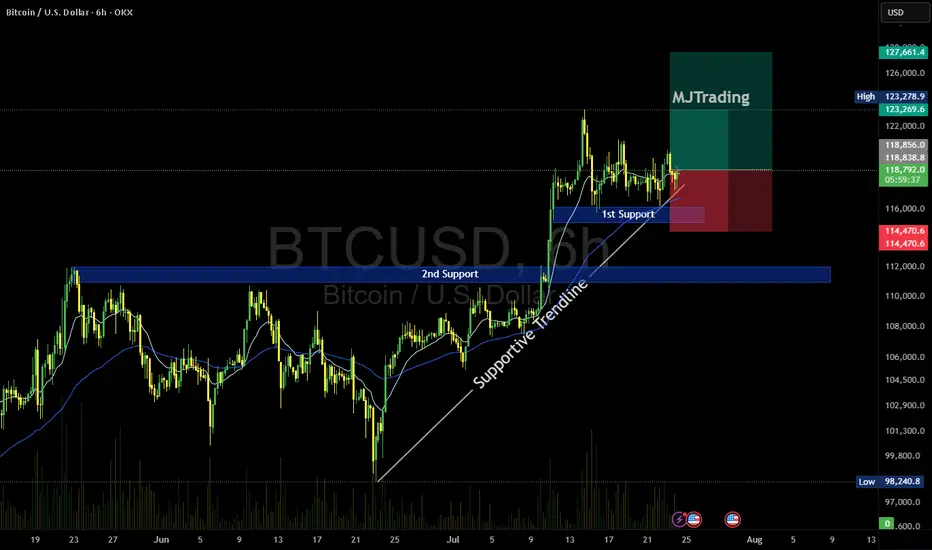
BTC/USD Buy Setup (6H Chart)📈 BTC/USD Buy Setup (6H Chart)
Strategy: Trendline Support Bounce
🔹 Entry
Price: $118,674.3
Reason: Price is bouncing off a supportive trendline and holding above the 1st Support zone.
🔻 Stop Loss (SL)
Price: $114,470.6
Reason: Below the 1st Support zone to protect against breakdown.
🎯 Take Profit Targets
TP1: $123,269.6
Reason: Near recent swing high, good for partial profit.
TP2: $127,661.4
Reason: Next resistance zone, ideal for full exit or trailing stop.
#MJTrading
#Bitcoin
LONG
EUR/JPY: Bullish Thesis on Policy DivergenceOur primary thesis is built on a powerful confluence of compelling fundamental drivers and a clear technical structure. We are taking a long position in EUR/JPY with high conviction, anticipating significant upside fueled by a stark monetary policy divergence confirmed by a constructive chart formation.
📰 Fundamental Analysis: The core of this trade is the widening policy gap between the European Central Bank (ECB) and the Bank of Japan (BoJ). While the BoJ is only just beginning to exit its ultra-loose monetary policy, the global environment points toward continued JPY weakness. The upcoming high-impact US news will act as a major catalyst. A "risk-on" reaction to the data would significantly weaken the JPY, providing a strong tailwind for this trade.
📊 Technical Analysis: The chart structure for EUR/JPY is decidedly bullish. The pair has established a clear uptrend, and recent price action indicates a period of healthy consolidation above key support levels. This presents a strategic entry point, as the market appears to be gathering momentum for the next leg higher. The current setup suggests a low-risk entry into a well-defined upward trend.
🧠 The Trade Plan: Based on this synthesis, we are executing a precise trade with a favorable risk profile.
👉 Entry: 172.422
⛔️ Stop Loss: 171.292
🎯 Take Profit: 174.684
⚖️ Risk/Reward: 1:2

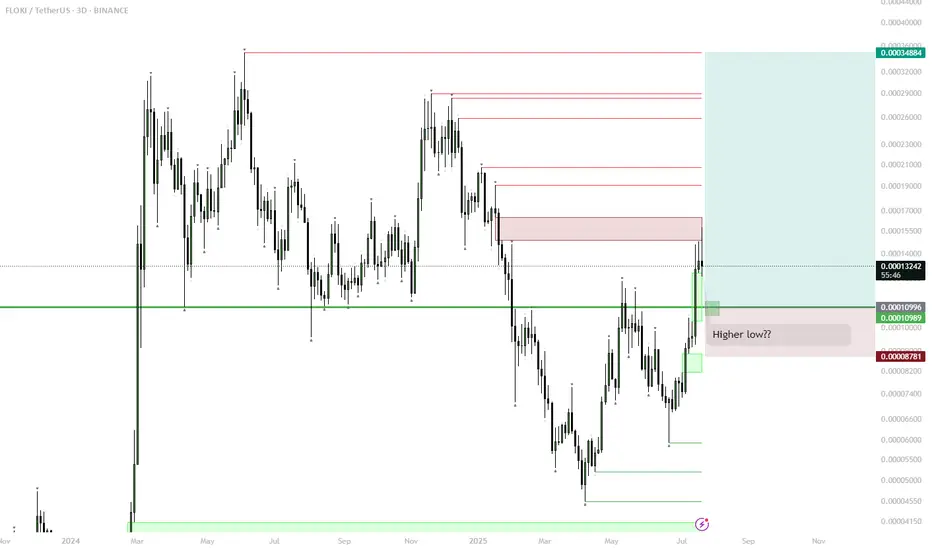
FLOKI – Range Low Setup for Next Big Move? (1D Plan)
FLOKI has reclaimed the key horizontal support, forming a possible higher low.
Currently watching the green box/range low for signs of accumulation (sideways price action) and support confirmation.
If FLOKI establishes a range or shows strength at this zone, look for a long entry with stop below the range.
Upside target is the range high and previous major resistance, offering a potential ~180% move.
Invalidation: clear breakdown and close below the green zone signals failed setup.
FLOKI is showing classic bottoming structure: reclaim of support and formation of a higher low after a prolonged downtrend. Range lows historically have provided major entries for explosive moves. If the green box zone acts as accumulation and price holds, it could set the stage for a rally back to the top of the range as seen before. This setup is favored in meme/altcoin cycles, especially when market sentiment improves. Risk is defined, reward is high.
EUR/GBP: Bullish Stance Above 0.8640This signal outlines a tactical long entry on EUR/GBP, positioning for a bullish resolution from today's major fundamental events.
📰 Fundamental Thesis
This position is taken ahead of the two primary market movers: the ECB rate decision and the UK PMI data. The core thesis is that the ECB policy statement will be the dominant catalyst, providing strength to EUR that will outweigh the impact of the UK data release.
📊 Technical Thesis
The trade is defined by a sound technical structure. The stop loss is anchored beneath the critical support zone at 0.8640. The profit target is set to challenge the resistance area just above 0.8722. This setup offers a favorable and clearly defined risk-to-reward profile.
🧠 Risk Management
Execution is timed before extreme event-driven volatility. Adherence to the stop loss is critical to manage the inherent risk of this pre-news strategy.
Trade Parameters
⬆️ Direction: Long (Buy)
➡️ Entry: 0.86690
⛔️ Stop Loss: 0.86344
🎯 Target: 0.87382
✅ Risk/Reward: 1:2

EURUSD Potential UpsidesHey Traders, in today's trading session we are monitoring EURUSD for a buying opportunity around 1.16650 zone, EURUSD is trading in an uptrend and currently is in a correction phase in which it is approaching the trend at 1.16650 support and resistance area.
Trade safe, Joe.

USDCAD: Long Trading Opportunity
USDCAD
- Classic bullish pattern
- Our team expects retracement
SUGGESTED TRADE:
Swing Trade
Buy USDCAD
Entry - 1.3618
Stop - 1.3586
Take - 1.3685
Our Risk - 1%
Start protection of your profits from lower levels
Disclosure: I am part of Trade Nation's Influencer program and receive a monthly fee for using their TradingView charts in my analysis.
❤️ Please, support our work with like & comment! ❤️

HelenP I. Gold, after small correction, can continue to move upHi folks today I'm prepared for you Gold analytics. If we look at the chart, the dominant feature is a strong, sustained bullish trend defined by a major ascending trend line that has repeatedly served as a reliable foundation for the price, confirming that buyers currently maintain firm control. At present, the price action is consolidating above a crucial horizontal pivot area, the support zone between 3385 and 3400. The significance of this zone is high, as it's a classic polarity point where previous resistance has flipped to become support, suggesting a concentration of buying interest. My core analysis hinges on the scenario of a brief, healthy corrective move down to retest this support zone. I believe this retest is a key market dynamic to confirm buyers' commitment. If the price dips into the 3385-3400 area and is met with a decisive rejection of lower prices, it would provide a powerful signal that the underlying bullish sentiment remains fully intact. A successful defense of this zone would be the primary trigger, creating the momentum for the next upward leg. Therefore, I have set the primary goal for this move at the 3460 level. If you like my analytics you may support me with your like/comment.❤️
Disclaimer: As part of ThinkMarkets’ Influencer Program, I am sponsored to share and publish their charts in my analysis.

EURNZD: Bulls Will Push Higher
Our strategy, polished by years of trial and error has helped us identify what seems to be a great trading opportunity and we are here to share it with you as the time is ripe for us to buy EURNZD.
Disclosure: I am part of Trade Nation's Influencer program and receive a monthly fee for using their TradingView charts in my analysis.
❤️ Please, support our work with like & comment! ❤️

EURGBP: Will Keep Growing! Here is Why:
The recent price action on the EURGBP pair was keeping me on the fence, however, my bias is slowly but surely changing into the bullish one and I think we will see the price go up.
Disclosure: I am part of Trade Nation's Influencer program and receive a monthly fee for using their TradingView charts in my analysis.
❤️ Please, support our work with like & comment! ❤️

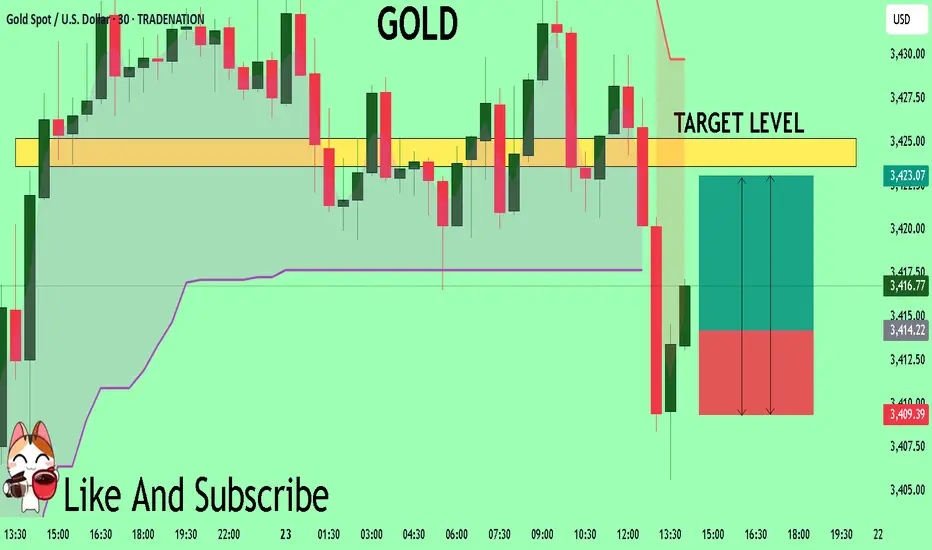
GOLD The Target Is UP! BUY!
My dear friends,
Please, find my technical outlook for GOLD below:
The price is coiling around a solid key level - 3414.2
Bias - Bullish
Technical Indicators: Pivot Points Low anticipates a potential price reversal.
Super trend shows a clear buy, giving a perfect indicators' convergence.
Goal - 3423.6
Safe Stop Loss - 3409.3
About Used Indicators:
The pivot point itself is simply the average of the high, low and closing prices from the previous trading day.
Disclosure: I am part of Trade Nation's Influencer program and receive a monthly fee for using their TradingView charts in my analysis.
———————————
WISH YOU ALL LUCK
Gold is Targeting Fresh HighsHey Traders, in today's trading session we are monitoring Gold for a buying opportunity around 3,410 zone, Gold is trading in an uptrend and currently is in a correction phase in which it is approaching the trend at 3,410 support and resistance area.
Trade safe, Joe.

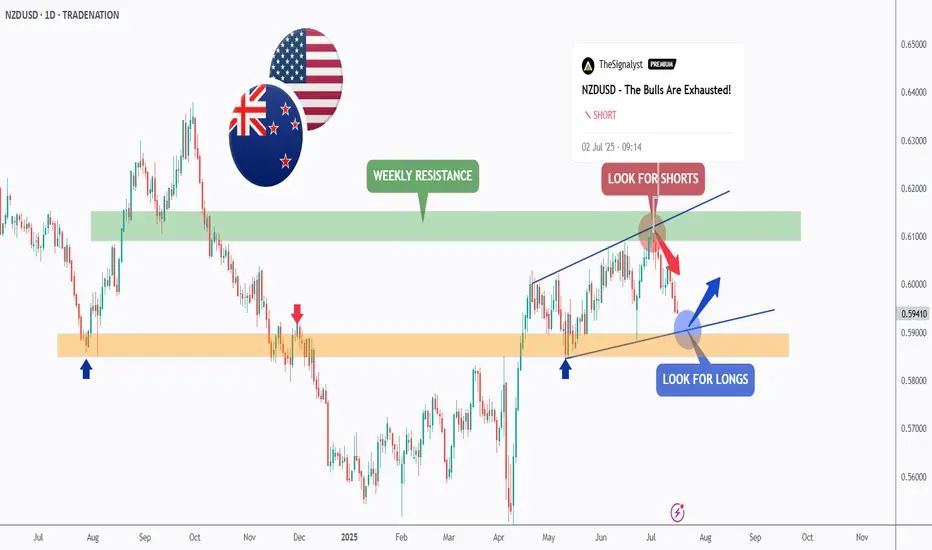
NZDUSD - It is Time!Hello TradingView Family / Fellow Traders. This is Richard, also known as theSignalyst.
As per our last NZDUSD analysis, attached on the chart, it rejected the upper bound of the blue wedge pattern and traded lower.
📈This week, NZDUSD is retesting the lower bound of the wedge.
Moreover, the orange zone is a strong weekly support.
🏹 Thus, the highlighted blue circle is a strong area to look for buy setups as it is the intersection of the lower blue trendline and orange support.
📚 As per my trading style:
As #NZDUSD approaches the blue circle zone, I will be looking for bullish reversal setups (like a double bottom pattern, trendline break , and so on...)
📚 Always follow your trading plan regarding entry, risk management, and trade management.
Good luck!
All Strategies Are Good; If Managed Properly!
~Rich
Disclosure: I am part of Trade Nation's Influencer program and receive a monthly fee for using their TradingView charts in my analysis.
GOLD Will Go Up! Buy!
Please, check our technical outlook for GOLD.
Time Frame: 2h
Current Trend: Bullish
Sentiment: Oversold (based on 7-period RSI)
Forecast: Bullish
The market is trading around a solid horizontal structure 3,427.91.
The above observations make me that the market will inevitably achieve 3,460.54 level.
P.S
We determine oversold/overbought condition with RSI indicator.
When it drops below 30 - the market is considered to be oversold.
When it bounces above 70 - the market is considered to be overbought.
Disclosure: I am part of Trade Nation's Influencer program and receive a monthly fee for using their TradingView charts in my analysis.
Like and subscribe and comment my ideas if you enjoy them!

EURUSD Will Move Higher! Long!
Here is our detailed technical review for EURUSD.
Time Frame: 9h
Current Trend: Bullish
Sentiment: Oversold (based on 7-period RSI)
Forecast: Bullish
The market is testing a major horizontal structure 1.174.
Taking into consideration the structure & trend analysis, I believe that the market will reach 1.184 level soon.
P.S
Overbought describes a period of time where there has been a significant and consistent upward move in price over a period of time without much pullback.
Disclosure: I am part of Trade Nation's Influencer program and receive a monthly fee for using their TradingView charts in my analysis.
Like and subscribe and comment my ideas if you enjoy them!

GBPCAD Is Very Bullish! Buy!
Please, check our technical outlook for GBPCAD.
Time Frame: 4h
Current Trend: Bullish
Sentiment: Oversold (based on 7-period RSI)
Forecast: Bullish
The market is approaching a significant support area 1.841.
The underlined horizontal cluster clearly indicates a highly probable bullish movement with target 1.848 level.
P.S
The term oversold refers to a condition where an asset has traded lower in price and has the potential for a price bounce.
Overbought refers to market scenarios where the instrument is traded considerably higher than its fair value. Overvaluation is caused by market sentiments when there is positive news.
Disclosure: I am part of Trade Nation's Influencer program and receive a monthly fee for using their TradingView charts in my analysis.
Like and subscribe and comment my ideas if you enjoy them!

EUR/AUD BUYERS WILL DOMINATE THE MARKET|LONG
EUR/AUD SIGNAL
Trade Direction: long
Entry Level: 1.787
Target Level: 1.791
Stop Loss: 1.785
RISK PROFILE
Risk level: medium
Suggested risk: 1%
Timeframe: 1h
Disclosure: I am part of Trade Nation's Influencer program and receive a monthly fee for using their TradingView charts in my analysis.
✅LIKE AND COMMENT MY IDEAS✅

EUR/CAD BULLISH BIAS RIGHT NOW| LONG
Hello, Friends!
Previous week’s red candle means that for us the EUR/CAD pair is in the downtrend. And the current movement leg was also down but the support line will be hit soon and lower BB band proximity will signal an oversold condition so we will go for a counter-trend long trade with the target being at 1.600.
Disclosure: I am part of Trade Nation's Influencer program and receive a monthly fee for using their TradingView charts in my analysis.
✅LIKE AND COMMENT MY IDEAS✅

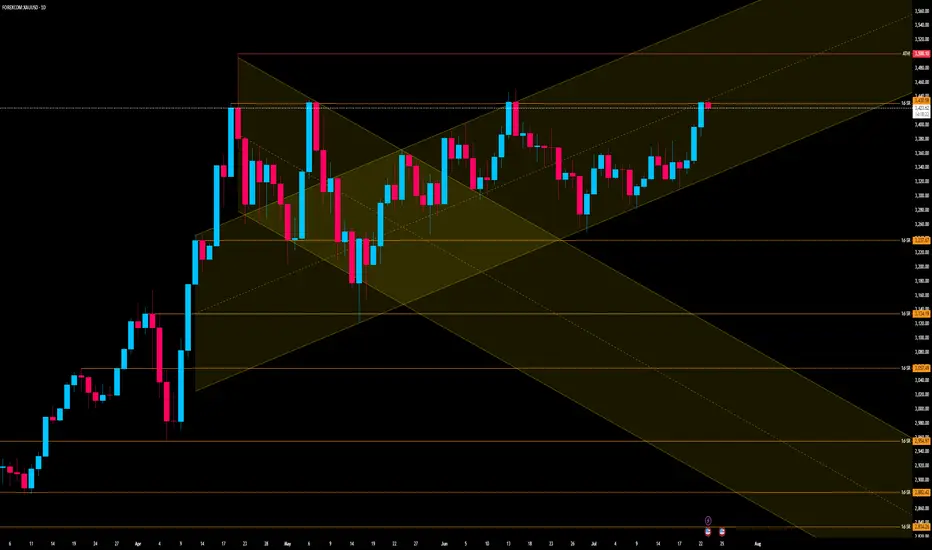
Gold Approaches Key Resistance Within Bullish Channel – BreakoutCurrent Price Action:
Gold is currently trading at around $3,442, nearing the upper boundary of a well-defined upward-sloping channel. The latest candle shows bullish momentum with a strong close near the daily high, indicating continued buying pressure.
Key Observations:
Trend Structure:
The overall trend remains bullish, with higher highs and higher lows clearly visible.
Price is approaching a critical Fibonacci extension level (1.618), which could act as resistance.
Channel Dynamics:
Price is within a parallel ascending channel.
It is currently testing the upper channel boundary, which may either lead to a breakout or a rejection.
Support & Resistance Levels:
Immediate resistance: $3,442 (Fibonacci extension & channel resistance).
Major resistance: $3,500 (ATH - All-Time High).
Key support levels: $3,275, $3,114, and $3,057 (marked horizontal levels, also align with Fibonacci retracement zones).
Rejection Zones:
Historically, price has reversed at similar extension levels.
If rejection occurs, a pullback to the midline or lower channel boundary is likely.
Forecast:
If the current bullish momentum continues and price breaks above the channel resistance, we could see a move toward the ATH at $3,500 and potentially higher.
However, if the price faces resistance and fails to break above $3,442–$3,450, a short-term pullback to around $3,275–$3,114 is possible. This would offer a healthier correction within the broader uptrend.
The bullish structure remains valid as long as price stays above $3,057.
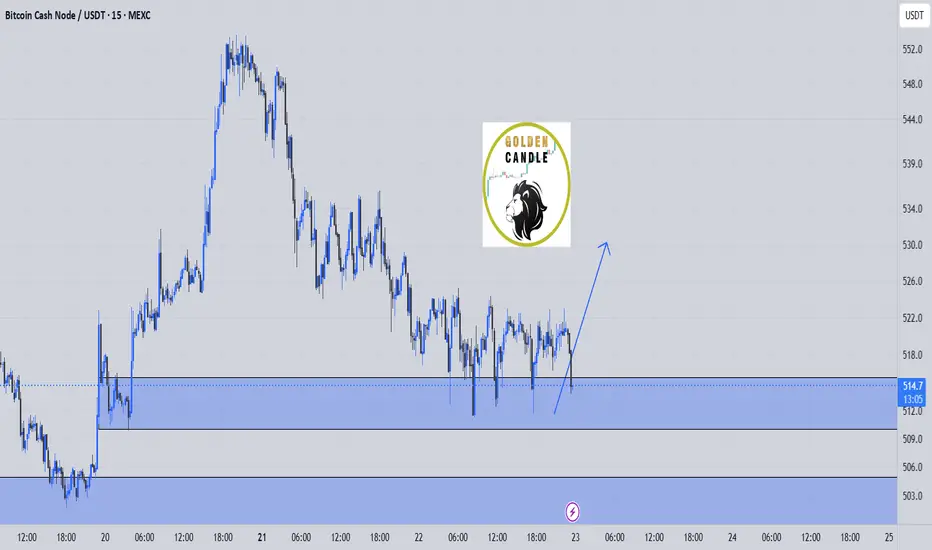
bch buy midterm"🌟 Welcome to Golden Candle! 🌟
We're a team of 📈 passionate traders 📉 who love sharing our 🔍 technical analysis insights 🔎 with the TradingView community. 🌎
Our goal is to provide 💡 valuable perspectives 💡 on market trends and patterns, but 🚫 please note that our analyses are not intended as buy or sell recommendations. 🚫
Instead, they reflect our own 💭 personal attitudes and thoughts. 💭
Follow along and 📚 learn 📚 from our analyses! 📊💡"
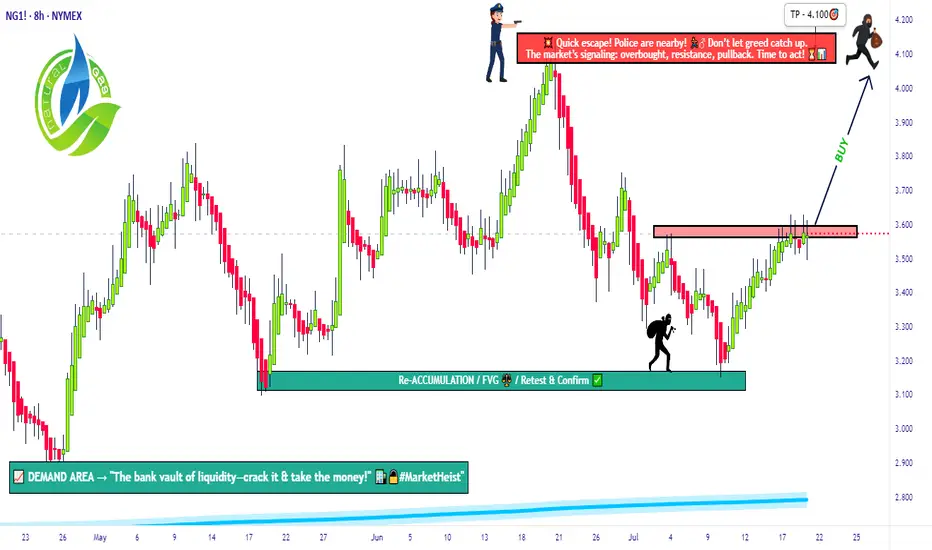
The Great Gas Heist: Load Your Longs Before It Blows💎🚨“Operation Gas Vault: NG1! Breakout Robbery Blueprint”🚨💎
🌟Hi! Hola! Ola! Bonjour! Hallo! Marhaba!🌟
Welcome to all my Market Hustlers & Silent Robbers 🕵️♂️💼💰
Today’s target: NG1! Henry Hub Natural Gas Futures
📍Strategy: A bullish heist mission with a calculated escape plan.
🔥Thief Trading Blueprint: Gas Market Heist🔥
🎯 Entry Gameplan
“The vault cracks open at 3.630 – That’s your cue.”
Wait for resistance breakout 🧱 (around 3.630) – that’s the signal.
Set Buy Stop orders above the Moving Average.
Or, use a layered DCA entry via Limit Orders near swing highs/lows (15m or 30m timeframe).
Thief Tip: Set an alert/alarm so you don’t miss the breakout bang 🔔💥
🛡 Stop Loss Setup (Post-Breakout Only!)
“Don’t be reckless. No SL before breakout — wait for confirmation.”
SL Location: Swing low (4H) near 3.370.
Set SL after breakout happens, not before.
Adjust based on your risk tolerance, lot size & number of open entries.
⚠️ Placing early SL = triggering the trap before the door opens.
🏴☠️ Loot Target 🎯
Take Profit Zone: 4.100
Escape Tip: No need to be greedy. Take profit before the police arrive (resistance)!
🧲 Scalper’s Shortcut
Only go Long – avoid fighting the current.
If you’ve got cash flow, strike early. If not, ride with the swing crew.
Use trailing SL to protect your stack 💼📉
📊 Fundamental Clues Behind the Heist
The gas vault is heating up thanks to:
🔥COT Reports
🛢 Inventory & Storage data
📈 Seasonal trends
💹 Sentiment flows
⚖ Intermarket linkages
Checkk your own global indicators 🌍🔗 – don’t enter blindfolded.
🗞️ News Traps & Position Protection
Avoid new entries during major news releases 📰🚫
Trail stops to guard running positions
Markets react fast. Adapt even faster.
⚠️ Disclaimer: This is educational info, not personal investment advice. Your money, your risk, your decisions.
💥 Support the Robbery Squad 💥
If you vibe with the Thief Trading Style, smash that Boost Button 💖
Grow the gang, expand the vaults, and master this money maze together! 🤑🏆🚀
Stay tuned – another heist plan is on the way.
Until then, trade smart, trade sharp. 👊🕶💼
🔒#NaturalGas #ThiefTrading #BreakoutStrategy #SwingTrade #FuturesHeist #NG1Plan #RobTheMarket
NZDJPY: Long Trade Explained
NZDJPY
- Classic bullish setup
- Our team expects bullish continuation
SUGGESTED TRADE:
Swing Trade
Long NZDJPY
Entry Point - 87.616
Stop Loss - 87.361
Take Profit - 88.064
Our Risk - 1%
Start protection of your profits from lower levels
Disclosure: I am part of Trade Nation's Influencer program and receive a monthly fee for using their TradingView charts in my analysis.
❤️ Please, support our work with like & comment! ❤️

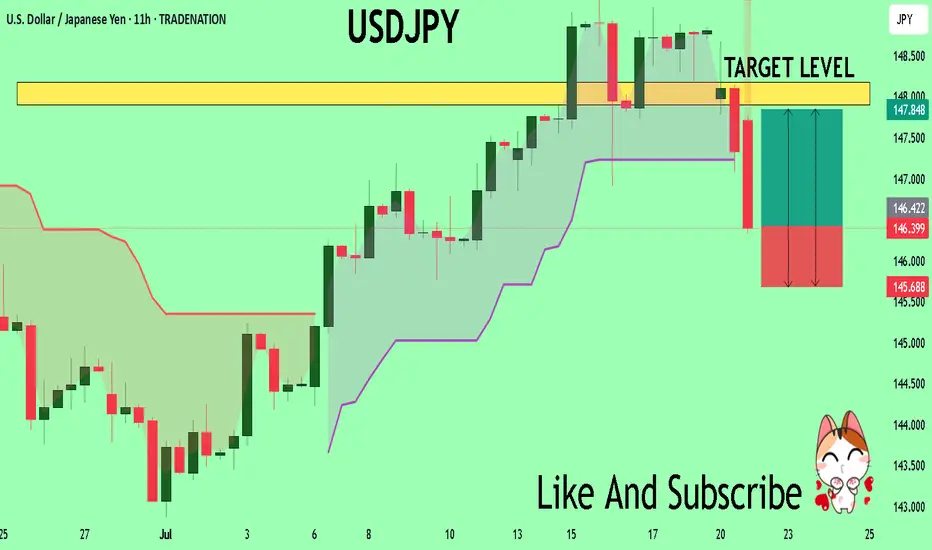
USDJPY Sellers In Panic! BUY!
My dear subscribers,
My technical analysis for USDJPY is below:
The price is coiling around a solid key level - 146.36
Bias - Bullish
Technical Indicators: Pivot Points Low anticipates a potential price reversal.
Super trend shows a clear buy, giving a perfect indicators' convergence.
Goal - 147.90
My Stop Loss - 145.68
About Used Indicators:
By the very nature of the supertrend indicator, it offers firm support and resistance levels for traders to enter and exit trades. Additionally, it also provides signals for setting stop losses
Disclosure: I am part of Trade Nation's Influencer program and receive a monthly fee for using their TradingView charts in my analysis.
———————————
WISH YOU ALL LUCK
ETH — Perfect Long Play: Pullback & 1W Breaker Reclaim
After the strong move, price is likely to retrace as longs get trapped and late buyers take profit.
Best scenario: ETH pulls back to the 1W breaker zone ($3,141–$3,456), which previously acted as resistance and could now flip into support.
Watch for bullish reaction and confirmation in the 1W breaker zone.
If support holds, enter long — targeting a return to the range high and then the liquidity zone ($4,108+).
Invalidation if ETH closes below the 1W breaker or loses range low ($2,876) support.
ETH has rallied hard. After such a move, it’s normal for price to pull back and test old resistance as new support. The ideal long is on confirmation of a bounce from the 1W breaker zone, which keeps risk controlled and sets up for a continuation move higher. This approach avoids FOMO and protects against reversal if the breakout fails.
