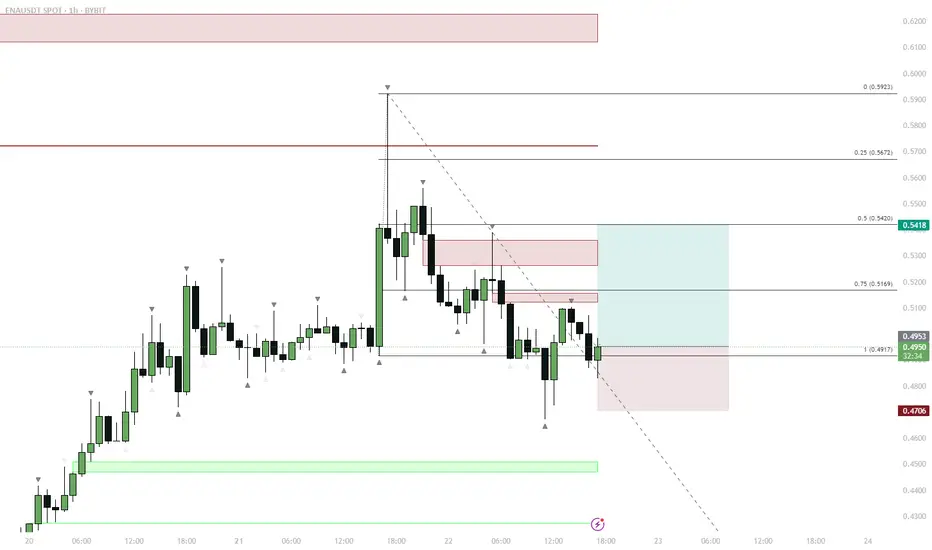
ENA — Range Deviation & Reclaim: LTF Long Setup
ENA traded in a tight LTF range, then deviated below support, forming a sweep/liquidity grab.
Price quickly reclaimed the range low and retested the FVG (Fair Value Gap) below the range.
This reclaim/flip is a classic bullish reversal setup after a sweep.
Entry on the retest of FVG and previous support, targeting a move back to mid-range and then range highs.
Invalidation below the deviation low (stop).
Price action shows a textbook range deviation and reclaim setup. ENA swept liquidity below the range, trapped shorts, and reclaimed support, forming a bullish reversal signal. The retest of the FVG provided a high-probability entry for a move back to the range highs. This play relies on the principle that deviation and reclaim below a range often leads to a reversal as trapped sellers are forced to cover.
LONG
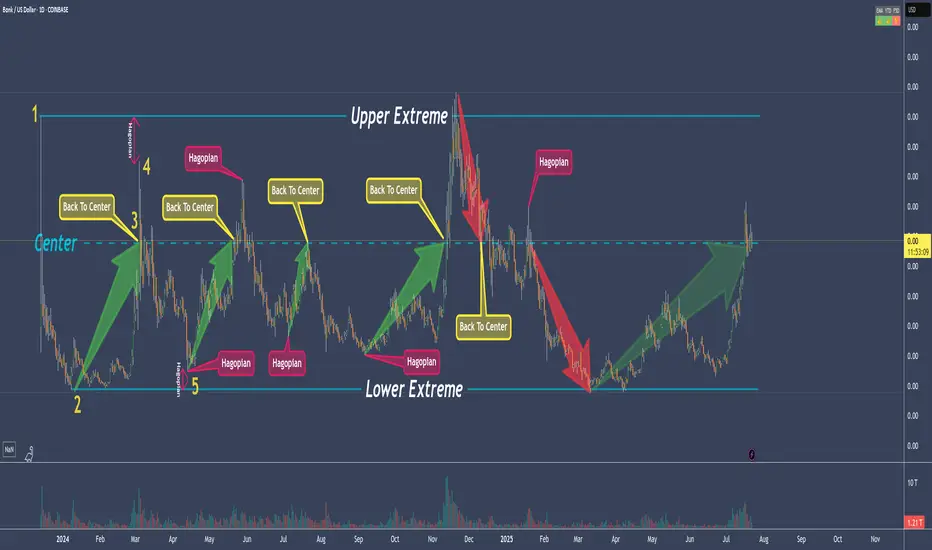
DOGEUSD Has reached it's (first?) targetAfter reaching the Centerline, price eitheradvances to the Upper Extreme (U-MLH), or it reverses and it's target is the L-MLH, the lower Extreme of the Fork.
An Open & Close below the Centerline would indicate further progress to the downside.
A stop above the last high with a target around 2 would be the trade I would take.

80% Of Time - A Trading Edge You Don't Want To MissDo you want to know why trading with median lines, also known as pitchforks, can be so successful? It’s simple:
Prices swing from one extreme back to the middle.
From the middle, they often swing to the other extreme.
What do we see on the chart?
- The upper extreme
- The center
- The lower extreme
So far, so good.
Now let’s follow the price and learn a few important rules that belong to the rulebook of median lines/pitchforks, and with which you can make great trades.
Point 1
The price starts and is sold off down to…
Point 2
...and from there starts to rise again, up to…
Point 3
...which is the center. And here we have a rule that is very important and one that you need to be aware of in trading to be successful:
THE PRICE RETURNS TO THE CENTER IN ABOUT 80% OF ALL CASES
If we know this, then we can stay in a trade with confidence.
Point 4
The price climbed even higher but missed the upper extreme.
This is the “Hagopian Rule” (named after the man who discovered it).
And the rule goes: If the price does not reach the next line (upper extreme, lower extreme, or center), then the price will continue moving in the opposite direction from where it originally came.
Phew...that’s a mouthful ;-)
But yes, we actually see that the price does exactly this.
From point 4, where the price missed the upper extreme, the price not only goes back to the center but continues and almost reaches the lower extreme!
Now if that isn’t cool, I don’t know what is!
And what do we have at point 5?
A "HAGOPIAN"!
What did we just learn?
The price should go higher than the center line.
Does it do that?
Oh yes!
But wait!
Not only does the Hagopian Rule apply. Remember?
"The price returns to the center line in about 80% of the cases."
HA!
Interesting or interesting?
So, that’s it.
That’s enough for now.
Now follow the price yourself and always consider which rule applies and whether it’s being followed.
How exactly do you trade all this, and what are the setups?
...one step at a time.
Don’t miss the next lesson and follow me here on TradingView.
Wishing you lots of success and fun!
ETHUSD - Decision TimeWhat do make of the current situation?
What if you are long?
Here's what to expect:
a) support at the U-MLH, further advancing up to the WL
b) open & close within the Fork. If so, there's a 95% Chance of price dumping down to the Centerline.
Taking 50% off the table is never bad.
50% money in the pocket if price falls down to the Centerline.
Or if it advances up to the WL, you still have 50% that generates profits.
Either way, you have a winner on your hands.
Don't let it dig into a Looser!

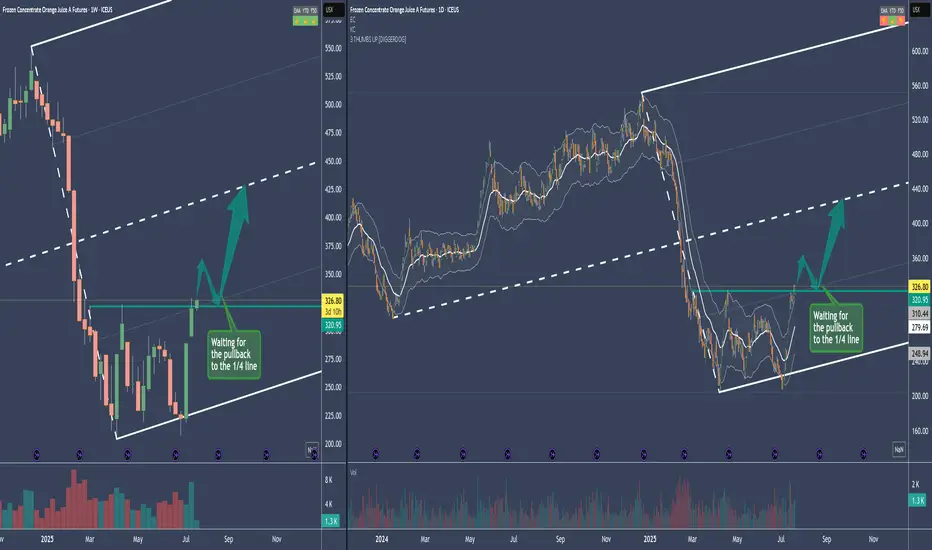
OJ - Frozen Orange Juice Long SetupThe Medianline se aka Fork, is a pullback Fork.
So what we want to see is a reversion to the mean after this drop.
The sideways action from Mar. to Jul. is a "loading" period, where Commercials load their boat.
If we break the resistance, it's usual that there will be a pullback to the prior resistance - now support. Or even into the loading zone.
Entries will be on a intraday basis.
Stalker mode on 88-)
#012: LONG Investment Opportunity on EUR/USD
In this scenario, I placed a passive long order on EUR/USD at a key zone that has shown signs of accumulation and institutional defense in recent days.
The price showed bearish manipulation followed by a sharp rebound with a V-shaped pattern, often indicative of stop-loss hunting. In these phases, a direct entry is less effective than a passive strategy aimed at intercepting a possible technical pullback in the zone where abnormal volumes and algorithmic defenses have manifested.
The order was designed to be activated only if the market were to temporarily return to the previously absorbed zone, thus avoiding chasing the price after a directional candlestick.
The stop-loss placement was carefully chosen to avoid both typical retail hunting zones and areas visible to algorithms. It is positioned to ensure operational invisibility, but also consistency with the logic of institutional defense: if reached, the trade will be automatically invalidated.
The target is aligned with the superior technical structure and the normal range of movement that develops when this dynamic is respected.
This operation is designed to be left to operate completely autonomously, without the need for adjustments or active management. Either in or out. The sole objective is to align with institutional flows, with controlled risk and a favorable management structure.

NZDUSD Will Go Higher From Support! Long!
Please, check our technical outlook for NZDUSD.
Time Frame: 12h
Current Trend: Bullish
Sentiment: Oversold (based on 7-period RSI)
Forecast: Bullish
The market is trading around a solid horizontal structure 0.596.
The above observations make me that the market will inevitably achieve 0.602 level.
P.S
Please, note that an oversold/overbought condition can last for a long time, and therefore being oversold/overbought doesn't mean a price rally will come soon, or at all.
Disclosure: I am part of Trade Nation's Influencer program and receive a monthly fee for using their TradingView charts in my analysis.
Like and subscribe and comment my ideas if you enjoy them!

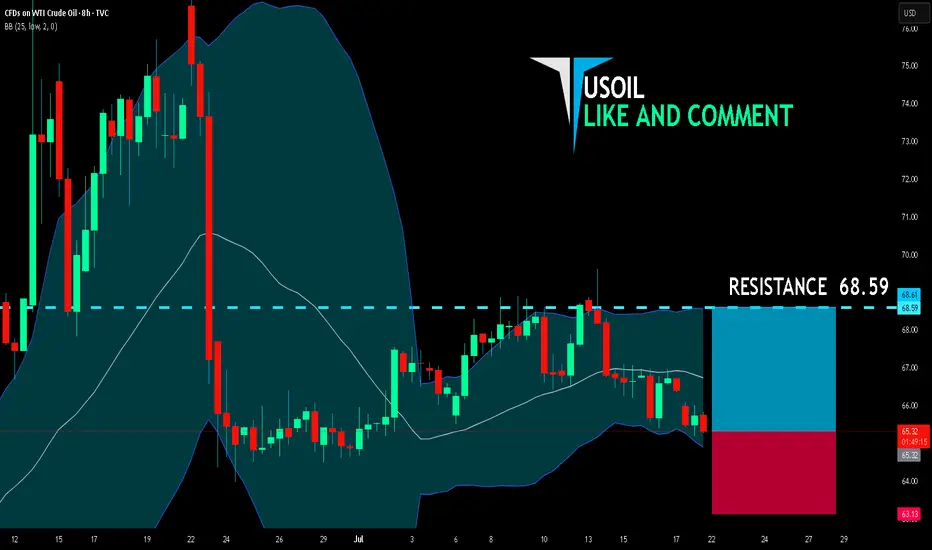
USOIL BULLS ARE STRONG HERE|LONG
USOIL SIGNAL
Trade Direction: long
Entry Level: 65.32
Target Level: 68.59
Stop Loss: 63.13
RISK PROFILE
Risk level: medium
Suggested risk: 1%
Timeframe: 8h
Disclosure: I am part of Trade Nation's Influencer program and receive a monthly fee for using their TradingView charts in my analysis.
✅LIKE AND COMMENT MY IDEAS✅
USD/CAD BULLS WILL DOMINATE THE MARKET|LONG
Hello, Friends!
USD/CAD pair is in the uptrend because previous week’s candle is green, while the price is clearly falling on the 4H timeframe. And after the retest of the support line below I believe we will see a move up towards the target above at 1.374 because the pair is oversold due to its proximity to the lower BB band and a bullish correction is likely.
Disclosure: I am part of Trade Nation's Influencer program and receive a monthly fee for using their TradingView charts in my analysis.
✅LIKE AND COMMENT MY IDEAS✅

SPX6900 Bidding 4H S/R + FVG Zone — Looking for New Highs✅ 4H S/R + FVG provides strong support and bid opportunity
✅ 200EMA adds further confluence to the setup
✅ Invalidation = 1h closes/consolidates below $1.14
Active Setup:
Long Entry: In $1.08–$1.14 zone (confirmation: reclaim or bullish trigger in area)
Target: $1.72 (new highs/ATH)
Manual Invalidation: Cut if 1h candles close and consolidate below $1.14
🔔 Triggers & Confirmations:
Only bid on strong reaction or reversal in FVG/S/R zone
Exit if 1h PA settles below $1.14 (red pattern bars area)
🚨 Risk Warning:
Aggressive longs — keep risk tight, cut quickly if invalidated

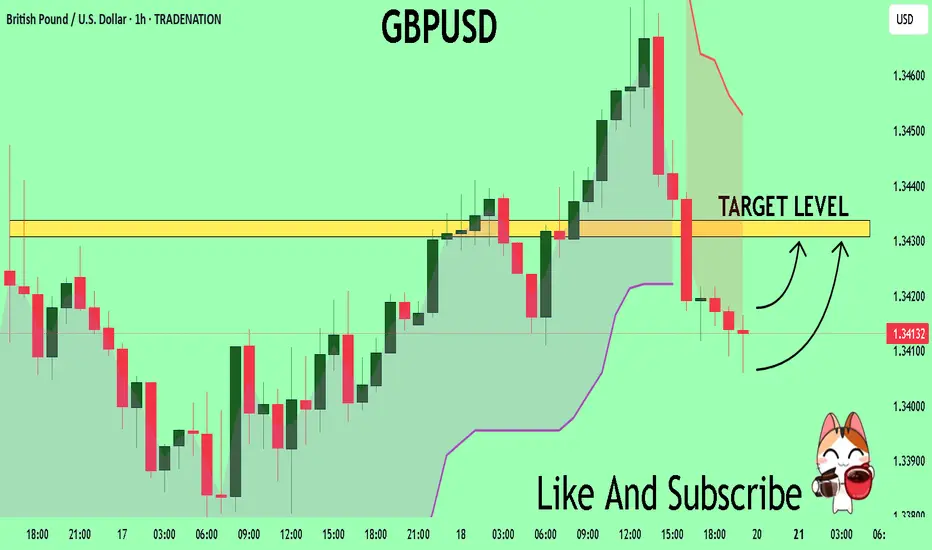
GBPUSD Expected Growth! BUY!
My dear followers,
I analysed this chart on GBPUSD and concluded the following:
The market is trading on 1.3413 pivot level.
Bias - Bullish
Technical Indicators: Both Super Trend & Pivot HL indicate a highly probable Bullish continuation.
Target - 1.3430
About Used Indicators:
A super-trend indicator is plotted on either above or below the closing price to signal a buy or sell. The indicator changes color, based on whether or not you should be buying. If the super-trend indicator moves below the closing price, the indicator turns green, and it signals an entry point or points to buy.
Disclosure: I am part of Trade Nation's Influencer program and receive a monthly fee for using their TradingView charts in my analysis.
———————————
WISH YOU ALL LUCK
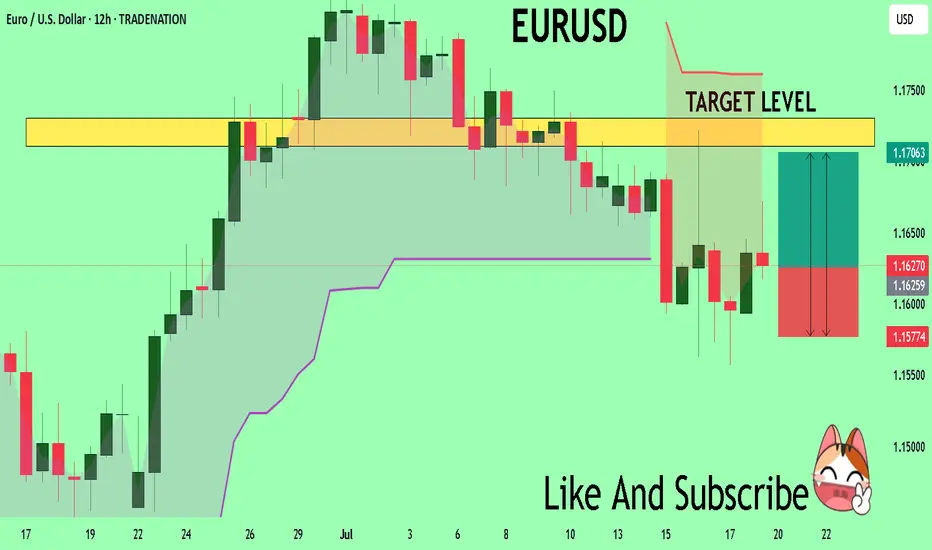
EURUSD Massive Long! BUY!
My dear friends,
Please, find my technical outlook for EURUSD below:
The price is coiling around a solid key level - 1.1627
Bias - Bullish
Technical Indicators: Pivot Points Low anticipates a potential price reversal.
Super trend shows a clear buy, giving a perfect indicators' convergence.
Goal - 1.1710
Safe Stop Loss - 1.1577
About Used Indicators:
The pivot point itself is simply the average of the high, low and closing prices from the previous trading day.
Disclosure: I am part of Trade Nation's Influencer program and receive a monthly fee for using their TradingView charts in my analysis.
———————————
WISH YOU ALL LUCK
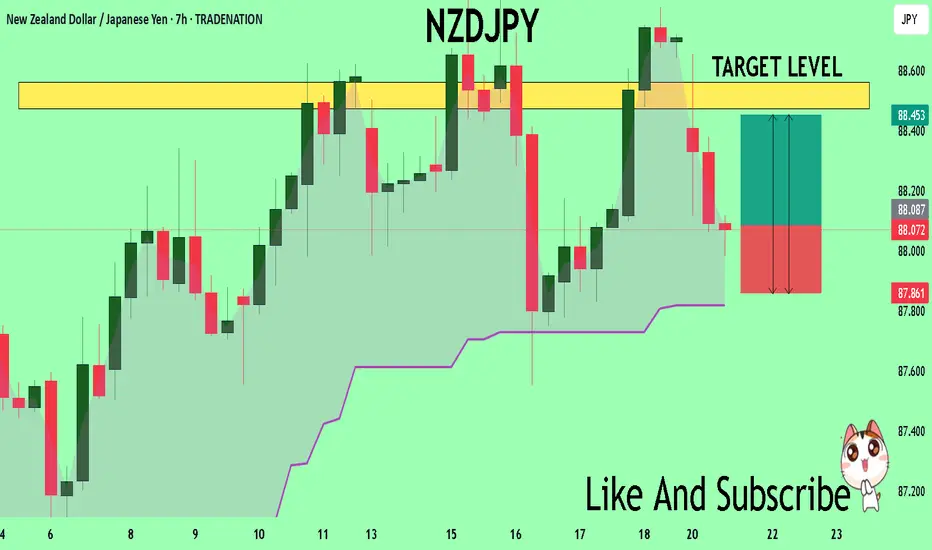
NZDJPY Set To Grow! BUY!
My dear friends,
My technical analysis for NZDJPY is below:
The market is trading on 88.079 pivot level.
Bias - Bullish
Technical Indicators: Both Super Trend & Pivot HL indicate a highly probable Bullish continuation.
Target - 88.472
Recommended Stop Loss - 87.861
About Used Indicators:
A pivot point is a technical analysis indicator, or calculations, used to determine the overall trend of the market over different time frames.
Disclosure: I am part of Trade Nation's Influencer program and receive a monthly fee for using their TradingView charts in my analysis.
———————————
WISH YOU ALL LUCK
EURUSD Bullish ProjectionIt’s been a while since my last update here.
Here’s my projection and actual entry/entries on EURUSD, based on a sweep of the previous 1H swing low and mitigation of a Daily imbalance (Fair Value Gap).
We're anticipating a full Change of Character to mark the end of the ongoing Daily pullback.

GOLD - Price can rise to resistance line of wedgeHi guys, this is my overview for XAUUSD, feel free to check it and write your feedback in comments👊
The price has been trading within a large ascending wedge for an extended period.
The asset found significant support near the lower trendline of this formation, specifically in the 3205 - 3187 price area.
From that support, the price initiated a sustained upward movement back towards the upper parts of the structure.
Currently, XAU is facing a key horizontal resistance zone located between 3375 and 3390 points.
The price is actively attempting to break through this area, which has historically served as a critical pivot point.
I expect that once the price firmly breaks and consolidates above this resistance, it will continue its growth towards the upper boundary of the wedge, targeting the $3475 level.
If this post is useful to you, you can support me with like/boost and advice in comments❤️
Disclaimer: As part of ThinkMarkets’ Influencer Program, I am sponsored to share and publish their charts in my analysis.

HelenP. I Bitcoin will rebound from trend line and rise to $123KHi folks today I'm prepared for you Bitcoin analytics. If we look at the chart, we can see a very clear and long-term bullish structure. The entire uptrend is supported by a major ascending trend line that has acted as a reliable foundation for the price for a significant amount of time. Currently, the price is consolidating above this crucial trend line and is interacting with the key support zone between 117500 and 116700 points. I believe that the most probable scenario here is a brief corrective move downwards for the price to properly retest the main ascending trend line. This type of retest is often a healthy sign in a strong trend, as it allows for the confirmation of support and gathers momentum for the next leg up. A strong rebound from this trend line would serve as a powerful signal that the buyers are still in control. Therefore, once the price confirms its bounce from this dynamic support, the path should be clear for a continuation of the uptrend. For this reason, my primary goal for this trade idea is set at the 123000 points. If you like my analytics you may support me with your like/comment ❤️
Disclaimer: As part of ThinkMarkets’ Influencer Program, I am sponsored to share and publish their charts in my analysis.

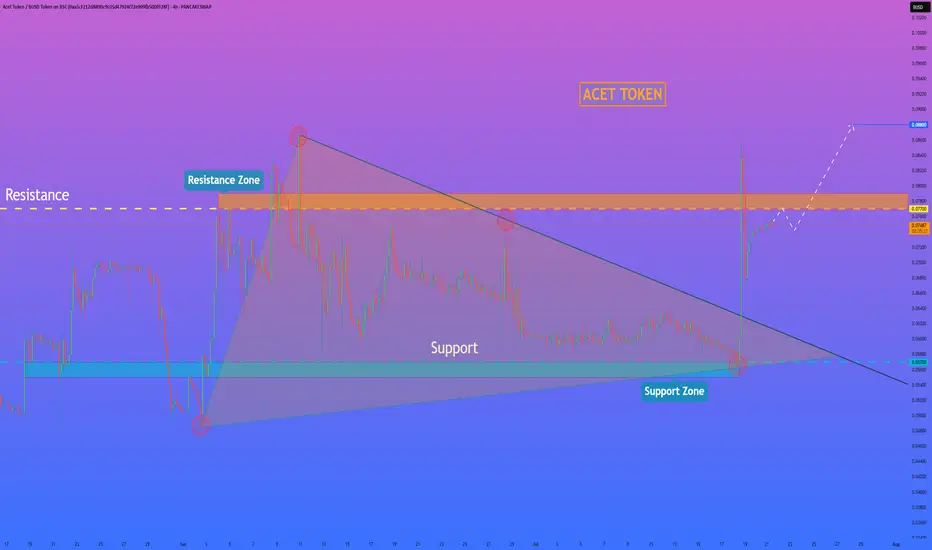
ACT TOKEN - Price can fall to support area and then bounce upHi guys, this is my overview for ACTBUSD, feel free to check it and write your feedback in comments👊
The price was trading within a descending channel for a considerable period.
The asset consistently found support at the lower boundary of this formation, within the 0.0590 - 0.0570 price zone.
Recently, a strong upward impulse allowed the price to break out from the upper boundary of the channel.
Following the breakout, the price executed a corrective move back to the broken resistance line, successfully retesting the 0.0730 - 0.0750 area.
This zone is now acting as a new support level, and the price has begun to move upwards from it, showing renewed buyer strength.
I expect that the asset will continue its growth from this support. My first target is set at the 0.0860 level, with the second target at 0.0970 points.
If this post is useful to you, you can support me with like/boost and advice in comments❤️

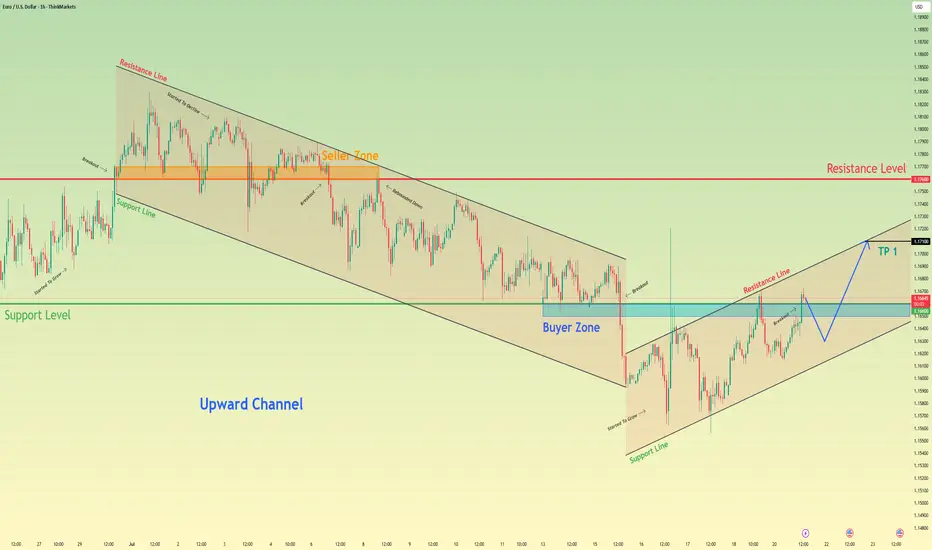
Euro may correct a little and then continue to rise in channelHello traders, I want share with you my opinion about Euro. Observing the recent price action, we can map out a clear transition in market structure. Previously, the pair was contained within a well-defined downward channel, where the seller zone around the 1.1760 resistance level consistently capped rallies, leading to multiple breakdowns and correctional movements. However, after a final push lower, the dynamic shifted, with the price action showing a clear downtrend-to-uptrend reversal. Currently, the euro has established a new upward channel, finding solid ground in the buyer zone around the 1.1660 support level. The price is now engaged in a constructive upward movement within the boundaries of this new channel. The prevailing hypothesis is that after a potential minor correction towards the channel's support line, the pair will resume its ascent. Therefore, the take-profit target for this scenario, tp 1, is strategically placed at 1.1710, as this level directly corresponds with the resistance line of the current upward channel, representing a logical point for price to react. Please share this idea with your friends and click Boost 🚀
Disclaimer: As part of ThinkMarkets’ Influencer Program, I am sponsored to share and publish their charts in my analysis.
nzdusd long tradein my opinion this is a good trade with a good r/r
hope it will hit the target
consider this is my trade not your trade
i just like to share my trades with world

HelenP. I Acet Token may make correction and then continue growHi folks today I'm prepared for you Act Token analytics. If we look at the chart, we can observe a clear technical picture. For a considerable amount of time, the price was tightly compressed inside a large downward wedge, defined by a robust support zone at 0.0570 - 0.0550 and a descending trend line that put consistent pressure on the price. Such long consolidation periods often precede a powerful expansion. Recently, we have witnessed a decisive breakout from this wedge, confirmed by a strong impulse candle. This move signals a clear shift in market sentiment from neutral to bullish and invalidates the prior constraining structure. I believe that the momentum from this breakout will be sufficient to challenge the next major obstacle: the horizontal resistance zone at 0.0770 - 0.0790. This is a critical level to watch, as it has previously rejected price advances. My scenario implies that after potentially a small, healthy correction or retest, the price will continue its upward movement. A successful break above this critical area would confirm the newfound strength of the buyers and open up a clear path for further appreciation. For this reason, my primary goal, the logical target for this move, is set at the 0.0880 level. If you like my analytics you may support me with your like/comment ❤️
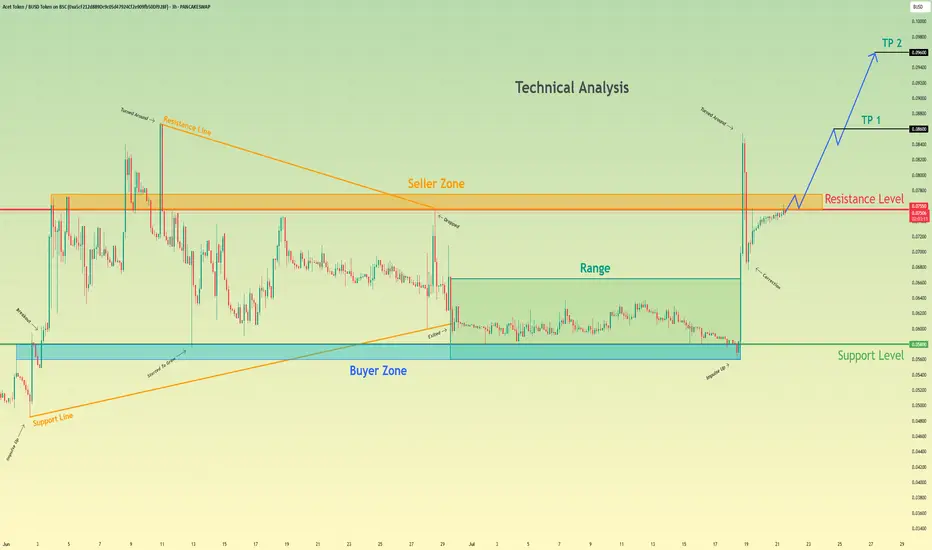
Acet Token will break resistance level and continue to move upHello traders, I want share with you my opinion about Acet Token. Looking at the recent price action, we can see a clear narrative unfolding. The asset initially formed a large wedge pattern, experiencing a trend reversal that led to a breakdown and a period of prolonged consolidation within a defined range between the buyer zone around 0.0580 and the upper boundary. Recently, however, the market showed a strong impulse, breaking out of this range and decisively moving upwards. Currently, the price of act is testing the key resistance level at 0.0755, an area historically defined as a seller zone. The hypothesis is that after this powerful impulse, the asset will manage to break and hold above this resistance. A successful retest of the 0.0755 level would likely signal a continuation of the uptrend, paving the way towards our specified take-profit targets. The first goal is set at TP 1 at 0.0860, with a further extension to TP 2 at 0.0960, capitalizing on the anticipated bullish momentum. Please share this idea with your friends and click Boost 🚀
USOIL Will Go Higher! Buy!
Take a look at our analysis for USOIL.
Time Frame: 9h
Current Trend: Bullish
Sentiment: Oversold (based on 7-period RSI)
Forecast: Bullish
The market is approaching a key horizontal level 67.303.
Considering the today's price action, probabilities will be high to see a movement to 71.215.
P.S
We determine oversold/overbought condition with RSI indicator.
When it drops below 30 - the market is considered to be oversold.
When it bounces above 70 - the market is considered to be overbought.
Disclosure: I am part of Trade Nation's Influencer program and receive a monthly fee for using their TradingView charts in my analysis.
Like and subscribe and comment my ideas if you enjoy them!
EURUSD Will Go Up! Long!
Please, check our technical outlook for EURUSD.
Time Frame: 2h
Current Trend: Bullish
Sentiment: Oversold (based on 7-period RSI)
Forecast: Bullish
The market is approaching a significant support area 1.166.
The underlined horizontal cluster clearly indicates a highly probable bullish movement with target 1.170 level.
P.S
Overbought describes a period of time where there has been a significant and consistent upward move in price over a period of time without much pullback.
Disclosure: I am part of Trade Nation's Influencer program and receive a monthly fee for using their TradingView charts in my analysis.
Like and subscribe and comment my ideas if you enjoy them!
