USOIL: Will Keep Growing! Here is Why:
The charts are full of distraction, disturbance and are a graveyard of fear and greed which shall not cloud our judgement on the current state of affairs in the USOIL pair price action which suggests a high likelihood of a coming move up.
Disclosure: I am part of Trade Nation's Influencer program and receive a monthly fee for using their TradingView charts in my analysis.
❤️ Please, support our work with like & comment! ❤️
LONG

US30 Will Move Higher! Buy!
Take a look at our analysis for US30.
Time Frame: 1h
Current Trend: Bullish
Sentiment: Oversold (based on 7-period RSI)
Forecast: Bullish
The market is testing a major horizontal structure 44,556.0.
Taking into consideration the structure & trend analysis, I believe that the market will reach 44,867.4 level soon.
P.S
Please, note that an oversold/overbought condition can last for a long time, and therefore being oversold/overbought doesn't mean a price rally will come soon, or at all.
Disclosure: I am part of Trade Nation's Influencer program and receive a monthly fee for using their TradingView charts in my analysis.
Like and subscribe and comment my ideas if you enjoy them!

EURNZD Is Bullish! Long!
Please, check our technical outlook for EURNZD.
Time Frame: 9h
Current Trend: Bullish
Sentiment: Oversold (based on 7-period RSI)
Forecast: Bullish
The market is approaching a key horizontal level 1.944.
Considering the today's price action, probabilities will be high to see a movement to 1.965.
P.S
The term oversold refers to a condition where an asset has traded lower in price and has the potential for a price bounce.
Overbought refers to market scenarios where the instrument is traded considerably higher than its fair value. Overvaluation is caused by market sentiments when there is positive news.
Disclosure: I am part of Trade Nation's Influencer program and receive a monthly fee for using their TradingView charts in my analysis.
Like and subscribe and comment my ideas if you enjoy them!

NG1! SENDS CLEAR BULLISH SIGNALS|LONG
NG1! SIGNAL
Trade Direction: long
Entry Level: 3.387
Target Level: 3.635
Stop Loss: 3.222
RISK PROFILE
Risk level: medium
Suggested risk: 1%
Timeframe: 9h
Disclosure: I am part of Trade Nation's Influencer program and receive a monthly fee for using their TradingView charts in my analysis.
✅LIKE AND COMMENT MY IDEAS✅

GBPUSD Sellers In Panic! BUY!
My dear friends,
Please, find my technical outlook for GBPUSD below:
The price is coiling around a solid key level - 1.3638
Bias - Bullish
Technical Indicators: Pivot Points Low anticipates a potential price reversal.
Super trend shows a clear buy, giving a perfect indicators' convergence.
Goal - 1.3653
About Used Indicators:
The pivot point itself is simply the average of the high, low and closing prices from the previous trading day.
Disclosure: I am part of Trade Nation's Influencer program and receive a monthly fee for using their TradingView charts in my analysis.
———————————
WISH YOU ALL LUCK

NATGAS My Opinion! BUY!
My dear followers,
This is my opinion on the NATGASnext move:
The asset is approaching an important pivot point 3.387
Bias - Bullish
Safe Stop Loss - 3.269
Technical Indicators: Supper Trend generates a clear long signal while Pivot Point HL is currently determining the overall Bullish trend of the market.
Goal - 3.630
About Used Indicators:
For more efficient signals, super-trend is used in combination with other indicators like Pivot Points.
Disclosure: I am part of Trade Nation's Influencer program and receive a monthly fee for using their TradingView charts in my analysis.
———————————
WISH YOU ALL LUCK

TESLA: Bulls Will Push
The price of TESLA will most likely increase soon enough, due to the demand beginning to exceed supply which we can see by looking at the chart of the pair.
Disclosure: I am part of Trade Nation's Influencer program and receive a monthly fee for using their TradingView charts in my analysis.
❤️ Please, support our work with like & comment! ❤️

SPY Under Pressure! SELL!
My dear friends,
Please, find my technical outlook for SPY below:
The instrument tests an important psychological level 625.36
Bias - Bearish
Technical Indicators: Supper Trend gives a precise Bearish signal, while Pivot Point HL predicts price changes and potential reversals in the market.
Target - 610.17
Recommended Stop Loss - 632.61
About Used Indicators:
Super-trend indicator is more useful in trending markets where there are clear uptrends and downtrends in price.
Disclosure: I am part of Trade Nation's Influencer program and receive a monthly fee for using their TradingView charts in my analysis.
———————————
WISH YOU ALL LUCK

USOIL Set To Grow! BUY!
My dear friends,
USOIL looks like it will make a good move, and here are the details:
The market is trading on 66.47 pivot level.
Bias - Bullish
Technical Indicators: Supper Trend generates a clear (short / long) signal while Pivot Point HL is currently determining the overall Bullish trend of the market.
Goal - 66.79
About Used Indicators:
Pivot points are a great way to identify areas of support and resistance, but they work best when combined with other kinds of technical analysis
Disclosure: I am part of Trade Nation's Influencer program and receive a monthly fee for using their TradingView charts in my analysis.
———————————
WISH YOU ALL LUCK

HelenP. I Bitcoin may correct to support level and continue growHi folks today I'm prepared for you Bitcoin analytics. If we look at the chart, the price has formed a clean upward channel after bouncing from the strong support zone at 103500 - 103000 points. This movement marked the beginning of a new bullish phase. Price continued to rise step by step, confirming the structure with higher highs and higher lows. After reaching above 110000 points, it made a minor pullback but still trades above Support 1 - 108800 points. This zone, 108800 - 108200 points, aligns well with the midline of the channel and may serve as a strong area for buyers to re-enter. The price is currently trading around 110382 points and is still respecting the channel structure. As long as BTCUSD stays above the support zone and inside the ascending channel, I expect a potential continuation toward the upper boundary. My current goal is 114000 points - near the resistance line of this bullish channel. Given the strong trendline support, clean reaction at each correction, and buyer activity on lows, I remain bullish and anticipate further growth. If you like my analytics you may support me with your like/comment ❤️
Disclaimer: As part of ThinkMarkets’ Influencer Program, I am sponsored to share and publish their charts in my analysis.

Euro can rebound up from support area to 1.1860 pointsHello traders, I want share with you my opinion about Euro. In this chart, we can see how the price has been moving confidently inside an upward channel after breaking out of a wedge formation. Previously, price consolidated within a narrowing wedge pattern above the buyer zone and broke upward, showing strong bullish momentum. That breakout initiated the current uptrend and led to the formation of a new support area. Now, price is pulling back from the resistance line of the channel and approaching this support area, which also coincides with the support line of the channel. This confluence increases the probability of a bullish reaction in this region. The structure suggests that buyers may step in around this level, preventing a deeper retracement. If the pair bounces off the support zone, I expect a continuation of the uptrend toward the upper boundary of the channel. For that reason, I set my TP at 1.1860 points, almost aligning with the resistance line of the channel. Given the current price action, the bullish structure, and strong reaction levels, I remain bullish and anticipate a rebound followed by further growth toward my target. Please share this idea with your friends and click Boost 🚀
Disclaimer: As part of ThinkMarkets’ Influencer Program, I am sponsored to share and publish their charts in my analysis.

GBPJPY Breakout and Potential RetraceHey Traders, in the coming week we are monitoring GBPJPY for a buying opportunity around 196.600 zone, GBPJPY was trading in a downtrend and successfully managed to break it out. Currently is in a correction phase in which it is approaching the retrace area at 196.600 support and resistance zone.
Trade safe, Joe.

USDJPY Is Very Bullish! Buy!
Here is our detailed technical review for USDJPY.
Time Frame: 1D
Current Trend: Bullish
Sentiment: Oversold (based on 7-period RSI)
Forecast: Bullish
The market is approaching a significant support area 144.493.
The underlined horizontal cluster clearly indicates a highly probable bullish movement with target 148.651 level.
P.S
Overbought describes a period of time where there has been a significant and consistent upward move in price over a period of time without much pullback.
Disclosure: I am part of Trade Nation's Influencer program and receive a monthly fee for using their TradingView charts in my analysis.
Like and subscribe and comment my ideas if you enjoy them!

CADCHF Is Going Up! Long!
Take a look at our analysis for CADCHF.
Time Frame: 1h
Current Trend: Bullish
Sentiment: Oversold (based on 7-period RSI)
Forecast: Bullish
The market is on a crucial zone of demand 0.583.
The oversold market condition in a combination with key structure gives us a relatively strong bullish signal with goal 0.585 level.
P.S
Please, note that an oversold/overbought condition can last for a long time, and therefore being oversold/overbought doesn't mean a price rally will come soon, or at all.
Disclosure: I am part of Trade Nation's Influencer program and receive a monthly fee for using their TradingView charts in my analysis.
Like and subscribe and comment my ideas if you enjoy them!

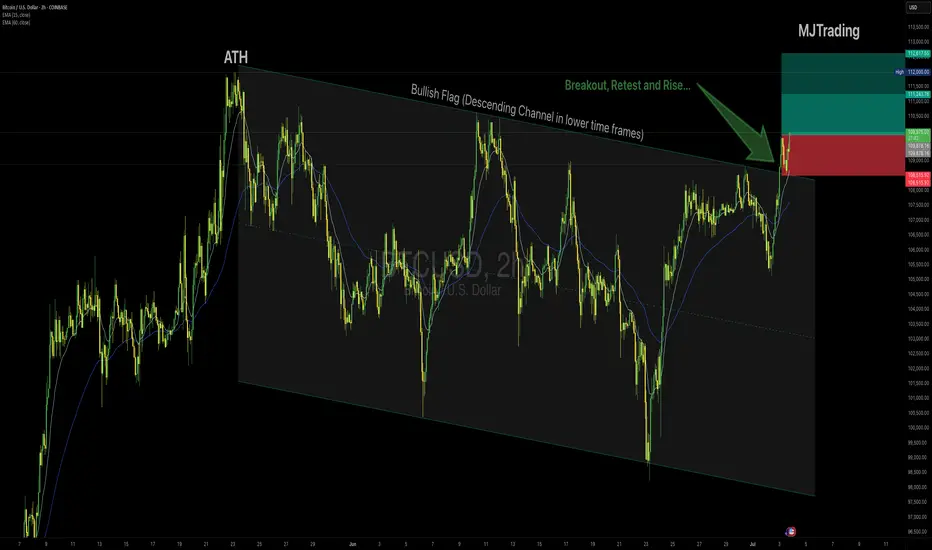
BTCUSD – Long Setup (2H Chart)👆👆🚀🚀Boost it if you like it (Thanks)🚀🚀👆👆
Idea:
Bitcoin is breaking out above the descending Flag after testing the upper boundary multiple times, showing bullish momentum confirmed by price holding above the 15 EMA and 50 EMA. The breakout aligns with strong impulse candles and sustained buying pressure.
Entry:
✅ Buy near $110,000
Stop Loss:
🔴 Below $108,500, under the breakout structure to protect against a false breakout.
Take Profit:
🟢 Tp1 $111,245
🟢 Tp2 $112,600
Rationale:
Clear breakout of the channel top resistance.
Bullish EMAs crossover with sustained slope.
Strong impulse move suggesting continuation.
Risk Management:
Position size accordingly, max risk 1–2% capital per trade.
#Bitcoin #BTCUSD #CryptoTrading #Breakout #LongSignal #TradingView #TechnicalAnalysis
multiyear breakout candidate BIOCONNext laurus like move loading in biocon
rsi strong strong price action
volume pretty cool

NZDCAD: High-Conviction Long - Fundamental Strength & TechnicalThis analysis identifies an extremely high-conviction long opportunity in the NZDCAD currency pair 📈🇨🇦🇳🇿. Our conviction is primarily driven by a significant divergence in monetary policy outlooks and economic fundamentals between New Zealand and Canada. New Zealand's economic resilience, underpinned by robust dairy prices and a less dovish central bank stance, contrasts sharply with Canada's decelerating growth, rising unemployment, and a central bank poised for further rate cuts amidst trade policy uncertainties. Technically, NZDCAD appears poised for an upward move from key support levels, supported by bullish momentum indicators on the 4-hour chart. This is a medium-term trade expected to play out over days to weeks. 🗓️
I. Fundamental Rationale: Diverging Economic Trajectories 📊🌍
The core of this trade lies in the starkly different economic paths New Zealand and Canada are currently on, creating a compelling fundamental case for NZD appreciation against CAD:
Monetary Policy Divergence:
New Zealand (NZD): The Reserve Bank of New Zealand (RBNZ) maintained its Official Cash Rate (OCR) at 3.25% in June 2025. Analysts anticipate a hold at the upcoming July 9 meeting, balancing growth concerns with an "uncomfortably high near-term inflation outlook". This signals a less aggressive easing path. 🏦🇳🇿
Canada (CAD): In contrast, the Bank of Canada (BoC) held its policy rate steady at 2.75% in June 2025, after nine consecutive 0.25% cuts since June 2024. Market expectations for the upcoming July 30, 2025 meeting indicate a 33% chance of a further 25 basis point cut, with economists anticipating gradual cuts to 2.25% by mid-2025. This clear easing bias is driven by consistently below-target inflation (1.73% in May 2025). 📉🇨🇦
Impact: This creates a clear and widening interest rate differential fundamentally favoring the NZD. 💰
Inflation Outlook:
New Zealand: Annual inflation accelerated to 2.5% in Q1 2025, exceeding market expectations and marking the highest rate since June 2024. This reinforces the RBNZ's cautious stance. ⬆️
Canada: Canada's CPI registered 1.73% in May 2025, notably below the BoC's 2.0% target, providing ample justification for further monetary easing. ⬇️
Economic Performance & Labor Market:
New Zealand: GDP is projected to grow by 1.9% in 2025. The unemployment rate remained unchanged at 5.1% in March 2025, with average hourly earnings increasing by 4.5% annually. 💼✨
Canada: Real GDP contracted by 0.1% in April 2025, with a flash estimate pointing to another 0.1% decline in May, implying an annualized loss of 0.3% in Q2 2025. The unemployment rate rose to 7.0% in May 2025, its highest since September 2016 (excluding pandemic years). 📉🏭
Impact: New Zealand demonstrates greater economic resilience and a more stable labor market. 💪
Commodity & Trade Dynamics:
New Zealand: Benefits significantly from surging dairy prices, its top export commodity, which saw a substantial 10% increase in Q1 2025, with Fonterra forecasting record milk prices and production volumes. This contributed to a robust monthly trade surplus of $1.2 billion in May 2025. 🥛🧀💰
Canada: While the CAD maintains a strong positive correlation with oil prices, energy exports decreased by 5.6% in May, with crude oil exports falling 4.0%. Furthermore, Canadian exports to the US have declined for four consecutive months due to ongoing US tariffs. 🛢️📉
Impact: Strong commodity tailwinds and a healthy trade surplus for NZD, versus tariff-induced headwinds and declining energy exports for CAD. 🌬️
Yield Differential: The New Zealand 10-year government bond yield (4.57% as of June 30, 2025) is notably higher than Canada's (3.38% as of July 3, 2025). This provides a positive carry for holding NZD over CAD. 📊
II. Technical Rationale: Chart Insights (4-Hour Timeframe) 📈🔍
The technical picture on the 4-hour chart supports a bullish reversal from current levels, complementing the fundamental outlook:
Current Price Action & Long-Term Trend: NZDCAD is currently approximately 0.8277 (as of July 1, 2025). While short-term analyses may show a "sharp bearish trend," the pair is described as "trading in an uptrend and currently is in a correction phase" as it approaches a key support area. The 1-month change for NZDCAD is +0.13%, and year-to-date is +2.45%, indicating a longer-term bullish bias despite recent fluctuations. This corrective dip presents a favorable entry point. 📉➡️📈
Key Support & Resistance Levels:
Entry Point (0.8270) is strategically chosen near the immediate support cluster, specifically around the Pivot Point 1st Support of 0.8276 and an identified buying opportunity zone around 0.82700. ✅
Take Profit (TP) of 0.8350 is positioned just below the Pivot Point 3rd Level Resistance of 0.8356. 🎯
Stop Loss (SL) of 0.8220) is carefully placed below the key support levels of 0.8240 (Pivot Point 3rd Support) and 0.8236 (Pivot Point 3rd Support). A sustained break below this level would invalidate the bullish thesis. 🛑
Momentum Indicators:
RSI (14): The 14-day RSI for NZDCAD is around 41.78 to 54.33, suggesting a neutral to slightly bullish sentiment, with room for upward movement. 📊
MACD (12, 26, 9): A "bullish divergence" has been identified on the hourly timeframe, often signaling a return of buying interest. The MACD line is also observed to be slightly above its signal line, hinting at a potential bullish crossover. ⬆️
Moving Averages: The 50-day Simple Moving Average (SMA) is positioned slightly above the 200-day Exponential Moving Average (EMA). This configuration suggests a potential bullish crossover of longer-term moving averages, generally considered a positive long-term signal. 📈
III. Trade Setup: 📋✨
Currency Pair: NZDCAD 🇳🇿🇨🇦
Direction: Long (Buy) ⬆️
Entry Point: 0.8270
Take Profit (TP): 0.8350
Stop Loss (SL): 0.8220
Calculated Risk (in pips): 50 pips
Calculated Reward (in pips): 80 pips
Risk-Reward Ratio: Approximately 1.6:1 (A favorable ratio for a high-probability setup!) ✅
Key Considerations: Always adhere to strict risk management principles, risking no more than 1-2% of your total trading capital on this single trade. Be mindful of potential volatility around upcoming high-impact economic events in July, particularly the RBNZ and Bank of Canada interest rate decisions, and inflation data. 🗓️🔔

USDCAD: Long Signal with Entry/SL/TP
USDCAD
- Classic bullish formation
- Our team expects growth
SUGGESTED TRADE:
Swing Trade
Buy USDCAD
Entry Level - 1.3605
Sl - 1.3575
Tp - 1.3668
Our Risk - 1%
Start protection of your profits from lower levels
Disclosure: I am part of Trade Nation's Influencer program and receive a monthly fee for using their TradingView charts in my analysis.
❤️ Please, support our work with like & comment! ❤️

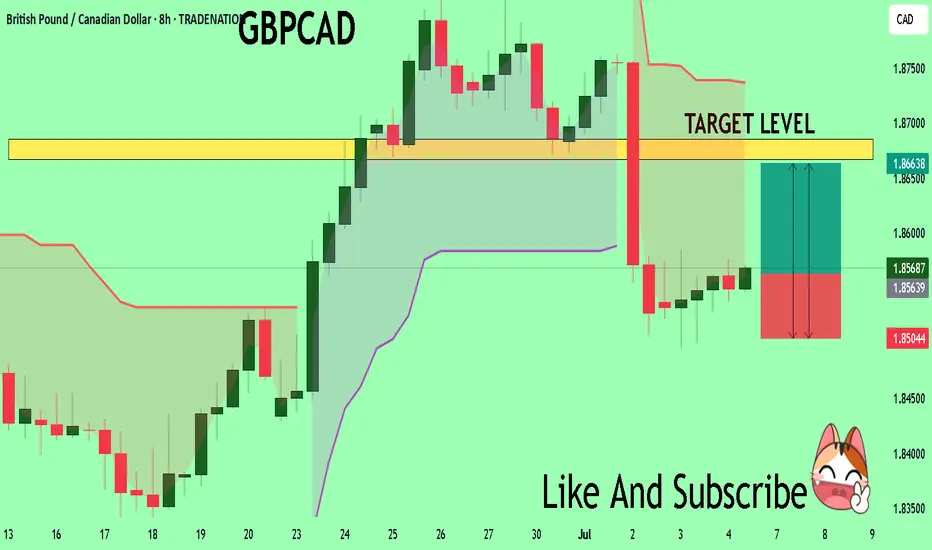
GBPCAD Will Explode! BUY!
My dear followers,
I analysed this chart on GBPCAD and concluded the following:
The market is trading on 1.8563 pivot level.
Bias - Bullish
Technical Indicators: Both Super Trend & Pivot HL indicate a highly probable Bullish continuation.
Target - 1.8667
Safe Stop Loss - 1.8504
About Used Indicators:
A super-trend indicator is plotted on either above or below the closing price to signal a buy or sell. The indicator changes color, based on whether or not you should be buying. If the super-trend indicator moves below the closing price, the indicator turns green, and it signals an entry point or points to buy.
Disclosure: I am part of Trade Nation's Influencer program and receive a monthly fee for using their TradingView charts in my analysis.
———————————
WISH YOU ALL LUCK
NZDCAD: Market of Buyers
Our strategy, polished by years of trial and error has helped us identify what seems to be a great trading opportunity and we are here to share it with you as the time is ripe for us to buy NZDCAD.
Disclosure: I am part of Trade Nation's Influencer program and receive a monthly fee for using their TradingView charts in my analysis.
❤️ Please, support our work with like & comment! ❤️

AUDUSD: Bullish Continuation is Expected! Here is Why:
The recent price action on the AUDUSD pair was keeping me on the fence, however, my bias is slowly but surely changing into the bullish one and I think we will see the price go up.
Disclosure: I am part of Trade Nation's Influencer program and receive a monthly fee for using their TradingView charts in my analysis.
❤️ Please, support our work with like & comment! ❤️

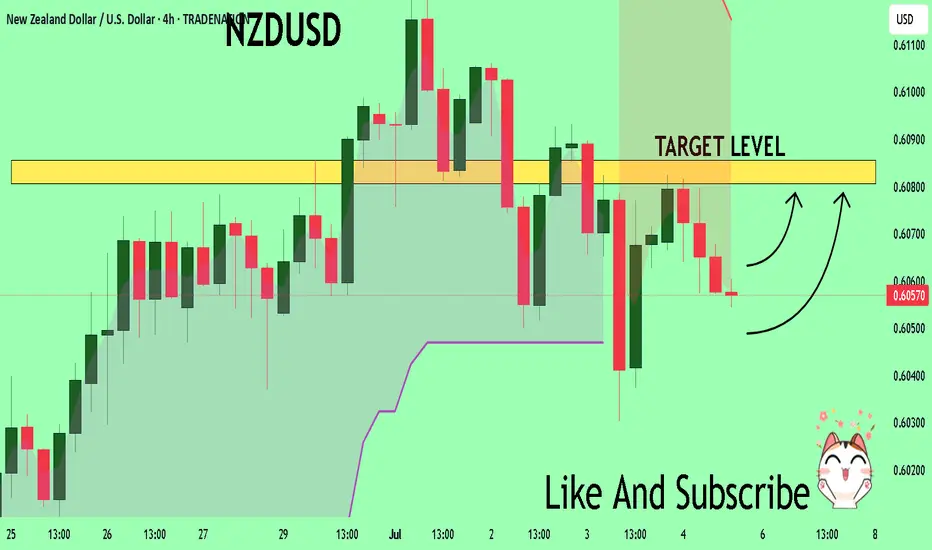
NZDUSD The Target Is UP! BUY!
My dear subscribers,
This is my opinion on the NZDUSD next move:
The instrument tests an important psychological level 0.6056
Bias - Bullish
Technical Indicators: Supper Trend gives a precise Bullish signal, while Pivot Point HL predicts price changes and potential reversals in the market.
Target - 0.6080
About Used Indicators:
On the subsequent day, trading above the pivot point is thought to indicate ongoing bullish sentiment, while trading below the pivot point indicates bearish sentiment.
Disclosure: I am part of Trade Nation's Influencer program and receive a monthly fee for using their TradingView charts in my analysis.
———————————
WISH YOU ALL LUCK
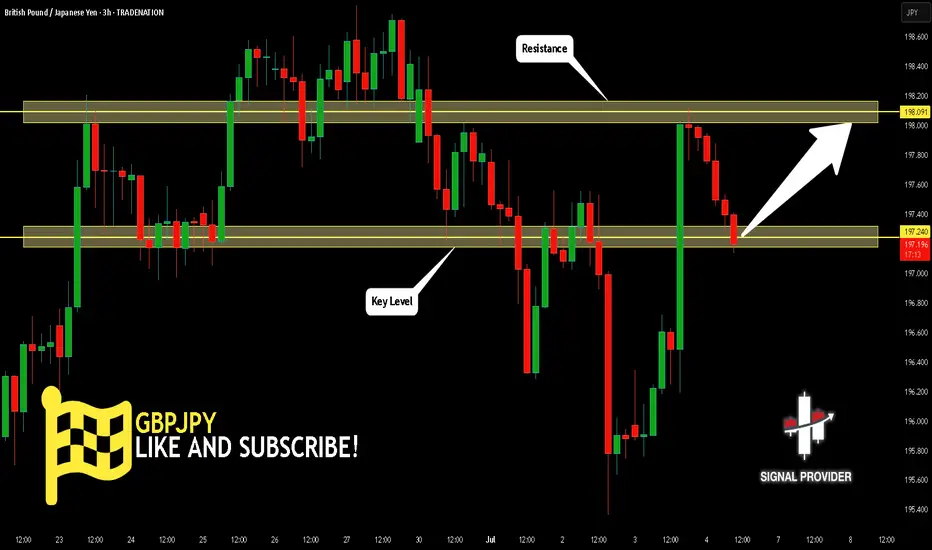
GBPJPY Will Go Up! Buy!
Please, check our technical outlook for GBPJPY.
Time Frame: 3h
Current Trend: Bullish
Sentiment: Oversold (based on 7-period RSI)
Forecast: Bullish
The market is approaching a key horizontal level 197.240.
Considering the today's price action, probabilities will be high to see a movement to 198.091.
P.S
Please, note that an oversold/overbought condition can last for a long time, and therefore being oversold/overbought doesn't mean a price rally will come soon, or at all.
Disclosure: I am part of Trade Nation's Influencer program and receive a monthly fee for using their TradingView charts in my analysis.
Like and subscribe and comment my ideas if you enjoy them!