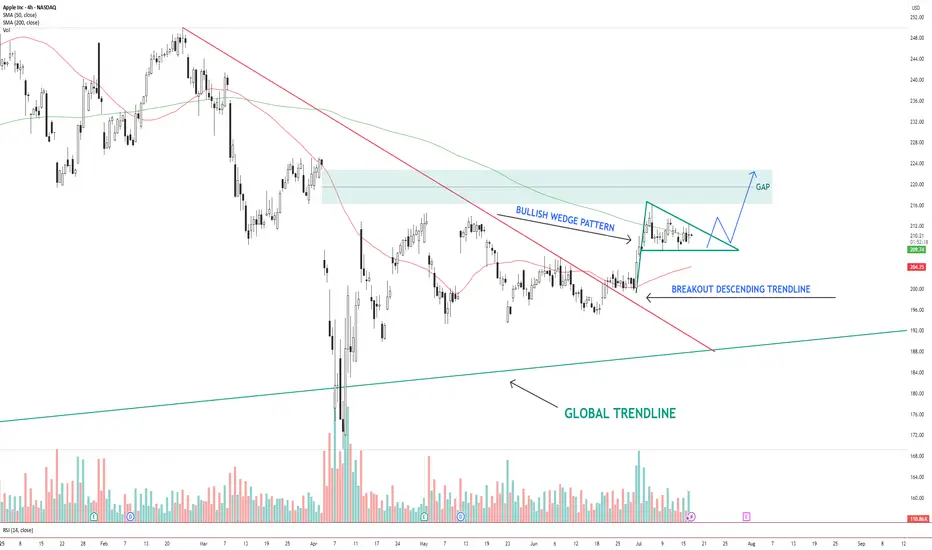
AAPL – Bullish Wedge Breakout Setup Toward Gap FillAAPL NASDAQ:AAPL has broken out of a descending trendline and is now consolidating inside a bullish wedge pattern . Price is holding above the 200 SMA and hovering near the 50 SMA.
The structure suggests a potential breakout above the wedge, with a clear gap area between $216–$224 acting as the next upside target.
Key levels:
Support: $206 (wedge base / 50 SMA)
Resistance: $216–$224 (gap zone)
Trend structure: Bullish consolidation after breakout
A clean breakout from the wedge with volume could trigger a continuation move toward the gap zone.
📌 Watching for confirmation and potential entry on a breakout + retest.
This is not financial advice. Always do your own research.
Longposition
uptrend, heading towards 3400⭐️GOLDEN INFORMATION:
Gold prices (XAU/USD) climb toward $3,350 in early Asian trading on Tuesday, supported by renewed safe-haven demand after US President Donald Trump threatened sweeping 100% tariffs on Russia. Traders now shift focus to the upcoming US Consumer Price Index (CPI) report, which could offer further cues for the Federal Reserve’s policy outlook.
Late Monday, Trump warned that unless Russian President Vladimir Putin agrees to a peace deal to end the Ukraine conflict within 50 days, the US will impose 100% tariffs on Russian goods. The proposed sanctions, described as secondary tariffs, lack detailed clarification but have already fueled market anxiety. Heightened geopolitical tensions are likely to sustain near-term demand for gold as investors seek safety in the yellow metal
⭐️Personal comments NOVA:
Maintaining buying pressure above 3350, gold price in an uptrend, paying attention to CPI results to assess the inflation level of the world's number 1 economy
⭐️SET UP GOLD PRICE:
🔥SELL GOLD zone: 3400- 3402 SL 3407
TP1: $3390
TP2: $3380
TP3: $3370
🔥BUY GOLD zone: $3330-$3328 SL $3323
TP1: $3340
TP2: $3350
TP3: $3360
⭐️Technical analysis:
Based on technical indicators EMA 34, EMA89 and support resistance areas to set up a reasonable BUY order.
⭐️NOTE:
Note: Nova wishes traders to manage their capital well
- take the number of lots that match your capital
- Takeprofit equal to 4-6% of capital account
- Stoplose equal to 2-3% of capital account

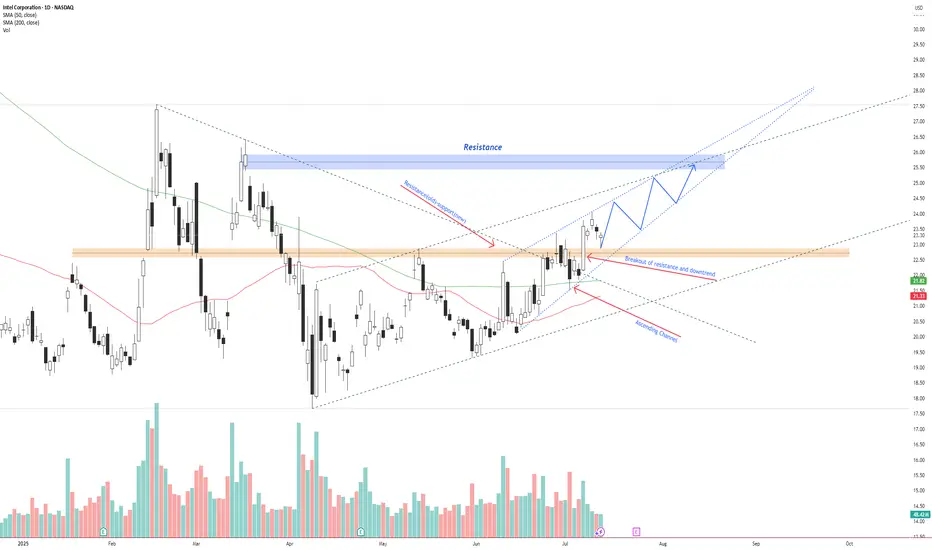
INTC – Breakout Confirmed, Bullish Continuation Inside AscendingIntel NASDAQ:INTC has broken above previous resistance and a descending trendline, confirming a bullish reversal.
Price is currently respecting an ascending channel and forming higher highs and higher lows. The breakout retest around $22.50 has held as new support.
If the current structure remains intact, price could continue toward the $26.00–$26.50 resistance zone. A breakout above this zone opens the door for a move toward $28+.
Key levels:
Support: $22.50 (previous resistance)
Resistance: $26.00–$26.50
Trend structure: Bullish channel
Volume supports the trend, and price is trading above both the 50 SMA and 200 SMA.
📌 Watching for a pullback and continuation move inside the channel.
This is not financial advice. Always do your own research.
Golden Bitcoin Signal: A Great Investment Opportunity🔔 Our Bitcoin Investment Bot has issued an exclusive signal! This signal, backed by 15 years of historical data analysis, marks the perfect time to enter the market. 🎯 Take Profit Target: $120,975 (equivalent to a potential 50.5% profit)
⚖️ Professional Risk Management: This signal comes with a Stop Loss at $66,835 (16.8% risk), offering an ideal balance of profit and risk. Our bot, with its advanced and data-driven strategies, identifies the most valuable investment opportunities.
⏳ Opportunities don’t last forever! This signal could be the start of a significant move. Now is the best time to act and take advantage of this precise analysis. With our bot, you’re one step closer to sustainable profitability. 🌟

recovery, towards 3400, gold price⭐️GOLDEN INFORMATION:
Gold prices (XAU/USD) extended their gains to around $3,365 during the early Asian session on Monday, as investors flocked to safe-haven assets in response to an escalation in global trade tensions.
The move comes after US President Donald Trump intensified the trade war over the weekend, announcing a 30% tariff on imports from the European Union and Mexico, effective August 1. This followed last week’s declarations of a 35% duty on Canadian goods and a sweeping 15%–20% tariff proposal on most trading partners, in addition to a 50% tariff on copper imports. Mounting concerns over the economic fallout from these aggressive trade measures have fueled demand for gold, a traditional refuge during times of uncertainty.
⭐️Personal comments NOVA:
Continued price increase, tariff pressure helps gold to be positive again
⭐️SET UP GOLD PRICE:
🔥SELL GOLD zone: 3384- 3386 SL 3391
TP1: $3376
TP2: $3364
TP3: $3352
🔥BUY GOLD zone: $3308-$3310 SL $3303
TP1: $3319
TP2: $3328
TP3: $3340
⭐️Technical analysis:
Based on technical indicators EMA 34, EMA89 and support resistance areas to set up a reasonable BUY order.
⭐️NOTE:
Note: Nova wishes traders to manage their capital well
- take the number of lots that match your capital
- Takeprofit equal to 4-6% of capital account
- Stoplose equal to 2-3% of capital account

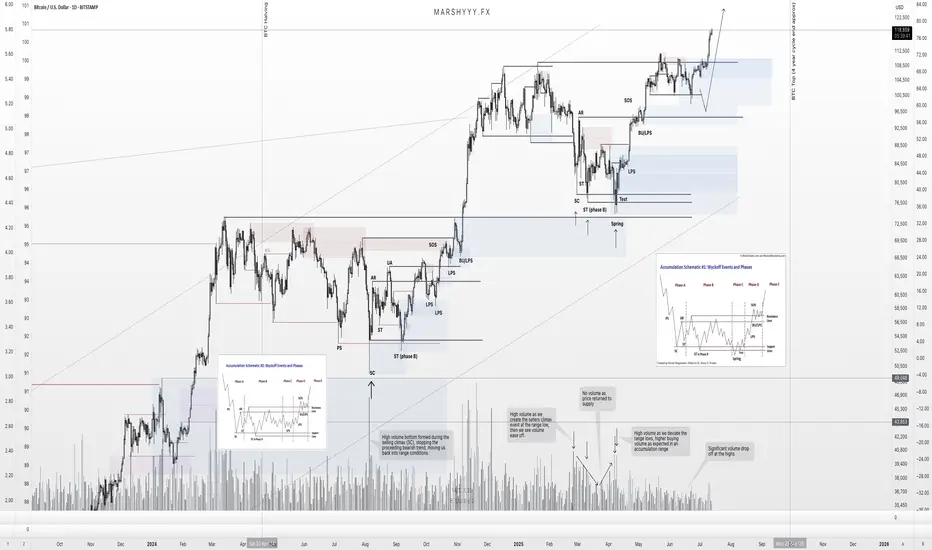
BTC – Textbook Pullback. New ATHs. What’s Next?Back in mid-June, I published a BTC update calling for a local correction into HTF demand while most were screaming bear market and waiting for deeper breakdowns.
Price action played out exactly as forecasted.
BTC swept the $100k swing low, front-ran my first demand zone by $400, and launched into a powerful reversal — just like it did back in April, where it also front-ran the key HTF demand before rallying.
That move took us straight into new all-time highs (ATHs) — now trading comfortably around $118k.
🧠 What Happened?
✅ Liquidity sweep of the prior low
✅ Front-run demand zone (perfect HTF structure)
✅ Strong bullish reaction and higher high
✅ Confluence from USDT.D rejection at 5.25%
✅ Alts showing signs of strength as BTC rallies
The entire setup aligned perfectly across BTC, USDT.D, TOTAL, and OTHERS.D — all of which I’ve been tracking in tandem.
🔮 What Now?
With BTC now in price discovery, I expect continuation higher — but not without the possibility of a short-term pullback.
📉 A potential retest of the $108k zone isn’t off the table. This level aligns with:
- Prior breakout structure
- Range high retest
- Local demand before continuation
But even if we go straight up — I remain HTF bullish into the final phase of this cycle, supported by:
- USDT.D structure still bearish
- BTC.D showing signs of distribution
- ETH.D and OTHERS.D gaining momentum
- Altseason rotation already starting to pick up
🧭 The Macro Outlook
The 4-year cycle projection still points to a Q3 2025 top — likely between August late and September based on historical cycle timing, but this could deviate.
That gives us a window of 2–3 months for this final leg to unfold — and it’s already in motion.
Stay focused. Stick to your plan. Ride the trend, don’t chase it.
Let me know what levels you're watching next, and whether you think we get that $108k retest — or we go vertical from here.
1D:
3D:
4D:
1W:
1M:
— Marshy 🔥
short recovery, trend line✍️ NOVA hello everyone, Let's comment on gold price next week from 07/14/2025 - 07/18/2025
⭐️GOLDEN INFORMATION:
Gold prices surged nearly 1% on Friday as market sentiment soured in response to US President Donald Trump’s controversial trade policies targeting Canada, while hinting at broader tariffs on other nations and copper. At the time of writing, XAU/USD is trading at $3,354, rebounding from intraday lows of $3,322.
On Thursday, Trump announced a 35% tariff on Canadian imports, though goods complying with the 2020 USMCA trade agreement remain exempt. He also signaled intentions to expand tariffs across most trading partners, proposing blanket rates ranging from 15% to 20%.
With a light US economic calendar, attention turned to Fed commentary. Chicago Fed President Austan Goolsbee pushed back on calls for rate cuts aimed at reducing government borrowing costs, stressing the central bank’s focus remains firmly on employment and price stability.
⭐️Personal comments NOVA:
growth according to the trend, maintaining the accumulation price zone above 3300
🔥 Technically:
Based on the resistance and support areas of the gold price according to the H4 frame, NOVA identifies the important key areas as follows:
Resistance: $3392, $3447
Support: $3330, $3308, $3246
🔥 NOTE:
Note: Nova wishes traders to manage their capital well
- take the number of lots that match your capital
- Takeprofit equal to 4-6% of capital account
- Stoplose equal to 2-3% of capital account
- The winner is the one who sticks with the market the longest

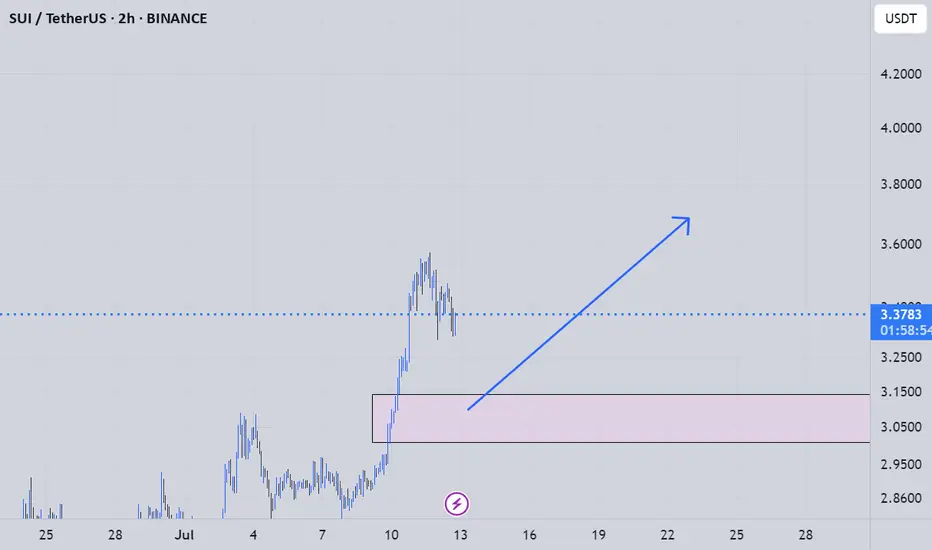
suiusdt long analysyou can use this analys for your spot trades its a longsetup for making a good profit and a getting on a big trend
UBER longBroken long term resistance, retested, and once again pushed 20 day Donchian Channel.
Turtles are coming out of their shells taking UBER to the new ATHs.
Long term hold.

Britania Notable Fluctuations In the last few days, Britannia's stock has experienced notable fluctuations, driven by market sentiment and recent earnings reports.
Following a positive outlook from analysts, the stock saw a brief rally, fueled by strong consumer demand and effective cost management strategies.
However, profit-taking and broader market trends led to slight pullbacks.
Overall, the stock remains a focus for investors watching for further developments in the FMCG sector and its ongoing recovery post-pandemic.
Buy at 5869
SL 1:- 5848
SL 2:- 5827
TGT1 :- 5910
TGT2:- 5980

Uber’s Path to $95+Uber Technologies (UBER) is positioning itself for long-term growth by expanding beyond its core ride-hailing and delivery businesses into advertising, travel, service partnerships, and autonomous vehicle (AV) technology. These strategic moves aim to diversify revenue streams and enhance operational efficiency.
Key Growth Drivers:
- Strong Core Business Performance – Uber continues to benefit from robust demand in both ride-hailing and delivery, generating significant economic profit.
- Artificial Intelligence Integration – AI plays a crucial role in optimizing pricing, reducing wait times, personalizing user experiences, and preventing fraud.
- Autonomous Vehicle Expansion – Uber is increasingly leveraging AV technology to reduce driver-related costs and scale its services.
- Strategic Investments – The company is using its strong cash flow to fund innovation, product development, acquisitions, and minority investments, driving long-term value.
- Capital-Efficient Growth – Uber’s ability to expand its service platform with minimal capital investment is expected to accelerate revenue growth and shareholder value creation.
Price Target & Options Flow:
Tigress Financial has raised Uber’s price target from $103 to $110, maintaining a Buy rating. Additionally, option flow on Uber is showing strong bullish activity, suggesting institutional interest. Given this momentum, Uber could potentially surpass $95 before August, especially if AV advancements and AI-driven efficiencies continue to strengthen its financial outlook

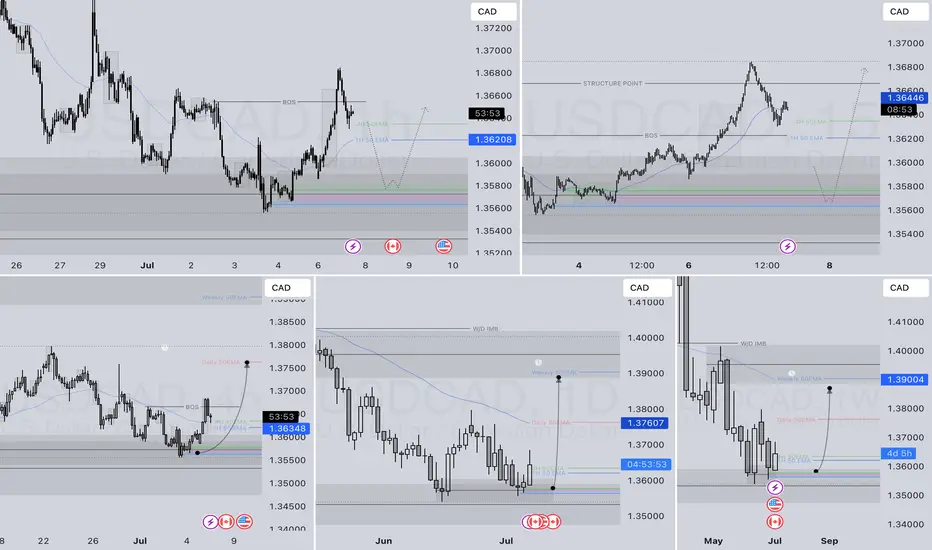
USDCAD LONG DAILY FORECAST Q3 W28 Y25USDCAD LONG DAILY FORECAST Q3 W28 Y25
Professional Risk Managers👋
Welcome back to another FRGNT chart update📈
Diving into some Forex setups using predominantly higher time frame order blocks alongside confirmation breaks of structure.
Let’s see what price action is telling us today! 👀
💡Here are some trade confluences📝
✅Daily Order block identified
✅4H Order Block identified
✅1H Order Block identified
🔑 Remember, to participate in trading comes always with a degree of risk, therefore as professional risk managers it remains vital that we stick to our risk management plan as well as our trading strategies.
📈The rest, we leave to the balance of probabilities.
💡Fail to plan. Plan to fail.
🏆It has always been that simple.
❤️Good luck with your trading journey, I shall see you at the very top.
🎯Trade consistent, FRGNT X
BTC/USDT Back Test Perhaps it's not surprising to say that I see a chance to put the $99,000 zone back in the test. Just because of the FVG. Even if it doesn't happen, I see an upward trend now.

AMGN : Long with Good RR We are above the 200-period moving average on the 1-hour chart.
And the trend line has been broken.
There is a good risk - reward ratio. Approximately : 2.48
Small position sizes can be tried.
Entry : 287.38 (Now)
Stop - Loss : 276.28
Take Profit Level : 315.0
Regards.

CORZ : Long Position with 2.5 Risk Reward RatioOur stock is trading on 50 and 200 period moving averages. (Timeframe : 1H)
Our first target level could be the level where the gap closes.
Stop - Loss can be placed around the 200 period moving average. Summary in light of this brief information:
Risk/Reward Ratio : 2.51
Stop-Loss : 15.95
Take Profit Level : 11.745
Edit : Sorry, I couldn't pull down the end of the trend line, so it was a slightly crooked trend line, but it doesn't ruin the main idea.
Regards.

BTCUSDT Technical Outlook TC is trading at $106k , with resistance confirmed near $106.14k–$106.22k and support at $104.8k .
A daily drop below $104.8k would confirm a short setup. Conversely, a break above $106.2k on elevated volume is required to challenge the $107k–$108k zone.
Absent significant volume, expect continued sideways action between $105k–$106k.

Middle East War - Gold Price Increases✍️ NOVA hello everyone, Let's comment on gold price next week from 06/23/2025 - 06/27/2025
⭐️GOLDEN INFORMATION:
Gold prices held steady on Friday, hovering near $3,369 and on track to post a weekly loss of nearly 1.90%, as markets digested US President Donald Trump’s decision to forgo immediate military action against Iran in favor of a diplomatic approach. At the time of writing, XAU/USD is down 0.11%.
While easing geopolitical tensions helped lift risk sentiment, additional pressure on gold emerged from concerns over potential US restrictions on allies operating semiconductor plants in China, as reported by Bloomberg. Trump's restraint on Iran encouraged a risk-on tone, weighing on the appeal of the safe-haven metal.
⭐️Personal comments NOVA:
Middle East tensions escalate, gold prices continue to recover above 3400, early next week
🔥 Technically:
Based on the resistance and support areas of the gold price according to the H4 frame, NOVA identifies the important key areas as follows:
Resistance: $3395, $3448
Support: $3302, $3256
🔥 NOTE:
Note: Nova wishes traders to manage their capital well
- take the number of lots that match your capital
- Takeprofit equal to 4-6% of capital account
- Stoplose equal to 2-3% of capital account
- The winner is the one who sticks with the market the longest

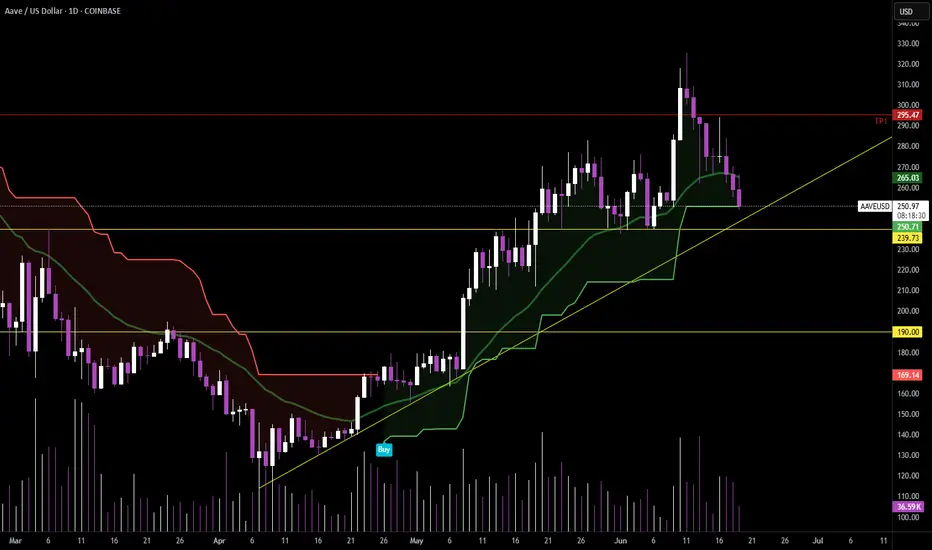
Scaling back into $AAVE – 3x Leverage Setup📍Entry zone: $250 → $240 (scaled)
📍Support confluence:
• Daily Supertrend touch
• Rising trendline support
• Major horizontal level near $240
🛑 Stop Loss:
• 5% price move (→ $232.75 avg) = 15% capital loss at 3x
• Or Daily Supertrend flip (closes in ~9 hours)
🎯 TP1: $295 (trim 33%)
🎯 TP2: $372 (full exit)
⚖️ R/R Ratio: 8.29
• ✅ Reward: +124%
• ❌ Risk: -15%
Just booked +133% on the last one. Back in—structure’s still bullish until it’s not.
Accumulate around 3400, Keep interest rate today⭐️GOLDEN INFORMATION:
Gold prices slipped below the $3,400 threshold on Tuesday, weighed down by renewed strength in the US Dollar (USD), despite a worsening global risk sentiment. The resilience of the greenback limited gains in the safe-haven asset, though mounting tensions between Israel and Iran continue to offer underlying support. At the time of writing, XAU/USD is trading at $3,380, down 0.05%.
Although risk appetite remains subdued, gold has struggled to rally, as the US Dollar regains ground. The US Dollar Index (DXY), which measures the currency against a basket of six major peers, climbed 0.46% to 98.58.
Meanwhile, geopolitical tensions intensified after US President Donald Trump abruptly departed the G7 summit in Canada on Monday in response to unfolding events in the Middle East. In a stark warning posted to his social platform, he urged, “Everyone should immediately evacuate Tehran,” signaling a sharp escalation in the conflict that began last Friday.
⭐️Personal comments NOVA:
Gold price is moving in accumulation zone below 3400 - 3365. Break and return above 3400, continue to accumulate.
⭐️SET UP GOLD PRICE:
🔥SELL GOLD zone: 3437- 3439 SL 3444
TP1: $3425
TP2: $3410
TP3: $3395
🔥BUY GOLD zone: $3338-$3340 SL $3333
TP1: $3346
TP2: $3355
TP3: $3370
⭐️Technical analysis:
Based on technical indicators EMA 34, EMA89 and support resistance areas to set up a reasonable BUY order.
⭐️NOTE:
Note: Nova wishes traders to manage their capital well
- take the number of lots that match your capital
- Takeprofit equal to 4-6% of capital account
- Stoplose equal to 2-3% of capital account

EURAUD Potential Longs - Technical Outlook 17.06.2025Overall Trend & Context:
FX:EURAUD has been in an overall uptrend since mid May when price reacted off a daily demand level.
Technical Findings:
Price is currently trading just above the discount (equilibrium).
Would prefer to see it drop into the discount area - There are areas of demand on the 1h chart which we could possibly consider however the 4h demand shown on the chart above qualifies as a STRONG zone to trade from.
Notes:
If we see a 15m shift in structure it may be worth getting involved.

RGTI : First Long Position AreaNASDAQ listed Rigetti Computing Inc. stock is currently trading above the 50 and 200 period moving averages.
Once it gained momentum, it later lost it but its outlook is not weak at the moment.
Right now, if the Iran-Israel war uncertainty is overcome and if there is no bad news affecting the index, the gap may close.
Risk/Reward ratio of 3.00 is a very valuable ratio to try with small position amounts.
Risk/Reward Ratio : 3.00
Stop-Loss : 9.91
Take-Profit : 18.2
Regards.

Can gold price maintain the uptrend above 3400?⭐️GOLDEN INFORMATION:
Gold prices advanced by approximately 0.97% on Wednesday, buoyed by signs of easing inflation in the United States (US), which reinforced expectations that the Federal Reserve (Fed) could resume rate cuts as early as September. At the time of writing, XAU/USD is trading around $3,363.
The May Consumer Price Index (CPI) report shows a slowdown in price pressures compared to April, prompting a surge in demand for the yellow metal. In response, gold briefly rallied to an intraday high near $3,360 before paring back some of those gains, as investors recalibrated their outlook on the Fed’s policy path.
⭐️Personal comments NOVA:
Middle East concerns, along with information about influential high tariffs on countries without trade agreements. Gold prices have recovered, but there is no long-term stability.
⭐️SET UP GOLD PRICE:
🔥SELL GOLD zone: 3428- 3430 SL 3435
TP1: $3410
TP2: $3395
TP3: $3382
🔥BUY GOLD zone: $3345-$3343 SL $3338
TP1: $3355
TP2: $3367
TP3: $3380
⭐️Technical analysis:
Based on technical indicators EMA 34, EMA89 and support resistance areas to set up a reasonable BUY order.
⭐️NOTE:
Note: Nova wishes traders to manage their capital well
- take the number of lots that match your capital
- Takeprofit equal to 4-6% of capital account
- Stoplose equal to 2-3% of capital account

Baby Doge is ready for a pumpBaby Doge is ready for a pump, but I feel it needs to form an inverse head and shoulders pattern and experience a price surge.
Set a buy order.
