XAUUSD – Downtrend Continues as USD StrengthensGold remains under significant pressure as the U.S. dollar continues to gain strength following a series of positive economic data from the U.S. Specifically, GDP grew by 2.5%, beating expectations, while ADP Non-Farm Employment data also came in strong. This suggests the U.S. economy remains resilient, supporting the Fed's hawkish stance and keeping the dollar strong.
On the 4H chart, XAUUSD has broken below the previous ascending price channel and is now trading under the 3,340.400 resistance zone – an area packed with unfilled FVGs. The current price structure leans bearish, with any rebounds likely to be temporary pullbacks.
If USD strength continues, gold could drop further toward the support zone at 3,279.200 or even lower near 3,240.
Trading Strategy: Focus on SELL
Entry: Around 3,325 – 3,340.400 upon price rejection signals.
Target: 3,279.200 or lower.
Stop-loss: Above 3,342.459
Longsetup

Accumulate waiting for btc price increase💎 BTC PLAN UPDATE – End of July (31/07)
📊 BTC Technical Analysis (4H Timeframe – End of July)
✅ Positive Signals:
• BTC has broken out of the consolidation triangle pattern (blue diagonal line), indicating a potential strong uptrend.
• The current price is retesting the breakout support zone around 117,800–118,000 → showing a good reaction and creating upward momentum.
• MA50 and MA200 are starting to slope upwards → confirming increasing buying strength.
📈 Bullish Scenario:
• If BTC holds above 118,000, it is likely to move toward the nearest resistance zone at 119,900.
• After breaking 119,900, the next targets are:
→ 122,792 (Fibonacci 1.618)
→ Further target: 127,900 (Fibonacci 2.618)
🛑 Risk Note:
• If the price drops below 117,000, it’s important to monitor again, as it may retest a deeper support zone around 114,500.

BTC defies expectations –Absorbs 9 billion USD, aiming for 130K?BTCUSDT maintains its bullish momentum despite Galaxy Digital offloading 80,000 BTC (worth ~9 billion USD). Price only saw a slight dip before bouncing back quickly, signaling strong demand and a more mature market sentiment.
Citi analysts point to ETF inflows and retail participation as the primary drivers of BTC’s rally, even as investors remain cautious ahead of the Fed’s rate decision.
On the daily chart, BTC continues to trade within an ascending channel, with the 116,200 zone acting as a potential buy area on any pullback. The next target is set at 129,500 USDT, aligning with the channel’s upper boundary and technical resistance.
Suggested strategy: Look to buy near 116,200–117,000. Target 129,500. Stop-loss below 115,000.

XAUUSD – Downtrend Confirmed, Bears in ControlOn the H4 timeframe, gold has completely broken its short-term uptrend structure and formed a series of lower highs and lower lows. Every bounce is rejected at the strong resistance zone of 3,326 – 3,333 USD, confirming the clear downtrend.
Although the recently released Core PCE index was lower than expected, this is not enough to drive a recovery as other data, such as the Employment Cost Index and statements from the Fed, still show persistent inflationary pressure. Therefore, the monetary policy remains hawkish, causing money to flow out of gold.
Currently, the price is approaching the critical support zone of 3,247. If this level is broken, the scenario of further declines to 3,192 is entirely possible.

GBPJPY – Losing control zone, downtrend taking shapeGBPJPY is still trading within a long-term ascending price channel. However, what’s concerning is that recent price action has broken out of the previously established price box – which had acted as a stabilizing structure for the uptrend. Buyers failed to maintain momentum, repeatedly getting rejected at the top of the box.
Currently, GBPJPY is showing signs of breaking below the short-term support inside the price box, raising the risk of a deeper correction toward the lower boundary of the channel. A “lower high” structure is clearly forming, confirming that selling pressure is taking over.
From a news perspective, the Japanese yen is gaining strength as risk-off sentiment increases, while the pound is losing ground due to cautious tones from the Bank of England following a string of weak economic data. This shift is weakening GBP's appeal and could accelerate the bearish trend.
Strategy:
Wait to SELL if price pulls back to the former resistance zone within the price box and shows rejection signals. The downtrend will be confirmed if the recent low is broken. Stay out if there’s no clear confirmation.
What do you think will happen next with GBPJPY?

LONG ON EUR/USDEUR/USD is currently at a major demand level after sweeping sell side liquidity.
The Dxy (Dollar) is overall bearish. I expect the dollar to fall and EUR/USD to rise to the previous high / supply level for over 200-300 pips.
News most likely will affect this pair in terms of volatility.

EURUSD plunges without brakes – The bears take full control!EURUSD continues its steep decline as both macroeconomic and technical pressures mount. A trade deal unfavorable to the EU, combined with the Fed’s hawkish stance, has fueled USD strength and dragged the euro sharply lower. At the same time, strong U.S. labor data and rising employment costs further reinforce the bearish outlook.
On the H1 chart, EURUSD is clearly moving within a descending channel. Key price zones have been broken with no significant bullish reaction, indicating that sellers remain firmly in control. The market is heading toward a psychological support area, with no signs of reversal as RSI stays weak.
I remain biased toward SELL setups on any short-term pullbacks, avoiding countertrend trades in this environment. If downside momentum continues, deeper targets may still be ahead.
In a market dominated by bearish sentiment, trading with the trend remains the smartest and safest approach.

EURUSD – German GDP boosts EUR, but USD still holds the reins Germany’s recently released GDP data exceeded expectations, acting as a catalyst for EURUSD to rebound after a steep decline. However, this upward move remains fragile, as the USD continues to dominate the market—especially with several key U.S. economic reports set to be released later this week.
On the chart, EURUSD has just bounced from the 1.15000 support zone, which has historically served as a strong floor. If the price holds above this level and breaks the downtrend line, the short-term target could move toward the 1.15700 resistance zone.
Still, the path ahead won’t be easy. The market is closely watching upcoming U.S. data, such as the jobs report and the Core PCE index—the Fed’s preferred inflation gauge. If these figures come in strong, the USD could regain strength and put pressure back on EURUSD.

LONG ON NZD/USDNZD/USD is at a major demand level.
Dollar is bearish. Economic News this afternoon should assist and pushing this pair up.
Looking to catch 200 pips to the previous high.

New targets for Reddit RDDT In this video I recap the previous reddit analysis where we looked for the long which is playing out really well .
I also look at the current price action and simulate what I think could be a target for the stock moving forward using Fib expansion tools as well as levels below for price to draw back too.
Welcome any questions below the chart . Thanks for viewing

GBPJPY holds momentum, waiting for the final pushThe GBPJPY pair is moving sideways between 197.400 and 199.000, while maintaining its position inside the ascending price channel. Each pullback is quickly absorbed near the lower support, indicating that buying pressure is quietly building.
💡 Bullish factors supporting the trend:
– UK Services PMI beats expectations, strengthening economic outlook.
– BOJ maintains negative interest rates, weakening the JPY.
– Risk-on sentiment drives capital back into the GBP.
🎯 Suggested strategy:
Buy near 197.400 or on a breakout above 199.000.
Target: 201.500 | Stop-loss: below 196.800.

IPH 40% move coming?IPH has recently emerged from a descending wedge pattern, supported by bullish divergences in both the RSI and OBV, along with several divergences observed in shorter time frames. A pullback to the $5 level is anticipated, as the stock appears weaker on these smaller time frames. If IPH can maintain its position above the recent low of $4.40, it will indicate a structural shift, establishing higher highs and higher lows. My initial target is in the $6.50 range, followed by a potential move just above $7, representing a 40% increase. Good luck and happy trading 🍀

PUMPUSDT: Bullish Breakout and Retest - A Potential 34% Upside?Hello, traders!
Today we're looking at the PUMP/USDT pair on the 4-hour timeframe, and a very clean technical setup is unfolding that points towards potential bullish continuation. Let's break down the key elements of this analysis.
The Analysis
The chart presents a classic breakout and retest scenario, which is often a strong indicator of a trend reversal or continuation.
Descending Trendline Breakout: The most significant feature is the decisive breakout from a major descending trendline that had been capping the price for a considerable period. Breaking this trendline is a primary signal that the previous bearish momentum is weakening and buyers are starting to take control.
Break of Horizontal Resistance (S/R Flip): Following the trendline break, the price also successfully pushed through a key horizontal resistance zone, identified on the chart between approximately $0.002966 and $0.003044. This level has now, as expected, turned into a new support base.
The Retest: We are currently witnessing a pullback to this newly established support zone. This "retest" is a critical phase. A strong bounce from this level would confirm the breakout's validity and suggest that the market has accepted this price floor, paving the way for the next leg up.
Volume Confirmation: Notice the volume bars at the bottom of the chart. There was a visible spike in volume during the initial breakout candles, which adds conviction to the move. It indicates that the breakout was backed by significant buying interest.
The Trade Idea
Based on this structure, a potential long opportunity presents itself.
Entry: A favorable entry point could be found within the current support zone ($0.002966 - $0.003044), especially upon seeing confirmation of a bounce (e.g., a bullish engulfing candle or a hammer on the 4H or 1H chart).
Target: The analysis points to a primary target at the next major resistance level, located around the $0.004000 psychological mark. As measured on the chart, this represents a potential upside of over 34%.
Invalidation: This bullish outlook would be invalidated if the price fails to hold the current support and decisively closes back below the $0.002966 level. Placing a stop-loss below this zone is a prudent risk management strategy.
Conclusion
In summary, PUMPUSDT is displaying a textbook bullish setup. The combination of a trendline breakout, an S/R flip, and a live retest offers a compelling case for potential upside. As always, manage your risk carefully and wait for your preferred confirmation signals before entering a trade.
Disclaimer: This is not financial advice. The analysis provided is for educational and informational purposes only. Trading cryptocurrencies involves a high level of risk. Please conduct your own research and risk assessment before making any investment decisions.

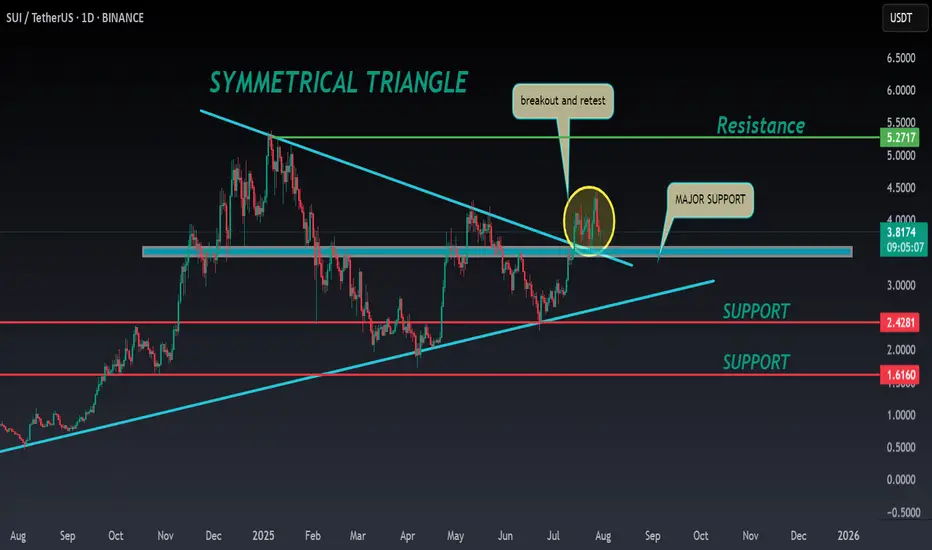
SUI ANALYSIS🔮#SUI Analysis 💰💰
#SUI is trading in a symmetrical triangle in a weekly time frame and if it breakouts with high volume then we can see a bullish momentum in #SUI. Before that we will see little bit bearish movement towards its support zone and that a bullish movement.
🔖 Current Price: $3.81
⏳ Target Price: $5.27
⁉️ What to do?
- We can trade according to the chart and make some profits in #SUI. Keep your eyes on the chart, observe trading volume and stay accustom to market moves.💲💲
🏷Remember, the crypto market is dynamic in nature and changes rapidly, so always use stop loss and take proper knowledge before investments.
#SUI #Cryptocurrency #Pump #DYOR
$AI they sleep, i eat. Quiet danger..Hello,
Name has been on my watch for a week or so now, finally just sitting back and getting to a multi analytical chart.
To begin: Yes, I see the head and shoulders pattern forming, scary, I know. Aside from that just zoom out, this name has traded in this range for 1,200 days... the range of $20 to $30 with some bumps in the $40's and low $20's with taps in the teens. This name is quiet, not a loud player like other AI tickers. Something smells fun here. I'm going to be gearing in some $40 calls for 2026. I may risk 20% of my port here. I feel confident in this one, I do. The name is holding good support in the low $20 range and there are a lot more green candles than red. I know other names are getting more attractive like BBAI, you still have SMCI, CRWV, NVDA and so forth, which is fine, means nothing. This was a meme name type of stock about a year ago. I believe this will go on a run towards $50. If you have patience, $50 calls for 2027 would be appropriate and at a fair price for a swing and a possible short squeeze. For those who want to play the shorter term volatility $40 calls for Jan. 2026.
Good luck.
WSL.

AUDUSD Analysis – Bullish Structure Still IntactAUDUSD is trading within a clear ascending channel on the H4 chart. After dropping from the FVG zone around 0.65800, price has reacted well to the lower boundary support near 0.64650.
Currently, price action suggests the potential formation of a short-term bottom. If this level holds and the pair rebounds, the next target could be the red FVG zone near 0.65400.
Recent Supporting News:
U.S. consumer confidence slightly weakened, causing the dollar to cool off — offering technical rebound support for AUD.
Trading Strategy:
Prefer short-term Buys near 0.64650 if a confirmed bounce appears, with target around 0.65400. Be cautious if price breaks below the ascending channel.
Do you think AUD will continue to rise within this bullish channel?

XAUUSD – Is gold getting ready to bounce?Right now, gold is reacting around the 3,280 support zone after breaking down from its previous ascending channel. While the broader trend is still under bearish pressure, the recently released JOLTS data came in lower than expected, signaling that the U.S. labor market may be cooling — a mildly positive sign for gold.
From a technical view, price is showing signs of forming a short-term bottom near 3,229 and is starting to rebound. If gold can hold above this support and break through 3,339, a recovery toward the 3,360–3,400 zone could unfold.
That said, this bounce is likely just a technical correction. Without more bearish news for the dollar, gold still risks being rejected around the FVG area and heading lower again.
Trading idea: Consider short-term Buy opportunities if price stays above 3,280 and forms a clear reversal pattern. Stop-loss below 3,229. Short-term targets: 3,339–3,360.
What about you? Leaning towards buying the dip or staying with the downtrend?

USDJPY – Bearish Pressure Builds Near Channel TopUSDJPY is approaching strong resistance around 149.900, a level that has repeatedly triggered price rejections. The ABCD structure suggests the current bullish correction may be nearing completion. If price fails to break above this zone, selling pressure could emerge.
On the news front, Japan’s core inflation remains elevated, reinforcing expectations that the BOJ will maintain its current stance. Meanwhile, the U.S. dollar is losing momentum after a series of mixed economic data releases.
Strategy: Consider SELL opportunities if clear reversal signals appear near 149.900. A short-term target lies around the 148.200 support zone. A confirmed break below this level could signal the start of a deeper bearish move.

GBPJPY – Bearish pressure returns near ascending channel supportGBPJPY is trading close to the lower trendline of the ascending channel, with the 197.400 zone acting as a key support. A breakdown below this level could trigger stronger bearish momentum.
On the news front, Japan’s CPI remains solid, strengthening the yen. Meanwhile, the British pound is under pressure after recent consumer spending data showed signs of weakness, raising concerns over the UK’s economic outlook.
Strategy: If the price breaks below 197.400 and fails to bounce back, consider SELL setups in line with the bearish trend. If it rebounds, watch the reaction around the 199.100 zone for signs of recovery confirmation.

EUROYENEurjpy has shorter pullbacks within an ascending structure ,shall keep following it and expect it to reach a fair mount of highs or levels

$NVO offers solid risk to reward for long term buyers! - I had previously called out that NYSE:NVO would have more pain to come when it was in $85-90s I have attached the link with this post for my reader's reference.
- Now, I am turning bullish on this name given these prices and compressed multiples for the growth prospects it offers.
Fundamentally,
Year | 2025 | 2026 | 2027 | 2028
EPS | 3.93 | 4.78 | 5.41 | 5.97
EPS growth% | 25.41% | 21.60% | 13.19% | 10.24%
For a quality name growing EPS > 20% deserves a fair forward multiple of 25.
| Year | Bear (fp/e = 15) | Cons. Base (f. p/e = 20) | Base (fpe = 25) | Bull Case (fpe=30)
| 2025 | $58.95 | $78 |. $98.25. |. $117.9
| 2026 | $71.7 | $95 |. $119. |. $143.4
| 2027 | $81.15 | $108 |. $135 | $162.3
| 2028 | $90 | $119 |. $149.25 | $179.1
As you can see, If you buy NYSE:NVO under $60 then you will be making money even if multiple remains compressed i.e bear case. Only thing you have to do is hold and returns would amplify once there is optimism back in the market which will lead to multiple expansion.
My fair value for NYSE:NVO for this year is $78 based on the conservative base case.

BTC Accumulation, Bullish Breakout Signs💎 BTC PLAN UPDATE
1. Key Chart Features:
Currently, the BTC/USD price is at $118,893.
The chart shows a strong upward trend recently, and we are seeing accumulation with short-term corrections.
2. Fibonacci Levels:
The Fibonacci retracement levels are drawn from the lowest point ($114,460) to the highest point ($119,809).
At the moment, the price is hovering near the 0.5 retracement level ($113,000), which is a key support level.
If the price holds above this level, a rebound is likely.
3. Trendlines and Price Patterns:
The trendlines (dashed blue lines) are indicating a descending triangle pattern, which could lead to a breakout if the price surpasses resistance levels.
A potential Head and Shoulders pattern might be forming, though it is not yet clear and needs confirmation by breaking key resistance.
4. Breakout and Retest Zone:
The breakout zone (red area) is around $119,000.
If the price breaks and holds above this level, we may see a continuation of the uptrend toward the next target around $122,792 (Fibonacci 1.618 level).
After the breakout, the price might retouch (retest) this support area before resuming the upward movement.
5. Technical Indicators:
• Moving Averages (MA):
• The red MA (long-term) is below the current price, indicating a strong uptrend.
• The yellow MA (medium-term) is near the current price, providing support for the uptrend if it holds.
• RSI Indicator:
The RSI has not yet reached overbought levels, suggesting that the market still has potential to rise without being overheated.
6. Conclusion:
If the price breaks above the $119,000 resistance and maintains that level, BTC/USD could continue its strong bullish trend, potentially targeting $122,792 or even $127,941.
Note: If the price fails to hold above $119,000 and drops back below, a pullback to the nearest support level at $114,460 may occur.

XAUUSD – Technical rebound, but downside risks remainOn the H4 chart, gold is bouncing slightly from the 3,323 support zone after a sharp drop. However, price remains within a large descending channel and is approaching a dense cluster of bearish FVGs around 3,360–3,374.
News context:
– US GDP and ADP data beat expectations, boosting the USD and adding pressure on gold.
– JOLTS dipped but remains above 7 million → limited support for gold.
– Thailand–Cambodia conflict provides only short-term impact.
Strategy: Favor SELL if price retests 3,360–3,374 and gets rejected. Downside targets: 3,323 or lower.
Main trend remains bearish, unless gold breaks above the descending channel.
