Accumulate, BTC back above 110K💎 BTC PLAN UPDATE (June 16)
NOTABLE BITCOIN (BTC) NEWS:
Bitcoin (BTC), Ethereum (ETH), and Ripple (XRP) are showing signs of stabilization around key support levels following last week’s correction. BTC is attempting to regain momentum after closing below a critical support zone, while ETH and XRP are hovering near technical thresholds that could determine their next directional move.
TECHNICAL ANALYSIS OUTLOOK:
Bitcoin could decline further if it closes below the 50-day EMA
Bitcoin closed below its daily support at $106,406 on Thursday, then bounced back after retesting the 50-day Exponential Moving Average (EMA) at $102,893 on Friday. BTC has since stabilized around the $105,000 level over the weekend. As of Monday, it continues to consolidate, trading near $105,788.
If BTC fails to close above the $106,406 resistance level and heads lower, it may extend its decline toward the psychologically significant $100,000 level.
The Relative Strength Index (RSI) on the daily chart is hovering around the neutral 50 mark, signaling indecision among traders. Meanwhile, the Moving Average Convergence Divergence (MACD) indicator shows a bearish crossover on the daily chart, indicating selling pressure and a possible downtrend continuation.
At this stage, whether you're new or experienced, it's wise to spend more time practicing, deepening your technical analysis knowledge, and exploring educational content shared on the channel. Strengthening your foundation will help you protect your capital in this volatile environment.
==> This analysis is for trend reference only. Wishing all investors successful trades!
Longsetup

Hidden Bullish Divergence on Bigger tf.HTL Closed at 44.65 (13-05-2025)
Hidden Bullish Divergence on Bigger tf.
If 41 is not Broken, we may witness
upside towards 46.50 - 47 & then
50 to 55.

The OB is set. The move just hasn’t been claimed yetThis is structure, not speculation. XRP tapped the 1H Order Block, held its low, and began building compression. Price is coiling — not failing. That matters.
The logic:
After the initial drop, price swept local lows into an untouched OB, then printed higher lows into a tighter range. That’s not weakness — that’s staging. Smart Money builds quietly. This is the echo of their positioning.
Above us sits a single, untested draw:
TP: 2.2540 — inefficiency fill, paired with external liquidity resting above last week's mid-range
Expecting one more dip into the OB is not only possible — it’s ideal. That’s where they’ll trap the impatient.
Execution:
Entry: 2.11–2.13 retest (into OB)
SL: Below 2.08
TP: 2.2540
No noise. No chasing. This is a campaign move — the kind that rewards precision, not emotion.
Final thought:
“I don’t trade the bounce. I trade the buildup before it’s even visible.”

The FVG was the invitation. The OB was the entryBTC delivered exactly where it needed to. It didn’t break down. It rebalanced. The chart isn’t noisy — it’s speaking. And it’s pointing to 108.3k.
The logic:
Price printed clean displacement, returned to mitigate a 1H FVG stacked on top of a refined Order Block, then paused. That pause is structure — not indecision. Volume compression confirms it: absorption, not rejection.
A deeper OB sits below at 102.5k. If we tap it, it’s not invalidation — it’s refinement. But the primary play is already in motion.
The path:
Reclaim 105.7k range high
Break above intraday liquidity
Deliver to 108.3k inefficiency fill
Execution:
Entry: 104.8k–105.1k (current OB zone)
SL: Below 103.9k
TP: 108.3k
Don’t react to the candles. React to what they represent — engineered displacement followed by precision mitigation.
Final thought:
“This isn’t a trade setup. It’s a delivery route — and I’m already onboard.”

They saw a crash. I saw where the next rally beginsThis isn’t chaos. It’s sequence. SOL sold off into a well-defined 1H OB, paired with a high-volume low. Price didn’t break. It anchored.
The setup:
After an aggressive dump, price settled into an Order Block between 140–143. This isn’t weakness. It’s rebalancing. Right above? A perfect FVG at 149 and inefficiency zones that align with liquidity draws at 152 and 160.
Volume is telling — it spiked into the OB, not on exit. That’s how Smart Money positions.
Expectation:
Accumulation near the OB → quick reversal → reclaim 145
From there, watch price reprice through:
TP1: 149 (FVG reclaim)
TP2: 152 (full inefficiency fill)
TP3: 160 (external liquidity sweep)
Any deeper dip below 140 becomes a deviation — not a breakdown — unless structure is violated with follow-through.
Execution:
Entry: 141–143 zone
SL: Below 139.8
TP1: 149
TP2: 152
Final: 160
This is engineered — not emotional.
Final thought:
“You don’t need to predict the bottom. You just need to know where price is built to return.”

EHTUSD15 min TF
Buy on next breakout
Cup and Handle Format
Risk Reward mentioned in chart with TP SL EP

They laughed at the name. I loaded the setupPrice action doesn’t care about branding — it cares about imbalance, volume, and delivery. And FARTCOIN just hit a prime liquidity pocket with mechanical precision.
The structure:
After a fast drop, price tagged the 0.618 fib at 1.1607, which also aligns with the high-volume node (visible range) — a zone where Smart Money absorbs without headlines.
Below that? Void. Above? Rebalancing targets:
1.1870 (0.5 fib)
1.2133 (0.382)
1.2458 (0.236)
Full recovery to 1.2960 if liquidity calls for it
Volume has thinned on the pullback — ideal. That’s not fear. That’s vacuum.
Expectation:
We chop sideways here before liftoff. I’m not chasing — I’m letting the structure compress and then watching for the breakout reclaim above 1.1635.
Execution:
Entry: 1.1500–1.1600
SL: 1.1220 (below .786 fib)
TP1: 1.1870
TP2: 1.2130
TP3: 1.2450
Final target: 1.2960 full draw
This chart may trigger jokes — the move it’s building won’t.
Final thought:
“I don’t care what they call it. I care where Smart Money enters.”

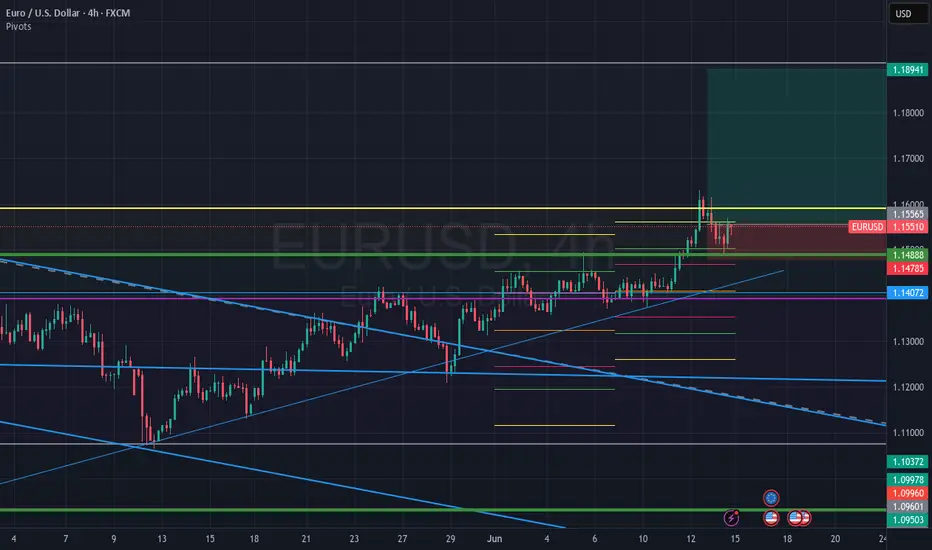
EURUSD ANALYSIS - LONGPrice has successfully broken out of the falling wedge on both the daily and weekly charts, signaling strong bullish momentum. After hitting resistance around 1.1555 (61.8% Fib), we’re seeing a healthy pullback towards 1.1500-1.1488 support. As long as bulls defend 1.1400, I’m looking for continuation towards 1.1555 and 1.1894 swing targets. Watching price action closely at the current pullback zone for potential long entries.
ETH UPDATE 🛡️ Ethereum Holds the Line — Critical Support Zone Tested Again
Because Ethereum has plummeted over 14% since Wednesday, traders and long-term holders are worried. Bullish investors expected ETH to break over $3,000 and confirm a wider cryptocurrency rise days earlier.
However, global turmoil has slowed markets. Israel's assaults on Iran and retaliations shook global markets on Thursday, causing crypto asset volatility and risk-off.
Historical trends between August 2021 and early 2024 suggest that keeping $2,500 has led to rallies reaching $4,000. Rekt believes Ethereum must maintain consistency around this zone to prevent a deeper retreat and maintain bullish momentum.
ETH has held $2,500 over five weeks, proving its stability despite numerous testing. In the weeks ahead, altcoins and the crypto market will depend on whether Ethereum can maintain this footing again.
Ethereum fell sharply from $2,830 this week to $2,556. On the daily chart, ETH has been rangebound between $2,500 and $2,830 for weeks. Ethereum has held above the 50-day and 100-day moving averages, which are rising, despite international threats.
The red 200-day moving average at $2,642 has provided resistance. A retracement followed ETH's short break above this level, which it failed to keep. Recent volumes have increased due to heightened attention and emotive price responses in the Israel-Iran conflict.
The $2,500–$2,520 support zone is important. This region has been a floor before and might rocket bulls if they recover control. A clear fall below $2,500 might turn sentiment negative and lead to $2,300.

This retrace was never weakness — it was refinementDOGE delivered the exact narrative I’ve come to expect from algorithmic flow on the low timeframes. This wasn’t about volatility. This was about cleanup.
The play:
After the initial spike, price formed a visible FVG and retraced into the 0.5–0.618 fib zone. That’s not random — that’s rebalancing. Not only did we see a fade into the midpoint, but volume increased into the dip, not out of it.
What this does is simple: it clears out early longs, taps deeper liquidity, and prepares for re-delivery — all while structure remains intact.
Expectation:
Two paths are mapped — both favoring upside:
Ideal scenario: sweep 0.618 or 0.786 (down to 0.1726) → quick rejection → rally back into the FVG and above
Conservative: hold above 0.1761 fib (0.5) and slowly grind into 0.1795
Final target remains the inefficiency fill near 0.1825
Risk profile:
Entry: 0.174–0.176 zone
Invalidation: below 0.169
TP1: 0.1795
TP2: 0.1825
I’m not interested in chasing. I’m interested in absorption. This is where smart entries are born — deep in discount, backed by displacement.
Final word:
“If you can’t see the intention behind the pullback, you’re not trading Smart Money — you’re reacting to it.”

Price returned. I was already waitingThis wasn’t a pullback — it was a reset. And Smart Money doesn’t chase price. It sets traps. This is one of them.
Breakdown:
SOL delivered into a confluence zone where multiple models align:
Daily FVG overlaps perfectly with a 4H Order Block
0.5 fib retracement (141.82) tagging the midpoint of the prior expansion leg
Volatility spike? Engineered. Not reactive.
Retail is shaken. I’m composed. This is the zone you mark before price even gets there — because when it does, you don’t hesitate.
Trade logic:
Entry: 141.8–146.0 (inside D FVG + 4H OB)
SL: Below the 0.618 fib / 130.8 invalidation
TP1: 152.8 (0.382)
TP2: 166.4 (0.236)
Final draw: 188.4 — full inefficiency fill and premium rebalance
This isn’t about hitting every level. It’s about understanding why these levels matter. Structure tells the story. The fib just refines the sentence.
Final words:
“Smart Money doesn’t trade the reaction. It trades the setup that creates it.”

ETH ANALYSIS📊 #ETH Analysis : Update
✅As we said earlier, #ETH performed same. Now we can see that #ETH is trading in a bullish flag pattern and its a bullish pattern. We could expect around 10% bullish move if it sustain above its major support.
👀Current Price: $2555
🚀 Target Price: $2815
⚡️What to do ?
👀Keep an eye on #ETH price action and volume. We can trade according to the chart and make some profits⚡️⚡️
#ETH #Cryptocurrency #TechnicalAnalysis #DYOR

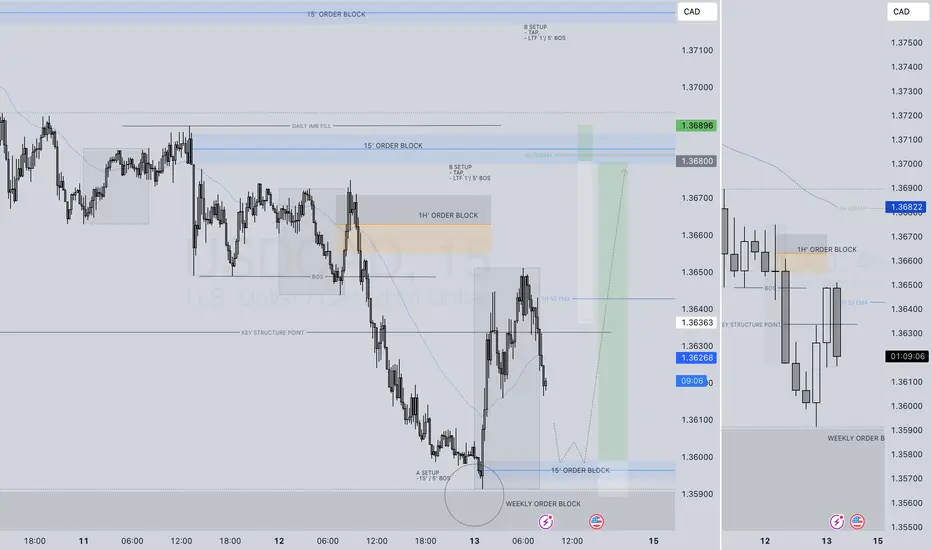
USDCAD LONG FORECAST Q2 W24 D13 Y25USDCAD LONG FORECAST Q2 W24 D13 Y25
Professional Risk Managers👋
Welcome back to another FRGNT chart update📈
Diving into some Forex setups using predominantly higher time frame order blocks alongside confirmation breaks of structure.
💡Here are some trade confluences📝
✅1H order block
✅HTF 50 EMA
✅Intraday bullish breaks of structure to be identified
✅15’ order block identified
🔑 Remember, to participate in trading comes always with a degree of risk, therefore as professional risk managers it remains vital that we stick to our risk management plan as well as our trading strategies.
📈The rest, we leave to the balance of probabilities.
💡Fail to plan. Plan to fail.
🏆It has always been that simple.
❤️Good luck with your trading journey, I shall see you at the very top.
🎯Trade consistent, FRGNT X
Opportunity to buy EURUSDI see an opportunity to buy the EUR/USD pair from the support shown in the image and the target will be 1.16316

Ethereum is deciding where it wants to live.This is not a trade idea, this is a long term concept, most of my portfolio is swing when bull market comes (monthly/yearly) not trade (daily/weekly).
This is a solid question that will have to be played out in the upcoming years, Ethereum keeps changing its monetary policy and right now has less supply increase than BTC (due to burning mechanisms), will that stay forever? What will happen in the future to the policy? What it will mean for price?
Right now we can clearly see this is a bull case for future months.

XAU/USD 1H – Clean Impulsive Setup UnfoldingGold has completed a clean Wave (2) correction, bottoming at $3,292.30, respecting both structural demand and fib confluence. Price is now showing early signs of Wave (3) development to the upside.
📌 Key Structure:
Wave (1) High: $3,403.30
Wave (2) Low: $3,292.30 (confirmed higher low structure)
Market is now consolidating slightly above the 0.5 fib level ($3,324.45), with bullish structure still intact.
📈 Technical Confluence:
Price is holding the internal bullish trendline
RSI is neutral but building potential upside momentum
Price action is forming higher lows, indicating strength post-correction
🎯 Next Bullish Targets:
$3,366.08 (0.236 fib level of Wave (2) correction)
$3,403.30 (Wave (1) high retest)
Final Wave (3) extension zone: $3,445 – $3,500
📉 Invalidation Level:
A break and close below $3,292.30 would invalidate this Wave (2) bottom and open the door for a deeper correction.
✅ Bias:
Bullish, as long as price holds above the 0.618 – 0.705 fib zone. A strong push from this area could confirm the next leg of Wave (3).
@WrightWayInvestments
@wrightwayinvestments
@wrightwayinvestments

While they panic at 0.618, I loadThis is the type of setup that filters out noise traders. Four-hour price delivered into a stacked FVG zone — aligned with equilibrium, and structured to reprice.
Here’s the logic:
After taking out short-term highs near 111.9k, price repriced sharply — not randomly, but with algorithmic precision — into a series of untouched 240min FVGs.
Price tapped the upper imbalance, hovered at the 0.618 fib retrace (107.3k), and held. That’s not weakness. That’s orderflow.
Below this sits the final FVG + golden 0.786 (106.4k) and round number zone near 105.2k. That’s your invalidation layer. Anything inside it? Still Smart Money accumulation.
Above? The draw remains clear: inefficiency fill to 110.6k and liquidity resting above 111.9k.
My framework:
Bias: Bullish unless 105.2k gets violated with intent
Entry: 107.3k–106.4k
TP1: 108.5k (fib 0.382)
TP2: 110.6k (inefficiency fill)
Final objective: 111.9k raid
Volume confirms the handoff — sellers are trapped chasing the leg, Smart Money has already shifted to accumulation.
Final thought:
I don’t wait for signals. I wait for price to make sense. And here, it’s giving every reason to load.
“Fear at 0.618 is the edge of amateurs. Patience at imbalance is where precision lives.”

Can gold price maintain the uptrend above 3400?⭐️GOLDEN INFORMATION:
Gold prices advanced by approximately 0.97% on Wednesday, buoyed by signs of easing inflation in the United States (US), which reinforced expectations that the Federal Reserve (Fed) could resume rate cuts as early as September. At the time of writing, XAU/USD is trading around $3,363.
The May Consumer Price Index (CPI) report shows a slowdown in price pressures compared to April, prompting a surge in demand for the yellow metal. In response, gold briefly rallied to an intraday high near $3,360 before paring back some of those gains, as investors recalibrated their outlook on the Fed’s policy path.
⭐️Personal comments NOVA:
Middle East concerns, along with information about influential high tariffs on countries without trade agreements. Gold prices have recovered, but there is no long-term stability.
⭐️SET UP GOLD PRICE:
🔥SELL GOLD zone: 3428- 3430 SL 3435
TP1: $3410
TP2: $3395
TP3: $3382
🔥BUY GOLD zone: $3345-$3343 SL $3338
TP1: $3355
TP2: $3367
TP3: $3380
⭐️Technical analysis:
Based on technical indicators EMA 34, EMA89 and support resistance areas to set up a reasonable BUY order.
⭐️NOTE:
Note: Nova wishes traders to manage their capital well
- take the number of lots that match your capital
- Takeprofit equal to 4-6% of capital account
- Stoplose equal to 2-3% of capital account

Aggressive Trend Trade 1HAggressive Trend Trade 1H
- short trend
+ volumed T1
+ support level
+ biggest volume 2Sp+
Daily Trend
+ long impulse
+ T2 level
+ support level
+ 1/2 correction"
Monthly CounterTrend
"- short balance
+ expanding ICE
+ support level
+ unsuccessful biggest volume manipulation"
Yearly Trend
"+ long impulse
+ 1/2 correction
- below exhaustion volume?
- below SOS"
Will add more when 5M, 1H or 1D will show entry point

Lemonade Inc.: Breakout in Motion — Cup, Flag, and No BrakesLemonade Inc. (LMND) is accelerating after a clean breakout from a textbook cup with handle pattern, where the handle formed as a tight bullish flag. The breakout occurred around $32, and since then, price action has been sharp, controlled, and uncorrected — currently trading at $42.42 with buyers clearly in charge.
On the fundamental side, LMND is moving through a recovery phase: operational losses are narrowing, revenue is stabilizing, and the company is aggressively leveraging AI to automate its insurance processes. Expansion into Europe continues, and institutional interest is visibly rising — confirmed by volume building alongside price. Within the insuretech sector, LMND is starting to look like a comeback story rather than a cautionary tale.
Technically, the setup remains strong:
– Golden Cross confirmed (EMA50 crossing EMA200)
– EMA50/100/200 all below price — bullish structure firmly intact
– Volume expanding on up-days — healthy confirmation
– RSI hovering in the 60–65 range — momentum is intact, no signs of exhaustion
Targets remain aligned with the structure:
– tp1 = $64 — measured move from the flag
– tp2 = $94 — full realization of the cup pattern
Tactically, this is no longer a “wait and see” setup — the move is in progress. No correction so far, only continuation. Momentum traders may consider entries into strength. Above $45, the move could accelerate further as more participants recognize the structure.
LMND is showing technical and fundamental alignment — confirmed breakout, improving narrative, and strong trend structure. While the impulse holds, this chart favors continuation, not hesitation.

Did You Catch the Sweep & Shift on GBPAUD?Sometimes the market whispers its intentions before making a move — and this was one of those moments. This GBPAUD setup was built on the core principles of Candle Range Theory (CRT):
Sweep of the Previous Day’s Low (PDL)
Break of Structure (BOS) confirming a shift in momentum
Entry retracement into the Fair Value Gap (FVG)
What stood out here was the precision of the sweep and how price reacted cleanly after BOS, tapping into the FVG zone and immediately pushing toward the high-probability target.
No indicators, no noise, just clean market structure and smart money behavior.
The temptation to enter early was real, but the edge came from waiting for price to validate itself. A textbook example of how patience and plan adherence outweigh prediction .

Boeing (BA): Watching for a Break Above 218.80NYSE:BA has a strong chance of breaking above the 218.80 level , with a potential move toward 221.98 .
I plan to enter 1 tick above 218.80, with a stop-loss based on the 5-minute ATR (period 10).
🔍 Technical Outlook:
BA is currently moving within an upward ABCD channel. The projected upside is capped by a strong resistance zone at 221.98 – a level derived from the daily chart and previous price action. The market may or may not react to it, but it’s a logical target within a solid risk-to-reward setup.
One aspect I particularly like about this setup is the market’s inability to close significantly below the previous pivot high at 215.80. This suggests underlying strength. If we see a confident move above resistance, the trade could be triggered with momentum.

Get ready for the Breakout on GOLD!"you know how looong i been waiting for dis?!" *Gambit Voice*
Been waiting for this set up to happen and its slowly showing that its ready to break out and go for new Highs. just trying to be patient and ready for it.
