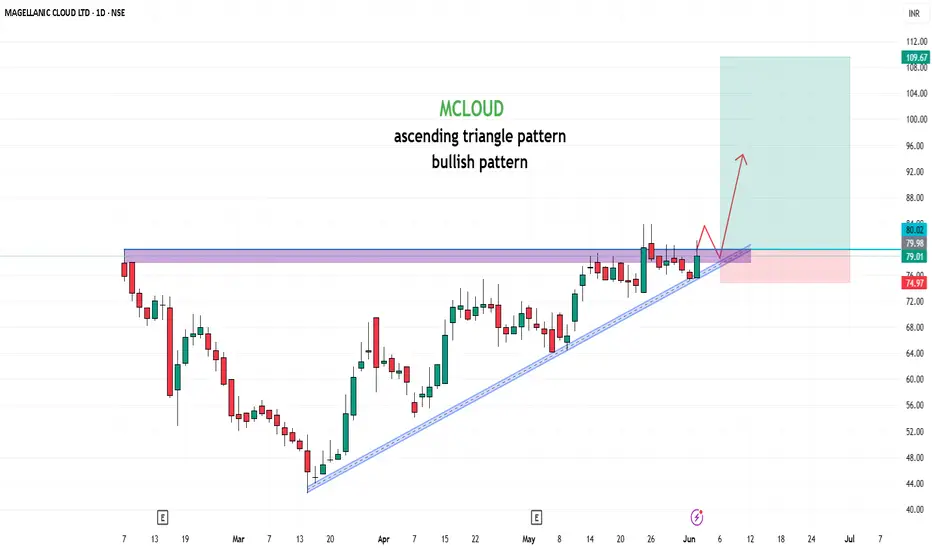
MCLOUD📊 Stock Analysis: MCLOUD
The stock has been consolidating within a ascending triangle pattern and is nearing a critical Buy Above level at ₹80 , signaling a potential breakout. The target is set at ₹179, offering a potential gain of 123.75%. Key insights:
Trend: A breakout above the wedge could indicate renewed bullish momentum.
Support Levels: Strong support around ₹75 , making this a low-risk entry point.
Volume Buzz: The recent increase in volume shows rising investor interest.
🔔 Keep an eye on this setup! Always analyze your risk tolerance before making any decisions.
📢 Disclaimer: This post is for educational purposes and not financial advice. Conduct your research or consult a financial advisor before investing.
What are your thoughts? Share them below! 📝
#StockTrading #TechnicalAnalysis #BreakoutTrading #MCLOUD
Longsetup
DOTUSDAlligator Strategy Buy Call
Risk Rewar TP 1 1:1 and T2 1:3
Open Two trades one for TP1 other for TP2.
For TP 2 make sure to move your SL to Entry point once price crosses TP1. So that you can ride Tp2 with zero loss.

RELIANCEi Observed these Levels based on Price Action and Demand & Supply which is my own Concept "PENDAM CONCEPTS"... Please don't take any trades based on this chart/post... Because this chart is for educational purpose only not for Buy or Sell Recommendation... Thank Q

$GALA Holding Support – Breakout Coming?INDEX:GALA is holding strong above the trendline support and showing signs of a bounce.
The price is now approaching a key descending trendline a breakout here could lead to a solid move toward $0.021–$0.026 📈
As long as it stays above the trendline, bulls are in control.
#GALA #ALTSEASON

Bulls pressure, gold price grows 3409⭐️GOLDEN INFORMATION:
Gold prices rallied sharply on Monday, reaching their highest level in over four weeks, as geopolitical risks escalated over the Russia-Ukraine conflict. Renewed tensions on trade between the United States (US) and China prompted investors to buy the yellow metal throughout the day. At the time of writing, XAU/USD trades at $3,377, up by 2.70%.
Market sentiment shifted sour as news broke that Ukraine staged an aerial attack on Russia, which destroyed long-range bombers and other aircraft. Meanwhile, US President Donald Trump doubled down on tariffs over steel and aluminum imports to 50%, effective June 4, and rhetoric against China sent US global equities lower.
CNBC reported that Trump and China’s President Xi Jinping could speak this week, but not on Monday.
⭐️Personal comments NOVA:
Gold prices maintained their upward momentum at the beginning of the week, tariff tensions and the war with Russia remain unpredictable. Gold prices supported to return to the 3400 zone.
⭐️SET UP GOLD PRICE:
🔥SELL GOLD zone : 3409- 3411 SL 3416
TP1: $3400
TP2: $3388
TP3: $3372
🔥BUY GOLD zone: $3313- $3315 SL $3308
TP1: $3327
TP2: $3340
TP3: $3355
⭐️Technical analysis:
Based on technical indicators EMA 34, EMA89 and support resistance areas to set up a reasonable BUY order.
⭐️NOTE:
Note: Nova wishes traders to manage their capital well
- take the number of lots that match your capital
- Takeprofit equal to 4-6% of capital account
- Stoplose equal to 2-3% of capital account

BTC Scalping / Intraday Signal – Entry, Stop & Target Ready!🕒 Timeframe: 15min / 5min
⚠️ Note: Manage your risk — intraday volatility is high.
This is a short-term opportunity, not a long hold.
Disclaimer: This is our personal analysis and not financial advice. Always do your own research before making any investment decisions.
💬 What’s your take on this? Drop your thoughts in the comments and feel free to share this with your friends! ❤️

AUDUSD Asia SessionWe could see bullish momentum during the Asian session pushing price into the upper supply zone around 0.65200. From there, we’ll be monitoring for bearish price action (PA) to potentially confirm a short setup.
If confirmation aligns, the short idea targets the demand zone between 0.64600–0.64500.
This is a forecast — not a signal. Trade execution will depend on what price does upon reaching the supply. We’ll drop to the H1 or M15 to refine entries if bearish confirmations present themselves.
Higher Timeframe Context: clearly marked HTF supply. Price has made a corrective leg up into this zone.
Liquidity & Reaction Area: There's likely resting liquidity above the most recent highs before the 0.65200 zone — perfect for a sweep.
Entry Plan: Smart to wait for CHoCH or BOS on LTF once we enter the supply zone. Avoid rushing — let the zone prove itself.
Target Area: The 0.64600–0.64500 zone aligns with previous structure and a minor FVG — solid short-term TP.

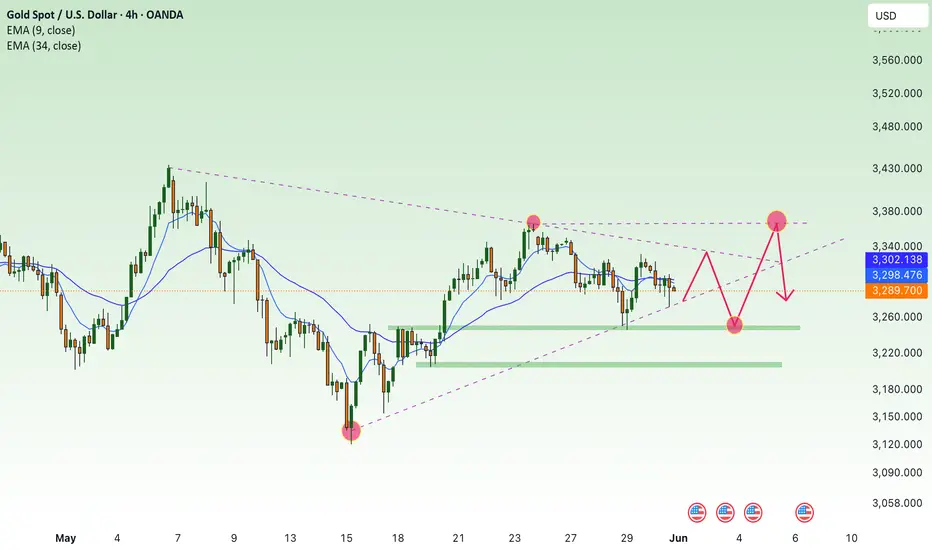
Possible Reverse Head and Shoulders?👁️🗨️ The strong uptrend yesterday, followed by the downtrend during the Asian session, has built a possible inverse head and shoulders pattern (30 min chart) 🤷🏼♂️.
⏫ If an uptrend follows today, the pattern will be complete.
The right shoulder began around $3287, which isn't far from the current price.
👀 Keep an eye on this, as it could drop lower while still keeping the structure intact.
⚡ What's very interesting is that the downward trendline (strong resistance) crosses the neckline support if the time window allows.
🙏 Possible target points:
TP 1: $3358
TP 2: $3382
What are your toughts about this? Please write it in the comments.
-------------------------------------------------------------------------
This is just my personal market idea and not financial advice! 📢 Trading gold and other financial instruments carries risks – only invest what you can afford to lose. Always do your own analysis, use solid risk management, and trade responsibly.
Good luck and safe trading! 🚀📊

BTC: Slowing DownBitcoin managed to stabilize over the weekend after its recent slide, nudging slightly higher from local lows. We continue to expect the current rebound—interpreted as wave B—to stretch into the blue Target Zone between $117,553 and $130,891. Once that move tops out, the next leg lower should follow, with wave C driving the price into the lower blue zone between $62,395 and $51,323. That would likely complete wave a in orange and pave the way for a temporary recovery before wave b rolls over into the final drop of wave (ii). The alternative scenario, which we’re still assigning a 30% probability, assumes Bitcoin is already in wave alt.(i) in blue—a more bullish path that would extend the rally well beyond $130,891 without another major correction first.
📈 Over 190 precise analyses, clear entry points, and defined Target Zones - that's what we do.

KAS/USDT Analysis (4H/1H)1️⃣ 🟢 KAS/USDT
KAS/USDT found a bottom at 0.0831 USDT and is now tracing a quick five-wave rally. A clean 4H candle close above 0.0875 USDT flips the bias bullish. First target: 0.0901 USDT. 🚀✨
2️⃣ Wave Structure
• Wave (1) peaked near 0.0872 USDT
• Wave (2) held at 0.0831 USDT (strong flip)
• Wave (3) climbed toward 0.0880 USDT
• Wave (4) pulled back to 0.0862 USDT (higher low!)
• Wave (5) projects up to 0.0925–0.0930 USDT once 0.0875 breaks
3️⃣ Key Levels
• 0.0831 USDT – Wave (2) support (pivot) ✅
• 0.0862 USDT – Wave (4) higher-low 💪
• 0.0875 USDT – 4H trendline resistance ⚠️
• 0.0877–0.0880 USDT – resistance zone (former support)
• 0.0901 USDT – first profit zone 🔥
• 0.0925–0.0930 USDT – Wave (5) extension 🎯
4️⃣ Indicators
• 4H MACD: still slightly negative but histogram flattening → bears weakening
• 1H MACD: just crossed bullish → short-term upside momentum ✅
• If 1H MACD stays positive as price hits 0.0875, expect a quick breakout
5️⃣ Trade Plan
• Entry: Wait for a 4H candle close above 0.0875 USDT. Confirm on 1H that price stays above.
• Long near 0.0877–0.0880 USDT.
• Stop Loss under 0.0855 USDT (below Wave (4) at 0.0862).
• TP 1: 0.0901 USDT (take 50% off).
• TP 2: 0.0925–0.0930 USDT (exit remaining).
6️⃣ Invalidation
If price closes below 0.0831 USDT on 4H, the bull count fails. Risk shifts down toward 0.0796 USDT. 🚨
7️⃣ Aggressive Entry (ADHD-Friendly Tip)
• Start a small long at 0.0862–0.0864 USDT (Wave (4)).
• Tight stop under 0.0855 USDT.
• Add more once 0.0877 USDT flips.
8️⃣ Quick Signals to Watch
• 4H close > 0.0875 USDT → GO! 🟢
• 1H candle stays above 0.0875 USDT → Confirm!
• 1H MACD histogram positive → Keep it rolling!
9️⃣ Bullmaster Conclusion
“KAS/USDT shows textbook 5-wave structure off the 0.0831 pivot. With a higher-low into 0.0862 and bullish MACD on the 1 hour, the path of least resistance is up, provided we break the 4 hour descending trendline at 0.0875–0.0880. Our first target is 0.0901, where momentum may pause, but a sustained rally could carry us into the 0.0925–0.0930 zone. A stop under 0.0855 protects the setup—bulls look ready to flip control.”
🔟 Next 8 Hours (Zoomed-In OR in a nutshell )
• Watch for 1H MACD staying green → fuels the bounce into 0.0875
• If 1H price holds > 0.0875, it’s a go→ 0.0901 then 0.0925!
• If price dips back under 0.0862 on 1H → abort mission; bears still in charge.
Let’s keep it simple, stay focused, and ride those bullish waves! 🌊🐂✨

SAMHIi Observed these Levels based on Price Action and Demand & Supply which is my own Concept "PENDAM CONCEPTS"... Please don't take any trades based on this chart/post... Because this chart is for educational purpose only not for Buy or Sell Recommendation... Thank Q

$TRUMP Bounces from Golden Pocket – Rally Incoming?$TRUMP has bounced from a strong support zone around $10.30–$10.50, which lines up with the 0.618 Fib level.
As long as this support holds, price could push toward $11.78 and possibly higher to $13.00+ if momentum builds.
The structure looks healthy, and buyers are stepping in again.
Keep watching, a move toward the upper levels may be starting! 👀
#Trump #ALTSEASON

EURUSD – The bearish threat is becoming increasingly clearRecently released PMI data shows that the U.S. manufacturing sector is rebounding. This dampens expectations of monetary easing from the Fed. With a stronger U.S. dollar and rising bond yields, USD-denominated assets like EURUSD are facing downward pressure.
On the daily chart, EURUSD is approaching the resistance zone at 1.16438 – an area that has rejected prices before. The recent rebound appears to be losing strength, and the ascending trendline is at risk of breaking.
If the price fails to hold above this trendline as illustrated, a breakout to the downside could drive the market toward the 1.10757 zone – which aligns with a previous strong support level.
In summary: be cautious of a potential trend break. If a pattern of lower highs continues, sellers may soon take control.

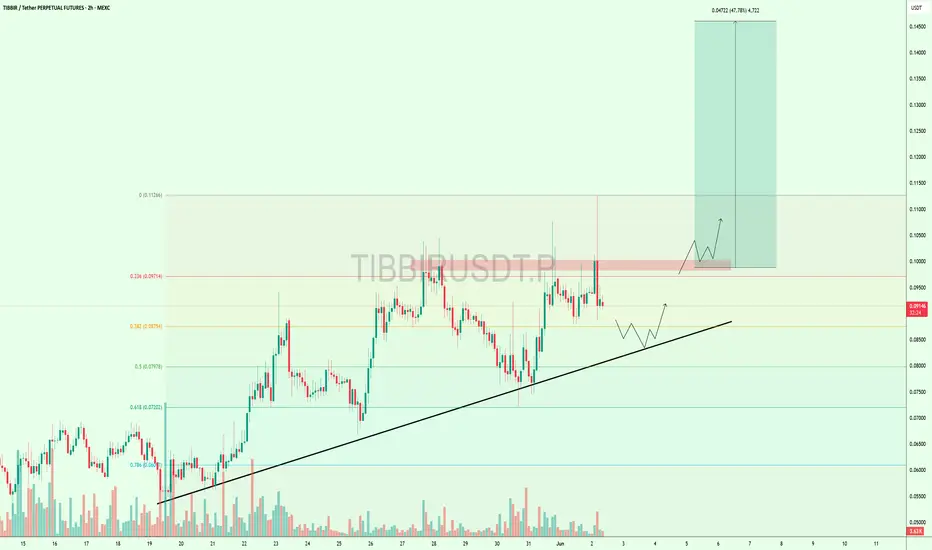
Price Cooling Off – But $TIBBIR Still Looks Bullish$TIBBIR is trying to break above the 0.097 resistance, but it hasn’t succeeded yet.
The price is now pulling back and might test the uptrend support line around 0.085–0.087. This area has helped the price bounce before.
If the support holds and price moves back up, we could see a strong move toward 0.1126 that’s nearly +47% higher.
Keep watching a breakout could come soon! 👀
XAUUSD – Pressure becoming evident at higher price levelsAfter an impressive recovery streak, gold may soon have a chance to approach the 3,404 resistance zone – the top of the current ascending channel. This is not only the upper boundary of the technical structure but also an area where price has been rejected multiple times before, making it a likely profit-taking point or a trigger for renewed selling pressure.
In addition, the newly released U.S. PMI data exceeded expectations, signaling that manufacturing activity is recovering well. This has prompted the market to reassess expectations for Fed policy easing – pushing up both bond yields and the USD, while gold – which yields no interest – is facing pressure.
If buyers fail to produce a clear candle close above the 3,404 zone, a pullback scenario toward the 3,324 support area becomes highly plausible. This will be a “strength-testing” zone for both sides in the upcoming sessions.

Gold price recovers above 3300, tariff impact⭐️GOLDEN INFORMATION:
Gold prices (XAU/USD) edged higher to around $3,310 during early Asian trading on Monday, buoyed by renewed demand for safe-haven assets amid lingering tariff uncertainty and heightened geopolitical risks.
Investors remain cautious following fresh tensions between the United States and China, after President Donald Trump accused Beijing of breaching the terms of their trade agreement. This has rattled global markets and lent support to the precious metal. Market participants now turn their attention to the upcoming US ISM Manufacturing PMI report for May, scheduled for release later in the day, which could offer further direction for gold.
⭐️Personal comments NOVA:
US raises tariffs on EU steel, a reminder of quickly negotiated deals, gold prices positive above 3300
⭐️SET UP GOLD PRICE:
🔥SELL GOLD zone : 3335- 3337 SL 3342
TP1: $3328
TP2: $3315
TP3: $3300
🔥BUY GOLD zone: $3289- $3287 SL $3282
TP1: $3297
TP2: $3308
TP3: $3318
⭐️Technical analysis:
Based on technical indicators EMA 34, EMA89 and support resistance areas to set up a reasonable BUY order.
⭐️NOTE:
Note: Nova wishes traders to manage their capital well
- take the number of lots that match your capital
- Takeprofit equal to 4-6% of capital account
- Stoplose equal to 2-3% of capital account

$AMD $120 retest then $130 push through. R/R looks incredible..Hello, NASDAQ:AMD Advanced Micro Devices, INC looks TASTY. I'm almost salivating. NASDAQ:NVDA may take a backseat and NASDAQ:AMD could start seeing monster upside. Something in my gut is telling me this name wants to GO. I'm looking at $120c for 6/20 and $130c for 6/20. This thing can launch.. it's hanging on an upside trendline, it may break but this $110 area may represent local support. Earnings report were good and after an abysmal 2024 after having highs and totally wiping them out hitting lows of $80, I think this could be the time for NASDAQ:AMD longs. It has taken the 20 day EMA/SMA over and now could curl to the 200 day EMA/SMA. 200 SMA is $126. This seems like a really good setup especially R/R here. Very cheap calls for a name that can see a 10-15% week.
WSL.

$FI bounce coming off 30% ATH drawdown $170 targetHello, NYSE:FI Fiserv evidently got hammered to the downside the last month and last few months the name is down 30% from it's all time high from March 2025 and last month and change it is down 25% or so after downgrades. I have been watching the name the last week or so and I was looking for a drop into a zone of activity in the $152-$154 but it seems that $158-$160 is a strong area of support. Now I am tempted to grab some calls on this name but I am unsure the outcome. The latest Daily candle accumulated the most volume it's had in 2 weeks above 11 million. It bounced off the zone area highlighted. The calls I added to my watch were $170c for 7/18, last week they bottomed around $2.00-$2.20 and they closed (5/30/2025) at $3.30. That's a good move in itself. Will be watching.
WSL

Jindal Steel & Power ,1DPattern is looking very very good , enter into trade after upper trendline is fully broken with Good Volume with strong candle .
Take Risk According to your Capital
Follow for more Swing Ideas Like this .

Bitcoin Wasn't Built for Bull Runs — It Was Built for This MomenDear traders,
You may be witnessing a “first” — a pivotal moment right before things begin to spiral.
We’re not fortune tellers. We don’t claim to predict the future.
But what you’re about to read is based entirely on **publicly available data**, interpreted not through speculation, but through a deep, rational analysis of interconnected facts — the kind of connections that most overlook, and few dare to question.
We may not know how the future is being orchestrated behind the scenes...
But one thing seems certain: **crisis always comes first...** and *then* we are given a **narrative** to justify it — be it war, a pandemic, or a "global emergency."
This is the correct sequence... and it’s the one they never teach you.
Yet for those of us who navigate the financial markets, one question matters more than all others:
**How do we profit from this?**
---
We recently shared an important setup on the **Nasdaq index**, the benchmark that reflects — to a large extent — the true state of the U.S. economy.
As a proxy for the 100 largest American corporations, the Nasdaq plays a critical role in signaling macro trends.
And while some are just now waking up to the storm ahead, **our outlook has been clear since October 2022**:
A major economic crisis was not only probable… it was **inevitable**.
Some analysts chalk this up to uncontrolled money printing post-2019 as governments tried to patch the damage from the COVID-19 crisis. That’s one explanation.
But at **Glich**, our vision is different.
More complex.
And for now… **not something we can fully release**.
---
For years, strong correlations between **risk markets** — especially U.S. equities and crypto — held firmly in place.
But something changed on **May 30th, 2025**. Completely and unmistakably.
The link was severed.
Now ask yourself:
**Why was Bitcoin created in the first place?**
It wasn’t just digital money.
It was a bold, revolutionary idea. A system designed for a future economy no longer shackled by inflation, central banking failures, or hidden agendas.
A fluid, transparent, and secure network for a world in desperate need of change.
The current financial model is obsolete. It’s no longer evolving — just surviving.
And it can no longer answer the challenges of what's to come.
**2008 was not the collapse; it was the setup.** A convenient pretext to slowly roll out something **new**.
And "Satoshi Nakamoto"? Well, let’s just say...
**That name means more than you think.**
_"HIDDEN INFORMATION"_ 👁️
---
What does NEO mean when he says:
> "This has all happened before… yet it’s happening for the first time"?
And what does that have to do with us?
This analysis is *not* just about charts or setups.
It’s a **hidden message** — a spotlight on a once-in-a-generation opportunity lying in plain sight.
But not everyone is trained to read between the lines.
---
Let us ask:
- Why was **Donald Trump** specifically pushed into position?
- Why is crypto — after being suppressed, banned and attacked worldwide — now being quietly **promoted** and fast-tracked in legislation during 2024 and 2025?
Something’s moving beneath the surface.
---
### 🔍 In summary:
- Expect a tidal wave of **global crypto legislation** to pass in the coming **days/weeks/months**.
- Crypto — particularly **BTC and ETH** — will become silent **stores of value** during the economic storm.
- Expect record-breaking levels: **$400K for Bitcoin**, **$40K for Ethereum**.
Yes, this may sound like science fiction…
But keep your eyes and ears wide open. 👁️
- And brace yourself for a **historic collapse** in U.S. equities. Possibly… something we’ve never seen before.
---
The show is starting.
And we won’t spoil the ending — because watching it unfold is part of the experience.
But here’s what we *can* say, thanks to our proprietary **algorithmic system**:
- The **U.S. economy will bleed**.
- And crypto will blow past expectations — fulfilling the very purpose it was built for.
---
🛒 Load your bags in the coming days...
Because when this train leaves the station —
It won't be stopping for anyone.

SUI analysis In this video I go through the recent bullish trend in SUI and anticipate where I think the retrace will take us for a possible long entry . I also highlight a possible short setup off of the Value area high if it comes in .
Tools used in the video TR Pocket / Fibs , Volume Profile and Pivots .
Appreciate your support any questions then please leave them in the comments
Have a great day

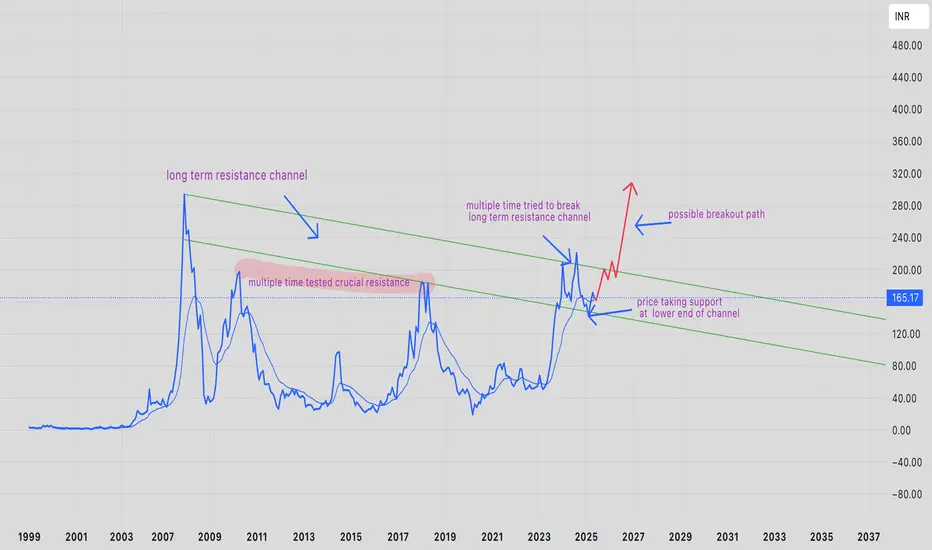
High chance of PRAKASH-EQ to break ATH and make new highPRAKASH-EQ has traded in range for about 14 years ( from 2010 high to recent 2024 high ). This time the breakout is different because price has managed to break and trade above its crucial resistance zone.
currently price of PRAKASH-EQ has taken support at the lower end of its long term resistance channel and there is high chance of price breaking its all time high.
as and when price reaches near the upper band of its long term resistance band, it is expected to have a sudden and fast momemtum which will be volume supported.
right now price is in value zone (for people planning for momentum breakout) but it is advised to carry this for the next 1-3 years to reap the benefits of compounding
as always people are advised to trade as per their risk capacity.
Continue to maintain stability above 3300, next week✍️ NOVA hello everyone, Let's comment on gold price next week from 06/02/2025 - 06/06/2025
🔥 World situation:
Gold prices declined on Friday, pressured by a rebound in the US Dollar, even as US Treasury yields dipped in response to a robust inflation report. Despite the yield pullback, expectations remain firm that the Federal Reserve could begin easing policy in 2025. At the time of writing, XAU/USD is down 0.83%, trading around $3,289.
Market sentiment turned more risk-averse after US President Donald Trump sharply criticized China, accusing Beijing of breaching the trade agreement reached during talks in Switzerland. In a post, Trump wrote, “China, perhaps not surprisingly to some, HAS TOTALLY VIOLATED ITS AGREEMENT WITH US. So much for being Mr. NICE GUY!”—a statement that reignited geopolitical tensions and added to market uncertainty.
🔥 Identify:
Gold price is in great competition between buyers and sellers around the price range of 3200 - 3300. Tariff policies are coming back, the trump administration is putting pressure to get favorable tariffs.
🔥 Technically:
Based on the resistance and support areas of the gold price according to the H4 frame, NOVA identifies the important key areas as follows:
Resistance: $3332, $3365
Support: $3244, $3204
🔥 NOTE:
Note: Nova wishes traders to manage their capital well
- take the number of lots that match your capital
- Takeprofit equal to 4-6% of capital account
- Stoplose equal to 2-3% of capital account
- The winner is the one who sticks with the market the longest