GOLD ANALYSIS Based on technical analysis gold is in a bullish trend and we should only be looking for buys.
Expect a pullback double tap near the 50% reversal zone for a buy entry.
Risk Reward- 1% : 3 or your TP can be the 4H HH zone.
Keep your trading plan simple and only take quality trades in the direction of the trend. The trend is your soulmate.
Longsetup

Bullish Divergence on Bigger tf.4337 - Closed at 4.35 (26.05-2025)
Bullish Divergence on Bigger tf.
4.15 - 4.30 seems to be a Strong Support.
But needs to cross & sustain 4.45 at
least for further upside.
It has the potential to touch 5.35 - 5.50
& then 6 -7

Short-Term BTC Scalping Opportunity⚡Say less
💥Setup and forget
💥the position is off if price hits 111,959 first.
💥leverage maybe used according to your risk management

Xrp- a small case for upsideRipple is a coin that is loved fervently by retail and despised vehemently by crypto natives. People who spend the bear market in the trenches tend to avoid it due to skepticism about FDV and other metrics and then retail comes in for a blip in time and pumps it to Valhalla and dumps on crypto natives and leaves without explaining.
If bitcoin hits 250k , retail is coming back and pumping this to $9.
Downside : price is currently trending near previous ATH of 2018 so there's a risk of double top and crash to 50¢
Upside : dark days are behind us. Why zoom out more than necessary. Worst is behind us. We're in an uptrend.
minor downside : oh no, we zoomed in too hard and the chart seems to be in a downtrend. well it doesn't matter unless you're high leveraged . Zoom out moderately, relax for a bit, and wait for retail to arrive.

$PENGU Approaching Apex – Breakout Watch On!CSECY:PENGU is forming a symmetrical triangle on the 4H chart, and price is getting close to the apex.
It’s currently holding above the support trendline and the 200 EMA a key zone to watch.
A breakout above the triangle could push the price toward the $0.022–$0.023 range.
I’m watching closely. If it breaks out with strong volume, it could be a solid setup.
Use a tight stop-loss and manage your risk properly.

MARUTIi Observed these Levels based on Price Action and Demand & Supply which is my own Concept "PENDAM CONCEPTS"... Please don't take any trades based on this chart/post... Because this chart is for educational purpose only not for Buy or Sell Recommendation... Thank Q

OMNI ANALYSIS📊 #OMNI Analysis
✅There is a formation of Descending Channel Pattern in daily time frame in #OMNI .
Also there is a perfect breakout and retest. There is an instant trending formation in #OMNI and if #OMNI breaks the trend line then we would see a bullish trend .
👀Current Price: $2.74
🎯 Target Price : $7.49
⚡️What to do ?
👀Keep an eye on #OMNI price action and volume. We can trade according to the chart and make some profits⚡️⚡️
#OMNI #Cryptocurrency #Breakout #TechnicalAnalysis #DYOR

Gold price accumulates above 3300, new week⭐️GOLDEN INFORMATION:
Gold (XAU/USD) faced some selling pressure around the $3,335 mark during Monday’s early Asian session, as easing trade tensions slightly dampened demand for the safe-haven asset. The recent softening in rhetoric surrounding global trade disputes has contributed to the metal’s pullback, though upcoming economic events could shift momentum.
On Sunday, US President Donald Trump announced a delay in imposing the proposed 50% tariffs on the European Union until July 9, easing fears of an imminent escalation in trade hostilities. This development has weighed on bullion prices by reducing immediate risk aversion in the markets.
Nonetheless, investor attention now turns to Wednesday’s release of the FOMC Minutes, which could offer further clarity on the Federal Reserve’s monetary policy outlook. Meanwhile, market participants will continue to monitor trade negotiations between the US and Japan, as well as other major economies. Any renewed tensions or setbacks in these discussions could quickly revive demand for gold as a protective hedge.
⭐️Personal comments NOVA:
Gold prices reacted slightly lower after the official announcement of tariff postponement. Accumulated above 3300
⭐️SET UP GOLD PRICE:
🔥SELL GOLD zone : 3388- 3390 SL 3395
TP1: $3376
TP2: $3363
TP3: $3350
🔥BUY GOLD zone: $3301- $3299 SL $3294
TP1: $3312
TP2: $3325
TP3: $3338
⭐️Technical analysis:
Based on technical indicators EMA 34, EMA89 and support resistance areas to set up a reasonable BUY order.
⭐️NOTE:
Note: Nova wishes traders to manage their capital well
- take the number of lots that match your capital
- Takeprofit equal to 4-6% of capital account
- Stoplose equal to 2-3% of capital account

Nvidia Update ahead of Quarterly results In this video I recap my previous Nvidia video where I anticipated a rangebound price action with the possibility of a new low for longs leading towards Quarterly earnings.
With the highly anticipated results only days away I outline the possibility for price to pull back into a really strong level of support for a possible long entry .
Tools used
TR Pocket
Fibonacci
Anchored VWAP
Volume Profile
Thankyou for your continued Support

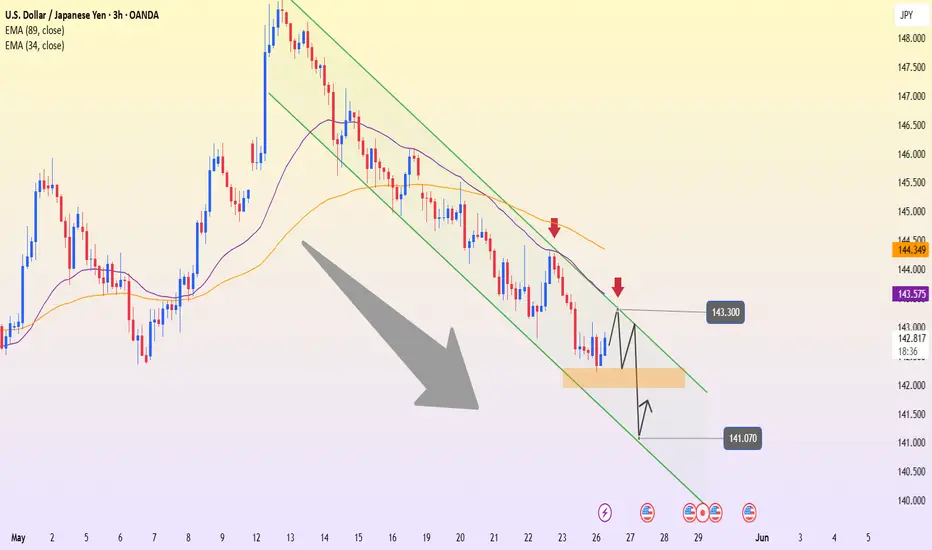
USDJPY – Bearish Channel Holds, Eyes on Support BreakUSDJPY is currently trading within a clearly defined bearish channel on the 3H timeframe, consistently forming lower highs and lower lows. After a slight bounce from the 142.50 support zone, the price is now heading toward the 143.30 resistance area — which aligns with the upper boundary of the channel. This is a zone likely to face rejection and renewed selling pressure.
On the news front, Moody’s recently downgraded the U.S. credit rating due to concerns over prolonged budget deficits, putting pressure on the USD. Although the interest rate gap between the Fed and the BoJ still favors the dollar, current market sentiment is making it harder for USDJPY to maintain a strong rally.
If the 143.30 resistance holds, the price is likely to be pushed back down to retest the 141.07 support zone — a previous low and the lower boundary of the descending channel. A confirmed break below this level would signal further downside, with the next target below the 140.00 mark.
ETHUSD📊 1H Analysis – ETHUSD
Strategy: 🐊 Alligator Strategy
Trend: 📈 Strong Uptrend
📝 Trade Plan
🎯 Entry Point (EP): 2577
🛡️ Stop Loss (SL): 2514.76
💰 Take Profit 1 (TP1): 2645.46
🚀 Take Profit 2 (TP2): 2706.17
🔄 Execution:
Open two trades at the Entry Point (2577)
When TP1 hits, move SL to EP for the remaining trade
Let the second trade ride to TP2 or more

NIFTYi Observed these Levels based on Price Action and Demand & Supply which is my own Concept "PENDAM CONCEPTS"... Please don't take any trades based on this chart/post... Because this chart is for educational purpose only not for Buy or Sell Recommendation... Thank Q

ETHUSD📊 1D Analysis – ETHUSD
Strategy: 🐊 Alligator Strategy
Trend: 📈 Strong Uptrend
📝 Trade Plan
🎯 Entry Point (EP): 2577
🛡️ Stop Loss (SL): 2514.76
💰 Take Profit 1 (TP1): 2645.46
🚀 Take Profit 2 (TP2): 2706.17
Open two trades When TP1 hits move your SL to Entry point for and ride TP2.

$NXPC Rebounding from Golden Zone!!$NXPC
Based on the Fib retracement, the price is currently sitting in the golden zone between 0.5–0.618 levels a common area for strong bounces.
Also, the price is reacting well near the demand zone, and a small falling wedge has just broken out.
This setup offers a clean risk-reward with tight invalidation.
I’m keeping a close eye on it could be a solid opportunity if momentum builds.

1.15150 Resistance Looms Amid EU Economic WoesOn the daily timeframe, EURUSD continues climbing toward the strong resistance zone around 1.15150 after a solid rebound from the EMA 34. However, the current candlestick structure shows signs of slowing momentum as price approaches a historically significant top — a zone prone to short-term profit-taking.
The technical setup becomes even more relevant when viewed alongside macroeconomic developments: the U.S. has just announced an extension of its 50% tariff deadline on EU goods from June 1 to July 9, temporarily easing trade tensions. However, the European Commission has revised down its Eurozone growth forecast for 2025 from 1.3% to 0.9%, highlighting persistent structural weaknesses and economic risks in the region.
The likely scenario: EURUSD may face rejection at 1.15150, followed by a pullback toward the support area around 1.09610. This zone aligns with the EMA 34, EMA 89, and a previous accumulation range. If this support fails to hold, the medium-term trend could shift clearly to the downside.

XAUUSD – Signs of Weakness at the Pressure ZoneToday’s market has low trading volume as both the UK and the US are on holiday. This makes price action more prone to “choppy” movements within a narrow range, and technical signals tend to become more reliable.
Gold is approaching a strong resistance zone around 3,420 – a level that previously triggered a sharp drop in early May. Based on the current technical structure, it’s clear that gold is entering a “pressure zone,” as upward momentum slows down and recent candles start to show hesitation.
The most likely scenario is a rejection at 3,420, followed by a pullback toward the 3,250 support area – where EMA 34 and prior accumulation volume converge. If this zone fails to hold, the next target could be around 3,170.
We don’t always have to “call the top,” but this is definitely a time to dial back bullish expectations and closely monitor price action in this sensitive area.

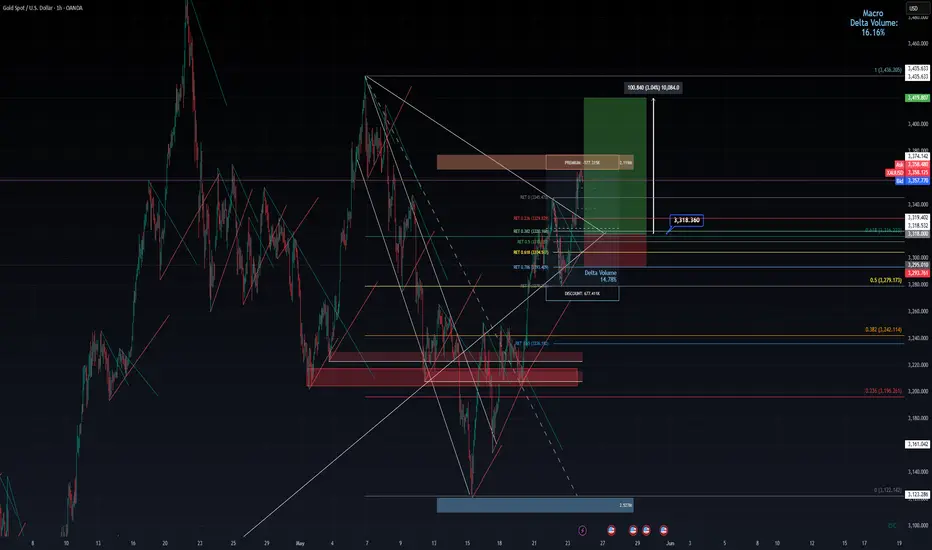
Gold swing trade idea target 1000 pips
* **Pair**: XAUUSD
* **Timeframe**: 1H (1 Hour)
* **Platform**: TradingView (OANDA feed)
* **Trade Type**: Long (Buy)
* **Entry**: 3,318.36
* **TP (Take Profit)**: \~3,419.30
* **SL (Stop Loss)**: Likely in the 3,290–3,295 range (based on visual zone)
---
## 🔍 Trade Breakdown
### ✅ **1. Pattern Recognition: Symmetrical Triangle Breakout**
* The white converging trendlines form a **symmetrical triangle** — classic continuation or reversal structure.
* **Breakout occurred to the upside**, triggering the long entry at 3,318.
* **Volume Delta Box** just below shows accumulation, suggesting smart money positioning pre-breakout.
---
### 🧠 **2. Confluence Zone for Entry**
* **Entry** level (3318.36) is:
* **Just above 0.618 Fibonacci retracement**
* Sits at the **triangle apex breakout retest**
* Inside a high **delta volume node** (buyers outpaced sellers)
This suggests **institutional accumulation** and a **"discounted" long entry** relative to prior range.
---
### 🔁 **3. Fibonacci Levels**
* The chart includes multiple Fib retracement overlays:
* From most recent **impulse wave down** and **overall swing**
* 0.5 and 0.618 retracement zones align with:
* **Rejection-to-support flip**
* Breakout confirmation levels
* This is a classic **smart money technique**: wait for structure break, enter on retrace to equilibrium (0.618/0.5).
---
### 📦 **4. Order Blocks and Imbalance Zones**
* Several **red and orange blocks** highlight prior **liquidity zones**:
* The large red zone below entry (around 3,295) was swept, likely inducing stop hunts → now **demand zone**
* Entry avoids this volatility and lands **just above reaccumulation zone**
* Also a visible **imbalance fill area** around 3,318, now tested and held — supporting bullish case.
---
### 🧮 **5. Risk-Reward and Positioning**
* **TP** at \~3,419.30 (just below 3,435 structure high) gives **R\:R over 3:1**, possibly even 4:1.
* SL is **tight under recent minor low** and under discount zone, which is key.
* Clear definition of:
* **Premium pricing** (target)
* **Discount pricing** (entry)
* Fits within a **smart money concept (SMC)** framework.
---
### 💡 Summary of the Method Used
| Element | Technique Used | Notes |
| ---------------- | --------------------------- | ---------------------------------------- |
| **Structure** | Symmetrical Triangle | Breakout to upside confirmed |
| **Volume** | Delta Volume & Order Blocks | Accumulation below breakout |
| **Fib Tools** | Multi-layered retracements | Entry at 0.618 area, TP at Fib extension |
| **SMC Concepts** | Discount/Premium Zones | Entry in discount, targeting premium |
| **Risk-Reward** | \~3:1 to 4:1 | SL tight, TP near major structure high |
---
### 🟢 Professional Verdict
This trade setup is **technically sound** and based on **smart money concepts**, **volume profile**, and **price structure breakout**. It uses:
* Entry at value (post-breakout retest)
* Strong confluences (Fib, trendlines, volume delta)
* Defined risk, clean target
* Logical narrative: **accumulation → breakout → retest → expansion**
If price holds above 3318 and momentum continues, the **3419–3435 zone is very reachable**.
BTCUSDT – Hitting resistance, is selling pressure returning?Bitcoin is showing signs of losing momentum after touching the resistance zone around 111,669. On the H4 timeframe, the previous bullish structure has stalled with a series of red candles and a clear pullback, bringing price back to test the EMA 34 zone.
In terms of news, although the market remains excited due to expectations surrounding a Bitcoin spot ETF, many large investors are starting to take profits after the recent sharp rally. This is causing selling pressure to slightly outweigh buying in the short term.
The most likely scenario now is that BTC could make a mild upward move to retest the 111,600 area – but if it fails to break above, a reversal back toward the support zone at 105,800 is highly probable. This area aligns with the EMA 89 and a previous accumulation zone.
Current strategy: don’t get caught in a false breakout. Instead, watch the 111,600 area and wait for a clear signal. If a reversal candlestick pattern appears, short-term sell entries may be considered with a target near the lower support.

EURUSD – Testing Key Resistance, Signs of a Pullback EmergingEURUSD is gradually approaching the strong resistance zone around 1.142 – a level that has rejected price at least twice in the past. The recent bullish momentum is clear, but the current move is nearing a major barrier, increasing the likelihood of a short-term pullback.
If the price fails to break this zone and rejection signals appear, a drop back toward the support area around 1.125 is highly possible – this level aligns with the EMA 89 and recent swing lows. It will be a key area to watch where the market might “take a breath” before deciding the next direction.
The current strategy is to patiently observe price action at this resistance zone. If confirmation appears, this could offer an opportunity for short-term sell setups. However, if the price decisively breaks above 1.142, the bearish scenario would be invalidated.

XAUUSD holds the trend – Will it break through 3,440?Gold continues to maintain a strong uptrend on the daily timeframe, supported by a rising trendline and upward-sloping EMA 34 and EMA 89. The price is now approaching the key resistance zone at 3,440 – a level that has been rejected twice in the past – making a slight pullback entirely possible.
However, the market structure shows no signs of reversal, and any dip toward the support area around 3,210 could present a “buy on dip” opportunity. As long as the price remains above the ascending trendline, the primary trend is still upward.
Traders are advised to patiently wait for clear signals near support rather than FOMO at resistance. If the 3,440 barrier is broken successfully, bullish momentum may accelerate toward higher targets.

Solana | SOL spot TRADE SETUP +65%Firstly, let's look at the SOL chart from a larger view to confirm the agreement for a bullish setup.
What we see above is a clear bullish bottom, followed by a sharp V-Shaped recovery in the daily timeframe.
From here, the ideal entry could be within this zone, either dollar-cost average or just one spot buy:
With the STOP-LOSS around here:
And THREE TP (take profit) points:
1️⃣
2️⃣
3️⃣
Naturally with the timeframe of your HOLD increasing as your target moves higher.
_________________________
BINANCE:SOLUSDT

$GRASS just broke out of a long-term downtrend!$GRASS just broke out of a long-term downtrend!
#GRASS has broken out of a long-term symmetrical triangle and flipped the trend bullish.
Price is currently holding above the breakout zone and also respecting the 0.786 fib level from the recent range.
As long as it stays above the $2.13–$2.14 zone, the move toward $2.60+ looks likely.
This breakout could be the start of a bigger trend shift. Let’s see how it holds up in the coming days.
DYOR, NFA
