$METIS Breakout Complete – Retest in Progress!!SEED_DONKEYDAN_MARKET_CAP:METIS just completed a massive breakout and is now cooling off!
The downtrend is now over. The price broke through resistance and is currently re-testing important levels.
Two clear scenarios from here:
A bounce at the $21 level will initiate the next wave up.
A dip at $18–19 will provide a golden entry before a strong rally next.
Focusing on $25+ soon with increasing momentum.
The staging is tidy and the repositioning is only just starting.
DYOR, NFA
Longsetup

$ATOM Ready for Liftoff – 100%+ Move on the TableNASDAQ:ATOM has just broken out of the trendline and is converting the major resistance into support.
This breakout could be the start of something huge - the chart shows potential 100 %+ movement ahead of it.
Looking forward to a retest around the $4.73 mark before the next move upwards towards $10+.
Momentum looks solid, this could take off soon 🚀
Retweet if you are bullish!
#ATOM #Altseason2025

KLV Breakout Confirmed: Ready for the Next Leg Up!$KLV appears to be prepared for the next big move! 🔥
The breakout has occurred, and the resistance has been converted to support.
A tiny pullback at this level can set up a strong bounce.
Everything looks good; volume is building, momentum is strong, and there’s an unobstructed path to upper targets.
The subsequent crucial zone is around $0.0042+
Still early… don’t ignore this chart 👀
#KLV #CRYPTOMOJO_TA

SUI - Leveraging Fibonacci & Elliott for Precision TradesSUI’s movement is rapid, sharp swings—both up and down. In volatile conditions like this, we aim 0.702–0.786 fib retracements (and occasionally 0.886 in harmonic contexts) for high‑probability entries. Below is a clear, Elliott-focused breakdown of the current setup and both long and short trade plans.
Before diving into the charts, let’s cover the basics of Elliott Wave Theory. Elliott Wave Theory provides a roadmap for market psychology by dividing price action into two distinct phases:
1. Impulse Phase (Waves 1–5)
Wave 1: The spark that ignites a new trend as early adopters push prices beyond the prior range.
Wave 2: A corrective pullback that tests the strength of the emerging trend, often retracing 38–61.8%.
Wave 3: The powerhouse wave—typically the longest and most dynamic—driven by broad market participation and often extending to key Fibonacci levels (1.618, 2.618).
Wave 4: A consolidating correction that digests gains and builds the base for the final thrust; it must not overlap Wave 1 territory in a classic impulse.
Wave 5: The final leg of the advance, often fueled by last bursts of optimism and weaker hands.
2. Corrective Phase (Waves A–B–C)
Wave A: Initial counter-trend reaction as profit-taking begins.
Wave B: A deceptive retracement back toward the trend, frequently trapping traders.
Wave C: The concluding leg of the correction, which typically tests or breaks the low of Wave A before the next cycle begins.
Key Points:
Impulse waves showcase momentum and structural clarity, often aligning with Fibonacci extensions.
Corrective waves follow Fibonacci retracements (38.2%, 50%, 61.8%), offering optimal entry points.
Wave 3 is seldom the shortest; Wave 4’s complexity sets the stage for Wave 5’s final push.
In the current SUI structure:
Wave 1 ignited the initial rally.
Wave 2 delivered a healthy retracement, a pullback close to the 0.618 fib, setting the stage for stronger momentum.
Wave 3 roared to a powerful peak topped at the 2.618 extension ($3.875)
Now, we’re deep into Wave 4, likely an ABC corrective pattern. This pause is critical—it gathers energy before the final push of Wave 5. Below is a clear breakdown of each wave, big-picture confluences, and trade setups.
🚀 Elliott Wave Overview
1. Wave 1 & Wave 2
Wave 1: Quick surge from $2.4175 → $2.75, setting initial momentum.
Wave 2: Pulled back close to the 0.618 fib, creating a solid launchpad.
2. Wave 3: The Power Move
Peak: Hit the 2.618 extension of Wave 1→2 and aligned with the –2 extension of Wave 1.
Significance: In strong bull markets, a run to the 2.618 extension often precedes a meaningful pullback. Here, Wave 3’s exhaustion suggests a retrace toward the 38.2% Fib of that advance—our ideal Wave 4 entry zone.
3. Wave 4: The Correction
All eyes on the $3.17 level—the projected 1:1 extension of A→B and 0.382 fib retracement of Wave 3. This confluence zone is yet to be tested and could offer an ideal Wave 4 entry.
ABC Pattern: Currently working on Wave C.
4. Wave 5: The Finale
Target Zone: $4.00–$4.35, with strong focus at $4.31
Extension Levels:
1.133 → $3.9695 aligns with the 0.618 fib retracement.
1.272 → $4.0683 is close to the weekly resistance level.
1.412 → $4.1678 alings with the 0.666 fib retracement.
1.618 → $4.3142 alings with the key swing high.
🔑 Key Confluence Levels
Golden Pocket: $3.9739–$4.1492 (90-day retrace).
Speed Fan 0.618: Support around $3.15.
Fair Value Gap:
Psychological: $3.00 major support.
📈 Long Trade Setup
Entry Ladder: $3.25–$3.111 (stack orders to DCA)
Stop‑Loss: $3.07 (just below the 0.786 Fib low)
Profit Targets:
Fib 1.133 at $3.9795 ($4 psychological & partial take‑profit)
Fib 1.272 at $4.0683
Fib 1.412 at $4.1678
Fib 1.618 at $4.3142
Risk:Reward: ~6:1+ (average entry around $3.20 → SL at $3.07 → TP1 at $3.9795)
📉 Short Trade Setup
Entry Zone: $4.00–$4.35 (sweet spot at weekly level/yearly open)
Confirmation: Bearish reversal candle or volume spike down
Stop‑Loss: Above $4.35
Target: $3.77 (near Wave 3 high turned support)
Risk:Reward: ~2:1 (varies with DCA entry)
⚙️ Summary & Game Plan
Primary Bias: Long in the $3.25–$3.111 zone—stack into the 0.382-0.412 fib retracement entries with tight SL, aiming for the $4.00–$4.30 upside zone.
Alternate Bias: Short on a clear rejection within $4.00–$4.35, targeting $3.77 or lower.
Risk Management: Keep stops tight to maximize R:R.
Patience & Confirmation: Wait for price to reach these zones and show reversal signals (price action, volume, patterns) before committing.
All set—now let SUI’s swings unveil the opportunities. Sit tight, follow your plan, and let patience pay its dividend.
Happy Trading!
____________________________________
If you found this helpful, leave a like and comment below! Got requests for the next technical analysis? Let me know.

#MEME #MEMEUSDT #MEMECOIN #LONG #SWING #Eddy#MEME #MEMEUSDT #MEMECOIN #LONG #SWING #Eddy
MEMEUSDT.P SWING Long Setup
Important areas of the upper time frame for swing are identified and named.
This setup is based on a combination of different styles, including the volume style with the ict style.
Based on your strategy and style, get the necessary confirmations for this Swing Setup to enter the trade.
Don't forget risk and capital management.
The entry point, take profit point, and stop loss point are indicated on the chart along with their amounts.
The responsibility for the transaction is yours and I have no responsibility for not observing your risk and capital management.
By scratching the price and time bar, you can see the big picture of targets.
Buy Position "LONG" Spot & Future Details :
Entry : 0.002662
Stop : 0.002616 (( 1.73% ))
Target 1 : 50% Spot
Target 2 : 100% Spot
Target 3 : 500% Spot
Target 4 : 1000% Spot
Target 5 : 1500% Spot
Target 6 : 2000% Spot
Be successful and profitable.

SUI Elliott Wave Meets Fibonacci: Wave 5 Setup ExplainedSUI has once again delivered a textbook display of wave structure, Fibonacci precision, and anchored VWAP interaction. After finishing Wave 4, price surged upward, tagging key fib levels and now consolidating at a critical decision point. The next high-probability trade opportunity is forming — and it’s one worth watching closely.
📈 Recap of the Current Move
After completing Wave 4, SUI surged right into the golden pocket — the 0.618 Fibonacci retracement of the entire 90-day downtrend (measured from the $5.3687 high to the $1.7174 low). That golden 0.618 sits at $3.9739, with price currently hovering just below at around $3.965.
In our previous analysis, we noted SUI’s tendency to respect trend-based Fib extensions. That pattern is holding beautifully.
Projecting from Wave 1 to Wave 2 of the current impulse wave, price once again nailed the 2.618 Fib extension — at exactly $4.10. That extension aligned perfectly with the 0.65 retracement of the 90-day wave at $4.0907, forming a significant resistance confluence.
2.618-1.618 fib:
The result? A healthy ~7% rejection, pulling SUI back into a support zone formed by three previously broken swing highs — $3.875, $3.8121, and $3.7666 — now acting as support.
🔺 Wave 4 Structure: Triangle Formation & Key Retest Levels
SUI has now been consolidating for ~1.5 days, and price structure shows a developing triangle — a classic Elliott Wave Wave 4 pattern.
But while triangles often resolve higher, we can’t ignore the Fibonacci roadmap:
The 1.618 trend-based Fib extension (drawn from Wave 1 → Wave 2) sits at $3.7619.
This level aligns almost perfectly with the key swing high at $3.7666.
In the previous Wave 3–4 sequence, price also retested the 1.618 extension — a pattern that could repeat now again.
So, despite the bullish triangle breakout potential, there’s still a high likelihood that price dips slightly to retest the 1.618 Fib zone at $3.76–$3.77.
📊 Anchored VWAP Confluence: Even More Support
To further strengthen this thesis, we’ve anchored VWAP from the recent swing low at $3.12. That VWAP (yellow line) now sits at $3.745 — just beneath the 1.618 Fib and in perfect confluence with the swing high cluster.
This creates a tight demand pocket between $3.74 and $3.77, where four technical tools align:
→ 1.618 trend-based Fib extension
→ Anchored VWAP from $3.12
→ Broken swing highs now acting as support
→ 0.382 Fib Retracement of Wave 3
This is where smart money looks to accumulate — not at the top of the triangle, but where liquidity gets transferred.
🧠 Outsmarting the Crowd: Trap & Trigger
Many breakout traders are positioning within the triangle, with stop-losses just beneath. If price dips into the $3.74–$3.77 range, it would sweep those stops and fill orders from traders waiting patiently at this confluence.
This creates a classic “switching hands” moment: breakout longs are stopped out, and Fibonacci-aligned buyers step in just as price hits the sweet spot.
To be part of the 1% in trading, you need to be thinking one step ahead — not where price is now, but where it needs to go to trap the many and reward the few.
🎯 Long Trade Setup
Entry Zone:
$3.77 preferred
Laddered from $3.76–$3.74
Stop-Loss Options:
Tight: Below $3.70 (2% buffer)
Loose: Below $3.52 (golden pocket of previous Wave 3)
Targets:
Conservative: $4.28
Primary: $4.41
Aggressive Extension: $4.5873 (0.786 retracement of full 90-day move)
R:R Potential:
Tight SL: ~2.5:1
Loose SL: 6:1+
📆 Weekend Trading Note
We’re currently in weekend session flow — often thinner liquidity and more prone to wicks. While the structure is strong, wait for confirmation and avoid FOMO entries at the top of the triangle.
✅ Wrapping It Up
SUI remains in a clean, bullish market structure and continues to respect Fibonacci and trend-based extensions to the letter. With price above key swing highs, holding structure, and anchored VWAP adding confluence, the $3.74–$3.77 zone is setting up as a high-probability entry for the next wave.
Smart money doesn’t chase — it anticipates. Be the 1% who sees beyond the triangle and understands where the real opportunity lies.
Happy Trading!
___________________________________
If you found this helpful, leave a like and comment below! Got requests for the next technical analysis? Let me know.

BTCUSD Technical Analysis – Is a Pullback Coming Soon?BITSTAMP:BTCUSD is currently trading within a clearly defined ascending channel, with price action now testing the upper boundary. This level may act as a dynamic resistance, and rejection here could trigger a corrective move towards the $98,000 support zone.
If buyers defend this support level, the bullish structure remains intact, with potential to move back toward higher levels. However, if price breaks below this zone, there will be little to stop it from falling further.
Monitoring candlestick patterns and volume at this key area is essential to identify potential buying opportunities. Risk should be managed properly—always confirm your setups and trade with solid risk management.
If you have any thoughts on this setup or additional insights, feel free to share them in the comments!

ENS ANALYSIS📊 #ENS Analysis
✅There is a formation of Falling Wedge Pattern on 12 hr chart and currently trading around its major support zone🧐
Pattern signals potential bullish movement incoming after the breakout of resistance 1
👀Current Price: $22.58
🚀 Target Price: $31.29
⚡️What to do ?
👀Keep an eye on #ENS price action and volume. We can trade according to the chart and make some profits⚡️⚡️
#ENS #Cryptocurrency #TechnicalAnalysis #DYOR

TWT ANALYSIS🚀#TWT Analysis :
🔮As we can see in the chart of #TWT that there is a formation of "Falling Wedge Pattern". Some time ago the same structure was made and it performed well and this time also the same is happening with a perfect breakout
🔰Current Price: $0.8464
🎯 Target Price: $1.0865
⚡️What to do ?
👀Keep an eye on #TWT price action. We can trade according to the chart and make some profits⚡️⚡️
#TWT #Cryptocurrency #TechnicalAnalysis #DYOR

SOL Analysis Deep Dive: Identifying Optimal Entry and Exit ZonesYesterday, SOL gave a sharp downside shakeout, dropping from the weekly open at $147.98 (perfectly retested) down to the 0.5 Fib retracement of the swing at $140.25. Here’s a structured breakdown of the key levels, trade setups, and R:R profiles for both longs and shorts:
🔑 Key Levels & Confluences
1. Higher-Timeframe Opens
Weekly Open & Retest: $147.98 – pivoted price before the drop
Monthly & Prior-Day Open Cluster: $147.98–$146.31 – strong support confluence zone
2. Fibonacci Support Zones
0.5 Fib at $140.25 – primary mean-reversion entry
0.786 Fib (smaller wave) at $138.78 – secondary, deeper support
3. Order Block
Daily Bullish Order Block at $139.87 – just below 0.5 Fib, adds extra support
4. Volume-Weighted Average Price
Anchored VWAP (from ATH $295.83) at ~$166.45 – key upside resistance
5. Market Profile Value Areas (10-Day Range)
Value Area High (VAH) at ~$153.00 – overhead resistance confluence
Value Area Low (VAL) at ~$145.75 – underpins support
📈 Long Trade Setups
1. 0.5/0.786 Fib + Daily Bullish Order Block
Entry: $141-138.78
Stop-Loss: $137.5
Target: $165 (anchored VWAP / Fib zones)
R:R ≈ 9:1
2. Higher-Timeframe Open Cluster
Entry Zone: $147.98–$146.31(monthly/weekly open)
Stop-Loss: $142.5
Target: $165
R:R ≈ 3:1
• Why these levels? The 0.5 Fib is a classic mean-reversion zone, bolstered by the daily order block. The $147–146 zone ties together multiple opens (weekly, monthly, prior-day), offering a solid demand area if price retraces back up.
📉 Short Trade Setup
Trigger: Rejection / swing-failure around $153.4
Entry: $153.4
Stop-Loss: $154.3
Target: Weekly/Monthly open (~$147)
R:R ≈ 6:1
• Low-risk short: A clean rejection at the recent high lets you define risk tightly above the swing, aiming to capture the retrace back to the opens.
🎯 Summary & Game Plan
Primary bias: Look for long entries at the 0.5 Fib ($140.25) or the open-cluster zone ($147–146), with targets toward the anchored VWAP at ~$166.
Alternate bias: A short on clear rejection from $153.4, targeting the opens as support.
Risk management: Keep stops tight (SL below $137.5 or above $154.3) to maximize R:R on your favored setups.
Volume & Price Action: Confirm entries with an uptick in volume or bullish price structure (for longs) or swift failure patterns (for shorts).
Now it’s a waiting game! Let price revisit these zones, watch for confirmation signals, and then scale into your chosen side. Good luck! Don't chase, let the charts come to you!
____________________________________
If you found this helpful, leave a like and comment below! Got requests for the next technical analysis? Let me know.

Bitcoin: Blood in the Streets – Now is the Time!Once again, there’s blood in the streets—and from this point on I start scaling into spot positions again, slowly but deliberately.
All of these are spot entries with soft stop-losses—not hard exits, but areas I’ll react to if needed.
So why now? For one, we’re sitting right above the 38,2% Fibonacci level for the ending of the wave A. At the same time, we’re about to tap into a daily Fair Value Gap, while trying to hold the range support—two important technical levels lining up on the higher time frame.
Below that, we have an untapped VWAP at $65.5K, which could act as a magnet, as it often does. And yeah—if we go under $62K or even $60K, the classic “time to work at McDonald’s” joke comes back. But seriously: in markets like this, you need to stay calm, have some humor, and most of all, know what’s possible.
So I’m cautiously watching the S&P 500 closely, which plays a big role in this setup for me.
That’s where I stand on BTC right now—careful optimism, grounded in context and reasoning for me.

Scenario #BTCUSDT long📉 LONG BYBIT:BTCUSDT.P from $104,353.0
🛡 Stop loss: $103,572.0
🕒 Timeframe: 1H
✅ Market overview:
➡️ The price confidently broke above $103,729 and held, confirming the uptrend.
➡️ The next target zone is $104,720–$105,090 — nearest movement objectives.
➡️ Volume increased during the impulse, indicating strong buyer presence.
➡️ A local support level formed around $103,729 — on a pullback, this zone may hold the price.
➡️ POC at $94,479 remains far below — the market has left the balance zone and is trading in an impulsive phase.
🎯 TP Targets BYBIT:BTCUSDT.P :
💎 TP1: $104,720.0
💎 TP2: $105,090.0
💎 TP3: $105,275.0
⚠️ Important: current structure BYBIT:BTCUSDT.P suggests possible correction (wedge breakdown), requiring caution or exit on key level loss.
⚠️ Despite the initial long from $104,353, a breakdown below $103,572 (stop loss) invalidates the long setup.
📢 If H1 closes below $103,572 — better to exit, scenario invalid.
🚀 Scenario BYBIT:BTCUSDT.P valid while holding above $103,729 — below that, correction likely toward lower targets!

#ETH Breakout is incoming!$ETH/USDT – Breakout Watch
Ethereum is currently retesting a key descending resistance line after an extended period of consolidation. The structure suggests growing bullish momentum.
🟢 A successful breakout and daily close above the $1,900–$2,000 zone could trigger a move toward $2,200–$2,400 in the coming sessions.
Watch for confirmation with volume expansion and retest behavior. Rejection at this level could delay the move, but the pressure is clearly building.
Key Levels:
Resistance: $1,900–$2,000
Target: $2,200–$2,400
Support: $1,800
Chart looks clean breakout potential is real.
DYOR NAF
BINANCE:ETHUSDT BITSTAMP:ETHUSD

SUI ANALYSIS📊 #SUI Analysis
✅There is a formation of Descending Channel Pattern in daily time frame in #SUI .
Also there is a perfect breakout and retest. Now we can expect a bullish move. If the price successful retest the major support zone then we will see more bullish move
👀Current Price: $3.89
🎯 Target Price : $4.25
⚡️What to do ?
👀Keep an eye on #SUI price action and volume. We can trade according to the chart and make some profits⚡️⚡️
#SUI #Cryptocurrency #Breakout #TechnicalAnalysis #DYOR

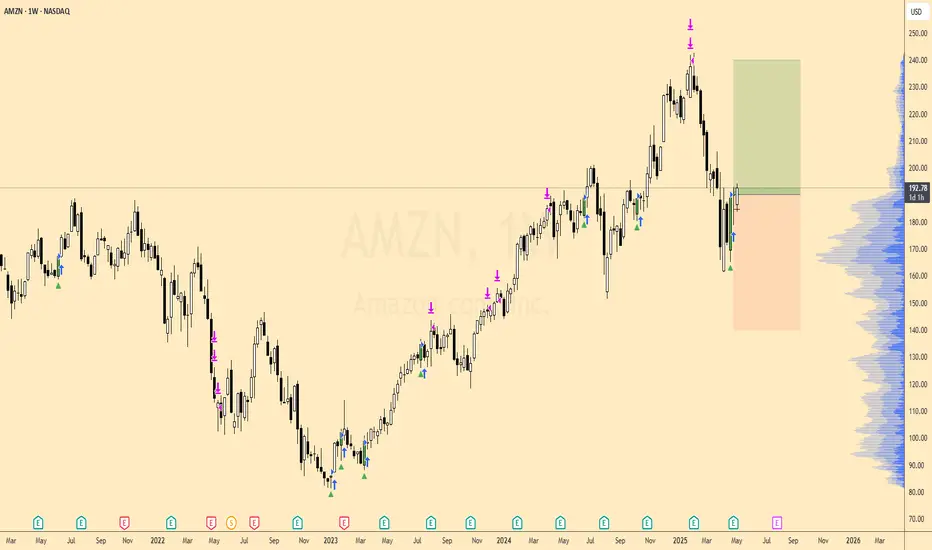
AMZN Weekly Bullish Setup - 91% Historical Win RateI’m looking to go long on Amazon (AMZN) on the weekly chart as the price that has acted this way has been a strong indicator for a swing trade in the past.
Since early 2023, AMZN has climbed from the mid-$70s to a peak above $245, carving out clear impulse moves followed by healthy pullbacks.
The current pullback has returned into the $185–195 region, which on the weekly VP shows the largest volume accumulation (HVN). Historically this zone has marked both places to buy into rallies and logical areas to defend.
We were in a 5 week range. Last week printed a bullish rejection candle (long lower wick), accompanied by my weekly “buy” arrow (green triangle). This mirrors 34 prior occurrences of the same pattern on AMZN’s weekly chart.
Targeting the $240 region, this is a 1:1 trade
GBPUSD: Bullish Fakeout at Key 50% Fibonacci Level🚀After a brief consolidation near the 50% Fibonacci retracement, price performs a bullish fakeout, signaling its intention to move higher.
The 14:00 candle stands out as a clear sign of strength from buyers.
🔍 Trade Setup
📍 Entry limit:
⛔ Stop Loss:
🎯 Take Profit:
⚖️ Risk/Reward: ≈
💬 What’s your outlook on GBPUSD?
Is this the start of a new leg up?
Share your thoughts in the comments 👇

DEXE ANALYSIS📊 #DEXE Analysis
✅There is a formation of Descending triangle pattern on daily chart 🧐
Pattern signals potential bullish movement incoming after a breakout.
👀Current Price: $14.68
🚀 Target Price: $18.50
⚡️What to do ?
👀Keep an eye on #DEXE price action and volume. We can trade according to the chart and make some profits⚡️⚡️
#DEXE #Cryptocurrency #TechnicalAnalysis #DYOR

$RATS Heating Up — 100% Move on the Table?$RATS – Pressure Building, Breakout Imminent
$RATS is quietly loading up for a massive breakout. Price has been grinding higher with strong demand stepping in at every dip — support structure is holding beautifully.
🧠 Key Observations:
Clean ascending structure
Consistent higher lows
Testing a major resistance zone
Volume creeping up = Accumulation signs
📈 Breakout Potential:
Once $RATS clears this resistance zone, the chart opens up for a sharp move — a 100%+ pump is well within reach based on the current range.
📌 What I’m watching for:
Break & close above resistance
Volume confirmation on breakout
Retest = entry zone for momentum chasers
The structure’s solid, the risk is tight, and the upside is explosive. Eyes on $RATS — the move could be BIG.Image

CYBER ANALYSIS🚀#CYBER Analysis : Pattern Formation
🔮As we can see in the chart of #CYBER that there is a formation Inverse Head And Shoulder Pattern and it's a bullish pattern. If the candle breaks and sustain above the neckline then a bullish move could be confirmed✅
🔰Current Price: $1.290
⚡️What to do ?
👀Keep an eye on #CYBER price action. We can trade according to the chart and make some profits⚡️⚡️
#CYBER #Cryptocurrency #TechnicalAnalysis #DYOR

Hidden Bullish Divergence +Hidden Bullish Divergence +
Closing above 298 is a +ve sign.
Immediate Support can be around 283 - 287.
Breaking 272 may bring more
selling pressure towards 246 - 250.

Link/USDT"This is Link . Based on the daily timeframe, we’re in an uptrend aiming for the targets you can see. If you enjoy this kind of analysis, make sure to like and subscribe to our channel!"


