LONG ON GBP/NZDGBP/NZD is respecting a major support zone and is currently ready to rise.
I will be buying GBP/NZD to the previous swing high looking to catch 200-300 pips throughout the rest of the week.
Longsetup

PCBLi Observed these Levels based on Price Action and Demand & Supply which is my own Concept "PENDAM CONCEPTS"... Please don't take any trades based on this chart/post... Because this chart is for educational purpose only not for Buy or Sell Recommendation... Thank Q

Buy with SLCan buy with SL 0.03454
TP 0.03480
Crossing & Sustaining 0.03509
may lead it towards 0.0565

Short-Term Trade Setup: NZDCAD Eyes 0.82898–0.83110 TargetsGood day Traders,
Trust you are well.
Below is my analysis of NZDCAD.
Overview:
NZDCAD is retracing from the recent high at 0.83050, currently trading around 0.82628. Price action is approaching a key support zone between 0.82470 – 0.82285, an area that previously triggered bullish reactions. Momentum indicators are showing bearish pressure, with red histogram bars visible on the chart.
Idea:
Although bearish momentum is present, the histogram shows a slight decrease in selling pressure, hinting at a potential slowdown in the current downtrend. If the pair holds above the 0.82287 level, it could signal a potential reversal or bounce. This would open room for bullish targets at: 0.82898, 0.83039 and 0.83110.
However, a confirmed break below 0.82287 could expose the next support around 0.82100.
Conclusion:
The pair is at a critical support zone, with decreasing momentum suggesting that sellers may be losing strength. A bounce from current levels could provide a short-term buying opportunity, while a break below 0.82287 would invalidate the bullish outlook.
Cheers and happy trading!

$KILO Setup Looks Prime — This Could Just Be the StartTSX:KILO is showing real strength right now.🚀
Price broke out of a clean downtrend and reclaimed the horizontal support zone. That reaction from buyers? Strong and confident.
The chart offers two clear scenarios, but both point to the same thing: more upside ahead.
Targets? $0.057 and $0.08 are on the radar.
The structure’s bullish, and momentum is shifting fast.
Looks like TSX:KILO is just getting started.
DYOR, NFA

$AVAAI Looks Ready to Explode — Don’t Blink!$AVAAI looks locked in for the next leg up.
After a clean breakout from the previous resistance zone, the price is now forming a solid base above its classic bullish structure.
The trendline’s been respected. Buyers stepped in early.
Volume’s healthy. Structure’s is strong.
In my view, the chart is screaming continuation.
$0.095 and $0.11 could come faster than expected.
Don’t blink, this move could get explosive.
DYOR, NFA
#ALTSEASON #CRYPTOMOJO_TA

$SUPRA Breakout Confirmed — Trend Reversal in Play!$SUPRA just flipped the script!
After months of bleeding under a brutal downtrend, it finally broke out clean and confident.
That long-term resistance? Crushed.
Now it's retesting the breakout zone, a classic reclaim move.
EMAs are curving up, momentum's clearly shifting.
In my opinion, this breakout confirms a trend reversal.
Buyers are stepping up.
$0.0096+ Looks like the next magnet.
like if you are bullish!

$CGPT Holding Strong — Another Move Coming?$CGPT is holding the uptrend well. 🚀
It bounced from the trendline and the 200 EMA, just like before.
The structure still looks strong with higher lows and steady volume.
This pullback could be the setup for another move up.
Watch this level closely.
Retweet if you are bullish!
DYOR, NFA
#Altseason2025

PATIENCE WILL PAY OFF 〉LONG TERM BUY COMING SOON.As illustrated, I'm trying to visualize what the next couple of weeks could look like.
Taking into consideration the fact that May + June are corrective months for gold historically (don't believe me; check the seasonality tool...) , Is likely for price to range up and down within quite a wide range anywhere between 3300 and 3100 before it enters a bullish continuation impulse by the end of June and into first week of July.
( I have illustrated 2 potential buying areas; one closer to price and another extended one lower )
That being said, one must adapt to such market conditions that will only offer certain structure offering a few intraday trades, but mostly short term trades or quick scalping moves all within a same trading session, simply because as each session comes in, they will target previous sessions highs or lows (ranging back and forth in an uncomfortable manner and without a clear direction).
Asia would target Sydney's open, then London might target Asia's open, then NY might target any low or high in the opposite direction... and so on back and forth without truly holding a bullish or bearish structure longer than a few hours to a full calendar day before it turns around (sideways behavior).
As price reaches "stronger psychological" price levels like 3150, 3100, 3050 and potentially 3000; then you might start seeing evident rejections within higher timeframes (4H and 1D); ideally seeing rejection wick/s followed by a nice push up showing true power and volume to the upside, potentially signaling the bottom of this correction phase.
TIME should be aligned with this market behavior; that means that checking the seasonality tool. every year (on average 5, 10 and 15 years), gold makes a bottom during the first week of JULY ...
So... market structure, price, and time must be aligned correctly and it will all make sense whenever that moment comes; hence, the title of this idea.
I am personally not worried about any sort of economic event; news are only gas for the market to move and create liquidity and volatility.
AT THIS POINT, THE ONLY THING THAT COULD TRIGGER A SIGNIFICANT MOVE IN GOLD, IS A GEOPOLITICAL EVENT THAT WOULD TRULLY TRIGGER UNCERTAINTY IN THE MARKETS... .
--
GOOD LUCK!
Persaxu

This AI-Backed IPO Is Just Warming Up — Next Stop: 86% Gains?CoreWeave is showing classic IPO 'honeymoon phase' price action, with early liquidity swept and bullish structure forming.
🔍 Price swept the daily sell-side liquidity at $35.70
📈 Now pushing higher — next major buyside targets at $55.04 and $65.22
🤖 Backed by NVIDIA, adding serious momentum and credibility
🧠 Expecting strong continuation as institutions begin to build exposure
If price maintains structure, this could be one of the strongest IPO moves of 2025.

OG ANALYSIS🔮 #OG Analysis 🚀🚀 Update
💲 #OG is trading in a Rising Broadening Wedge Pattern and currently retesting the major support zone. Now we can expect a bullish move after the retesting of support zone.
⁉️ What to do?
- We have marked crucial levels in the chart . We can trade according to the chart and make some profits. 🚀💸
#OG #Cryptocurrency #DYOR

Extremely Bullish.
Extremely Bullish.
Took Support from a very Important level around 136 - 140.
Hidden Bullish Divergence has appeared.
176 - 182 is a Resistance Zone.
Crossing & Sustaining 201, lead it towards 235 - 237.
On the flip side, 170 & 161 - 162 seems to be a Good Support level.

$UNH Rinse & Repeat Round #2- Fundamentally it's undervalued for the quality blue chip company. My detailed analysis is on the older post I made earlier this year. I have attached that as a reference.
- In my previous swing, I bought NYSE:UNH on a sell off @ 441 and sold @600 before earning as a de-risking strategy. I'm glad that it did work out.
- I'm happy that NYSE:UNH is again trading at a discount and with compressed Earning multiple. This time I am buying it even lower than where I bought last time i.e 441 and I was happy with that price average.
- Whereas I do believe that NYSE:UNH EPS is lowered but it is lowered slightly which doesn't warrant a big sell off like this.
- I wanted to wait further before entering but I can't stop myself from buying this name NYSE:UNH at a price where I believe it's very undervalued.
- Therefore, I have re-entered the NYSE:UNH and added it to my portfolio . I will consider adding further if selling pressure continues because I don't want to time the bottom.
- But undecisive market and lumpy market, going with a defensive name like this is a no brainer.

TAO/USDT – Long Setup ActivatedA potential bottom might be in place here.
🔍 Key confluences:
– Strong CVD rebound (spot + futures)
– Funding rate turning positive
– Top traders ratio shifting bullish (smart money buying the dip)
– Open Interest stabilizing after a clean flush
– And above all: my Scalp Cloud Signal just fired a bullish confirmation ✅
🎯 Targeting a short-term move to the 365–373 zone.
SL clearly defined below the local sweep.
💡 Tool used: Scalp Cloud Signal by The Degen Company
— Precision tool for scalping and micro trend shifts.

ETH ANALYSIS🔮 #ETH Analysis 🚀🚀
💲💲 #ETH is trading between support and resistance area. There is a potential rejection again from its resistance zone and pullback from trendline. If #ETH sustains above major resistance area then we will a bullish move till its major resistance area
💸Current Price -- $1,755
⁉️ What to do?
- We have marked crucial levels in the chart . We can trade according to the chart and make some profits. 🚀💸
#ETH #Cryptocurrency #DYOR

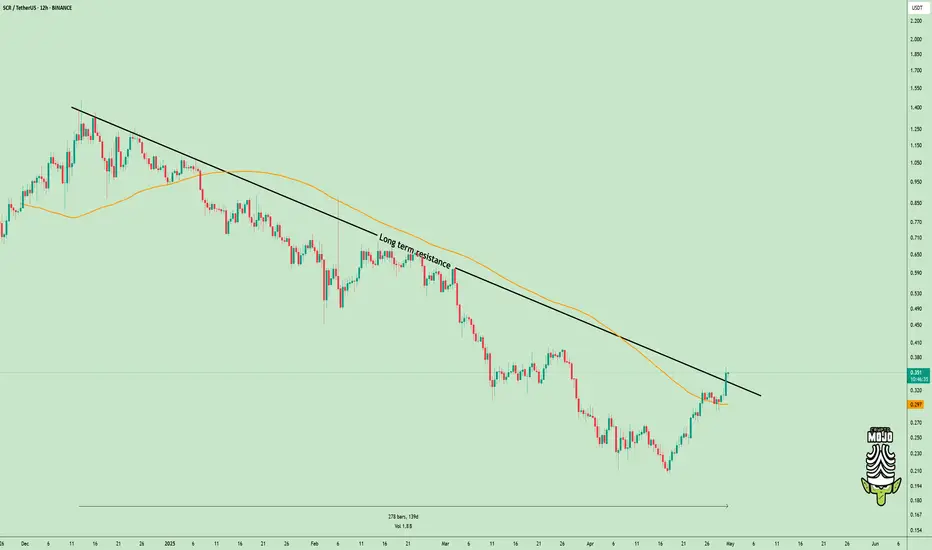
Downtrend Over? $SCR Just Flipped the Script!TSX:SCR just broke out after moving down for 139 days.
This isn’t just another pump, it’s a change in direction.
- Price broke the long-term downtrend
- Jumped above the 200 EMA
- Now testing the breakout zone again
If this area holds, bulls could take control and push higher.
It’s a clean setup, don’t ignore it.
DYOR, NFA
#ALTSEASON
HH HLMonthly Closing is good.
Weekly closing above 29.50 would
be very positive sign.
32 is the Immediate Resistance &
if 36.10 is Crossed & Sustained with
Good Volumes, we may witness 40 - 45.

ZEC ANALYSIS🔮 #ZEC Analysis
🌟🚀 As we said earlier #ZEC moved around 20%. Right now #ZEC is trading in an Ascending Triangle Pattern and here we can see that #ZEC moving again towards its neckline. We see see more bullish move in upcoming days
🔖 Current Price: $36
⏳ Target Price: $46
⁉️ What to do?
- We have marked crucial levels in the chart . We can trade according to the chart and make some profits. 🚀
#ZEC #Cryptocurrency #Breakout #DYOR

Bitcoin Upward Move Is Near
Bitcoin looks like it will have a temporary correction to the upside and then move higher after the interest rate announcement. The $110,000 mark is the main resistance that will be examined in the following analysis.

USDJPY 4h Long Setup | Low Risk High Reward Market broke the descending structure with strong bullish impulse followed by higher lows respecting new trendline
Price retested the previous resistance now turned support zone with a bullish reaction
Entry is taken after confirmation of the retest holding and bullish continuation signs
Entry : 142.494
SL : 140.676
TP : 148.270
RR 1 : 3.2
Price action aligned with short-term bullish reversal structure and clear demand zone defense
Let price do the work

AXS/USDT
AXS has been trading within a falling wedge pattern—a classic bullish reversal setup. Recently, the price broke above the upper resistance line of the wedge, indicating a potential trend reversal.
This breakout is supported by a long-term downtrend losing momentum, and a breakout confirmation through a retest may be forming. If the breakout holds, we could see a bullish move toward the next key resistance zone around 6.50 USDT, which is our primary target.
📌 Setup Summary:
Pattern: Falling Wedge (Bullish)
Breakout: Confirmed
Target: 6.50 USDT (TP)
Risk Management: Watch for price action near the retest zone
This setup aligns with our smart bot strategy which identifies breakout patterns and entry points automatically. Stay tuned for updates!

Stromm | S&P 500 & NASDAQ a RESISTANCE is NearThe S&P 500 and the Nasdaq are basically moving in lockstep right now — their structures look almost identical.
Starting with the S&P 500:
We’re currently trading into a 4-hour Fair Value Gap between $5,546 and $5,634, Sitting just under a 4-hour Order Block that could trigger a short-term reaction.
At the moment, though, it doesn’t really look like we’re going to flush all the way back down toward the $5,000 level (2-hour Order Block sitting much lower).
More likely?
This 4h Order Block just gives us a brief pullback, a minor reaction — and then price pushes higher again.
This would line up perfectly with my original scenario of Wave A completing around $4,805.
Personally, I’m already positioned around $4,800, so obviously, I'd love to see that level hold and price continue moving higher — ideally heading toward $6,000.
That would be the perfect extension — but nothing is guaranteed yet.
Still, structure right now leans bullish unless we see a sudden breakdown.
Now, for the Nasdaq CME_MINI:NQ1! :
Almost the same setup —
We have a 2-hour Order Block just above the current price, acting as short-term resistance,
And another 2-hour Order Block way lower, which now seems less likely to be tested unless something drastic happens.
So for the Nasdaq, the most realistic short-term scenario:
Hit resistance at the current 2h Order Block,
Maybe a small pullback toward 18,900–19,000,
Then continuation higher toward 20,000 or even 21,000 over the next few weeks.

Ethereum: The biggest Opportunity in 2025!Ethereum is following Bitcoin—but with way worse performance. While BTC is still holding up relatively well, ETH has dropped all the way back to March 2023 levels, wiping out the entire rally. Since its top, Ethereum is down over 63%. 😮💨
Still—or maybe because of that—I’m beginning to slowly scale into spot positions here.
Yes, we could fall further. I’ve got limit orders set lower, specifically around $1,260, which aligns with the 88.2% Fibonacci retracement and the midpoint of the monthly order block. That’s a key zone I’ll be watching if price keeps dropping.
That said, this Wave (2) should be nearing its final stage. The sell-off has been steep, and if we lose $804, that would flip Ethereum’s entire monthly structure bearish—a scenario I’d consider extremely negative.
I don’t expect ETH to suddenly blast past $5,000 from here, but at these levels, I see a clear opportunity to build longer-term spot exposure—and that’s exactly what I’m starting to do now.
