SOL Bulls Strike Back — But Is It Sustainable?Solana continues to respect technicals with precision — after a +42.9% move from the $95 low, we're now at a pivotal moment in price structure. Let’s break down what’s happening and where the high-probability setups lie.
📍 Key Bounce Zone – Golden Pocket Confluence
Local Low: $95.26
Golden Pocket Zone (0.618–0.666): $97.09–$94.82
This area acted as a major demand zone, with price sharply rebounding.
First Volume Spike: Followed by retracement into Golden Pocket Zone at $102.
Second Volume Spike: Occurred right after touching Anchored VWAP ($108.21) from the $95.26 low, which added beautiful confluence with the Golden Pocket Zone – a secondary high-conviction long entry.
📈 Rally to Resistance – Short-Term Climax
After the anchored VWAP retest, SOL rallied into the key resistance zone aligned with the 0.786 Fib retracement from the previous down move — a historically reactive level and a prime profit-taking zone.
Monthly 21 EMA ($135.83) and the monthly 21 SMA ($133) — both key dynamic resistance zones.
Low-volume retest of that key high suggests buyer exhaustion, not continuation — a classic setup for a short-term reversal.
🧭 Current Market Structure
Current Price Action: Trading above both the weekly open ($128.38) and the monthly open ($124.54).
This forms a critical S/R zone between $124–$128, now acting as a potential battleground for bulls and bears.
As long as price stays above this zone, momentum remains with the bulls.
🔍 What to Watch Next – Reclaim or Reject?
Key Support to Watch:
$125 (psychological level) and monthly open at $124.54 – This zone is likely to be liquidity-hunted. Expect a sweep of this low, look for the reaction.
Daily Support Confluence: currently at 21 EMA: $123.77 & 21 SMA: $123.27
1.) 📈 Scenario A – Bullish Reclaim:
If SOL sweeps the low and shows strong buying reaction (bullish engulfing candle, volume spike), it sets up a potential long opportunity towards the weekly open, to watch for the next reaction.
2.) 📉 Scenario B – Failed Hold:
If there's no bullish reaction at $124–$125, expect further downside.
First target = $122
Second target = $120.65
🎯 Tactical Game Plan
Bulls:
Watch for reaction at $124–$125 – potential scalp long with tight SL.
Confirmation on volume expansion and break of $128.38 for continuation.
Re-enter long after clean retest of weekly open from above.
Bears:
Short setup possible if weekly/monthly open is broken and retested as resistance.
First TP = $122, second TP = $120.65.
Longsetup

ALRS 1D Long Investment Aggressive CounterTrend TradeAggressive CounterTrend Trade
- short impulse
+ volumed T1
+ support level
+ biggest volume Sp
+ weak test
+ first bullish bar close entry
Calculated affordable stop limit
Take profit
1/3 - 1 to 2 R/R
1/3 - 1D T2 / 1M T2
1/3 - 1/2 of 1Y
Calculated affordable stop limit
Take profit
1/3 - 1 to 2 R/R
1/3 - 1D T2 / 1M T2
1/3 - 1/2 of 1Y
Monthly CounterTrend
"- short impulse
+ volumed TE / T1
+ support level
+ volumed Sp
+ test"
Yearly Trend
"+ long impulse
+ 1/2 correction
+ T2 level
+ support level
+ manipulation"

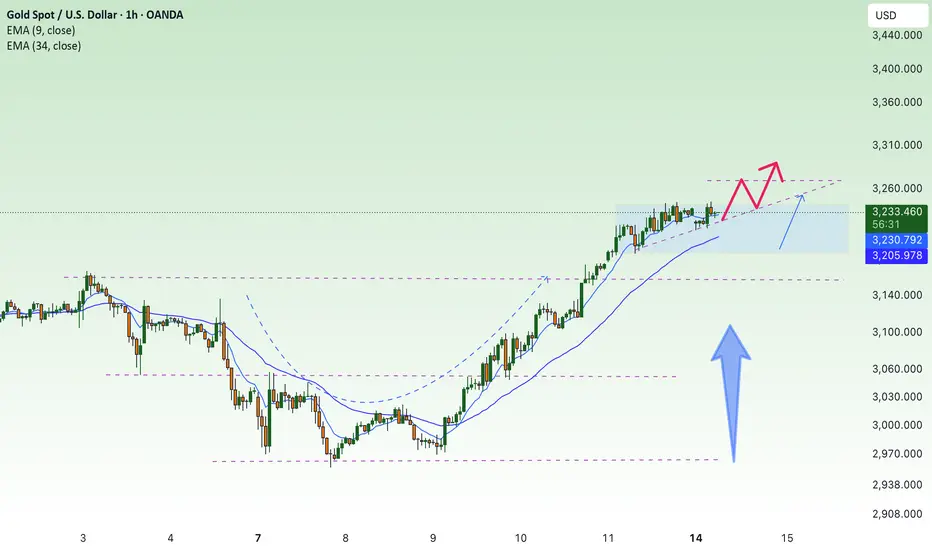
3270, waiting for new ATH gold price⭐️GOLDEN INFORMATION:
Gold prices eased during Monday's Asian session as risk sentiment improved, prompting a shift away from safe-haven assets. The upbeat market tone followed Wall Street’s strong rebound on Friday and encouraging developments in the ongoing US–China tariff dispute, temporarily reducing upward pressure on the yellow metal.
Last week, China retaliated against the US’s 145% tariff hike by imposing 125% duties on American goods but later signaled it would not respond to any additional escalations. Over the weekend, President Donald Trump floated the idea of targeting Chinese semiconductors and electronics with a separate 20% tariff—indicating a possible shift in strategy from across-the-board tariffs to more focused trade measures.
⭐️Personal comments NOVA:
Gold price, buying volume maintained, continuing the upward trend: 3260, 3270
⭐️SET UP GOLD PRICE:
🔥SELL GOLD zone : 3270- 3272 SL 3277
TP1: $3260
TP2: $3250
TP3: $3240
🔥BUY GOLD zone: $3168 - $3166 SL $3161
TP1: $3175
TP2: $3190
TP3: $3200
⭐️Technical analysis:
Based on technical indicators EMA 34, EMA89 and support resistance areas to set up a reasonable BUY order.
⭐️NOTE:
Note: Nova wishes traders to manage their capital well
- take the number of lots that match your capital
- Takeprofit equal to 4-6% of capital account
- Stoplose equal to 2-3% of capital account
The Spring of OM: Wyckoff Signals a Rebirth After the CrashMANTRA ( BYBIT:OMUSDT.P ) Technical Analysis: Post-Crash Recovery and Wyckoff Accumulation Insights
TradingView
On April 13, 2025, MANTRA (OM) experienced a significant price drop, declining approximately 88% within 24 hours. This sharp downturn was attributed to a combination of factors, including market-wide volatility and potential large-scale sell-offs. Despite this abrupt decline, technical indicators suggest that OM may be entering a Wyckoff Accumulation Phase, presenting potential investment opportunities.
Understanding the Recent Price Movement
Following the crash, OM's price stabilized around $0.70, with a 24-hour trading volume exceeding $2.3 billion. The Relative Strength Index (RSI) and Commodity Channel Index (CCI) indicators both entered oversold territories, indicating a potential for price reversal.
CoinMarketCap
CentralCharts
Wyckoff Accumulation Phase Analysis
The Wyckoff Method identifies specific phases in market cycles, with the Accumulation Phase characterized by large investors ("smart money") buying assets at lower prices. Key features of this phase include:
Selling Climax (SC): A sharp price decline with high volume, as seen in OM's recent drop.
TradingView
Automatic Rally (AR): A quick rebound following the SC, indicating initial buying interest.
Secondary Test (ST): Price revisits the SC level to test support, often with lower volume.
Spring: A false breakout below support levels to shake out weak holders, potentially observed in OM's price action.
Mudrex
Sign of Strength (SOS): A strong price increase with higher volume, signaling the end of accumulation.
Currently, OM's price behavior aligns with the early stages of this accumulation pattern.
Investment Considerations
For investors considering entry points:
Risk Tolerance: Given the recent volatility, only risk capital should be used.
Technical Confirmation: Await confirmation of the SOS phase before significant investment.
Volume Analysis: Monitor trading volumes for signs of increased institutional interest.
Understanding the Wyckoff Accumulation Phase can provide insights into potential market reversals.

EUR/NZDExpecting price to react off the levels that I marked, to continue higher, these levels I marked are aligned with my Fib levels.

M&Mi Observed these Levels based on Price Action and Demand & Supply which is my own Concept "PENDAM CONCEPTS"... Please don't take any trades based on this chart/post... Because this chart is for educational purpose only not for Buy or Sell Recommendation... Thank Q

LONG ON NATURAL GASNATGASUSD
Natural gas has finished its pullback to the downside within its overall uptrend.
Price has given us a choc (change of character) to the upside and has also pulled back to a strong demand area.
I expect price to rise majorly on Gas to the next supply level.
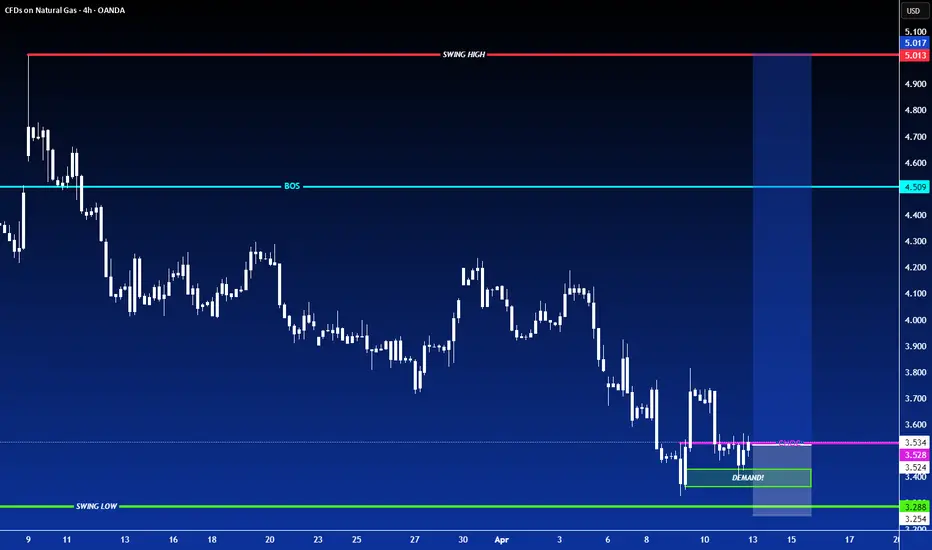
Wait for Weekly Closing..Weekly Closing above 165
would be a +ve sign.
Immediate Targets can be
around 176 - 178 & then 185 - 187.
Trade must be closed if it
breaks 152 as Next Support
will be around 133 - 134.

Hidden Bullish DivergenceMonthly Closing above
75000 would be a +ve sign.
Hidden Bullish Divergence on Daily TF
has also appeared.

$AAPL This is going to burst... $220 target.NASDAQ:AAPL : Expecting a move to $210 easy off the $200 zone then to the target of $220. Lots of testing in that area. I think $210 is a clear "gimme." Not even close to overbought, with the volatility this can ramp up. Technically look great to me. Push up to 200EMA/SMA located above $220 zone ($221 and $228).
wsl.

GBP/USD Long🟢 Bullish Play (High Probability)
Plan: Break-and-Retest Strategy
Entry: Wait for daily close above 1.3200, then set buy limit at 1.3060
SL: 1.2890
TP1: 1.3300
TP2: 1.3600
TP3: 1.4000 (macro breakout target)

QTUM May Surprise You All (3D Analysis)Qtum has formed a rectangle in weekly time period. Whenever it reachs the bottom, always turned back to gather upside liquidty till now.
The other interesting thing is, when Qtum first went upwards for liquidty, it took over 2 years to gather all remaining short liqudations. When it did again, it took less than a year. So the scale of time for gathering liquidty is squezing.
If Qtum can stay above the bottom of the rectangle, I believe there is a chance for %160 profit in long term. There is not even need for a leverage.
-%20 down here means that this coin is set for going hell and no way for recover.
But, there is %160 profit chance. The question is, are you willing to take that risk?
Cause I will.
Thanks for reading.

BTC 97K Long Target Inverse Head and ShouldersTHIS BLUE NECKLINE IS 100% THE LINE TO FOLLOW
Inverse Head And Shoulders
Active Long Target - 97,050
What To Expect?
Trump's tweets are highly volatility just like the markets so rather then trying to call the exact bottom use this for your bull / bear transition. I'm not saying when it will happen... but above the blue line bullish, below it flip bearish despite it would take a number in the 60Ks to invalidate this target.
Downside seems to be the orange support line in 73.8... but money is on 97K sooner than later and this chart staying valid.

LONG ON GBP/CHFGBP/CHF Has a Perfect Double bottom pattern at a major demand area.
Price has broken the neckline of the double top and is currently pulling back to sweep liquidity and balance out price at any FVG's (Fair Value Gaps)
Liquidity sits behind the 2 wicks on the double bottom, so price may sweep that BEFORE rising.
Must give you stop loss space behind the wicks to survive the trade.
I have a buy limit order setup to take advantage of the pullback which will place me in the trade at discount price.
From there im looking to catch 300 pips to the previous swing high.

SOL — Clean Liquidity Grab & FVG Flip. Mid-Term Setup in PlayClassic move on SOL — liquidity sweep, inverted the FVG, and pushed higher. Textbook stuff.
Not expecting an instant pump, this one looks more like a mid-term play… although, with SOL, you never know.
Stay sharp. And follow to catch the next ones early.
Entry: 109
TP: 123-148

growth - new ATH - gold hits 3246⭐️GOLDEN INFORMATION:
Trump announced Wednesday that tariffs would be temporarily reduced for dozens of countries, offering a short-term reprieve. However, he simultaneously hiked tariffs on Chinese imports to 125% with immediate effect, following Beijing’s retaliatory move to impose 84% duties on US goods. The escalating trade conflict between the world’s two largest economies has reignited concerns over global growth, prompting investors to seek refuge in safe-haven assets like Gold.
“Gold is reclaiming its safe-haven status and appears poised to chart fresh all-time highs,” said Nikos Tzabouras, Senior Market Analyst.
Meanwhile, scaled-back expectations for aggressive Federal Reserve rate cuts could lend support to the US Dollar, potentially limiting gains for the USD-priced metal. That said, traders still anticipate the Fed will begin easing in June, with markets pricing in a full percentage point of rate reductions by year-end.
⭐️Personal comments NOVA:
Gold price continues to increase greatly, the fomo market and attention are focused on the gold investment channel: safe, continue to find new ATH zones
⭐️SET UP GOLD PRICE:
🔥SELL GOLD zone : 3245- 3247 SL 3252
TP1: $3230
TP2: $3210
TP3: $3190
🔥BUY GOLD zone: $3168 - $3166 SL $3163 scalping
TP1: $3175
TP2: $3183
TP3: $3190
🔥BUY GOLD zone: $3134 - $3132 SL $3127
TP1: $3145
TP2: $3160
TP3: $3175
⭐️Technical analysis:
Based on technical indicators EMA 34, EMA89 and support resistance areas to set up a reasonable BUY order.
⭐️NOTE:
Note: Nova wishes traders to manage their capital well
- take the number of lots that match your capital
- Takeprofit equal to 4-6% of capital account
- Stoplose equal to 2-3% of capital account

CHFJPY LIVE TRADE EDUCTIONAL BREAKDOWN LONGThe Japanese yen is expected to strengthen by approximately 7% against the US dollar, according to Morgan Stanley.
This prediction comes as a response to potential weakening economic data and the increasing likelihood of a US recession due to recent reciprocal tariff announcements.
Morgan Stanley’s team, which includes Koichi Sugisaki and David Adams, suggests two long yen trades with revised targets.
First, they recommend shorting USD/JPY at 146.40 with a target of 135, down from the previous target of 145, and a stop at 151. The second recommendation is to short CHF/JPY at 171.30 with a target of 160 and a stop at 180.

LONG ON GBP/AUDGPB/AUD Has dropped to a nice demand level and has given a change of character on the lower timeframe.
I will be buying GBP/AUD expecting it to reach the nearest supply level for 400-600 pips.

NVIDIA Update 3 Rangebound with new Low for longsIn this video I bring to your attention what we could possibly expect if we lose the current level and if we do then where is the next crucial zone to look for Longs.
If you have read this then pls do Boost my work and any questions then leave them below

Trade the range until it breaks Nvidia updateThis video is a quick recap on the previous video after the levels I gave produced 30% move to the upside after patiently waiting for the move down to 90$.
So what now is the big question after the unprecedented move we had yesterday .
I outline the next best Short/Long setup and define why I think we stay inside of the range until Earnings Data .

WLD — Heavy Discount. Long-Term Opportunity on the TableWLD has pulled back over 80% from its previous high — a massive correction that now opens the door for long-term accumulation. The current range looks like a gift for patient players. Don’t sleep on setups like this — they don’t come often.
Follow for more high-conviction plays like this one.
Entry: 0,7-0,71
TP: 1,37-3,35

The quinquennial Bear Trap: Oil’s Next Leg DownIn this video I cover the potential for oil to trade down into the 55 $ range and what confluences we have at this price region .
Please support with a boost and I welcome any questions

BTC ANALYSIS📊 #BTC Analysis
✅There is a formation of Falling Wedge Pattern on 12 hr chart and currently trading around its major support zone🧐
Pattern signals potential bullish movement incoming after a breakout
👀Current Price: $78,150
🚀 Target Price: $84,900
⚡️What to do ?
👀Keep an eye on #BTC price action and volume. We can trade according to the chart and make some profits⚡️⚡️
#BTC #Cryptocurrency #TechnicalAnalysis #DYOR
