Fool trump BTC@Watch and follow the processBitcoin in the 15-minute time frame seems to have a tendency to rise in the short term
And we are in a range of fluctuation
Longsetup

ATOM: Double Bottom Confirmed – Gap Fill to $10 in Sight#ATOM nailed the perfect bounce from the $3.611 support, confirming a clean double bottom pattern. The structure looks strong, and the next major target is the $10 level for a potential gap fill.
Follow me to catch more plays like this in real time. 🚀
Entry: 4.2
TP: 10
SL: 3.3


Nasdaq Update after hitting 16.5Target This video is a recap for the short video I done at 21000 and the reaction zone at 16500.
Played out exactly as laid out in the original video although much faster than I had anticipated.
I cover the current PA and what could occur next .

LONG ON NZD/USDNZD/USD has been oversold since last week.
It has finally given a change of character (choc) on the lower timeframe witching to bullish.
it is currently in the pullback/retracement phase of the new change.
With the dollar in a overall downtrend and getting ready to fall, this correlation should cause the NZD/USD pair to rise.
I have brought NZD/USD looking to make 200-300 pips this week.

long AEX indexthe price came back above the support and there is a CME gap between 890.4 and 897 . as long as the price holds this level it is possible we see a little short term bullish momentum to full the cme gap
long entry 840.8
stoploss 829
take profit 895

LONG ON GBP/JPYGJ has Taken a dive since last week.
The Jpy Index is now over brought and should begin falling.
This will cause most of the XXX/JPY pairs to rise.
EJ, NJ, and GJ all look great for a buying opp.
GJ has a morning star on the 15min TF, I am waiting for price to pullback to the FVG or demand area on the 15min TF before entering long.
This is a sell limit order risking 65 pips to make over 300 pips.
See you at the top.

Elliott Wave Analysis on $SOLUSDT – ElliotWave count🟢 Current Wave Structure
The chart shows a complex corrective structure that fits well within the Elliott Wave principle:
We are currently in a larger ABC correction, with the green-labeled wave (C) likely approaching completion.
The most recent move down in green (C) may have marked the end of a broader corrective cycle.
The current movement looks like a short-term ABC correction in red – typical for a corrective bounce after a strong sell-off.
🟥 Short-Term Movement (Red Wave A-B-C)
Within the lower timeframe, we can see a corrective recovery forming a red A-B-C structure:
Wave A (red) has already completed,
Wave B (red) is currently forming (sideways or slightly lower),
Wave C (red) could result in a final push upwards towards the green descending trendline – targeting around 138–142 USDT – unfolding as an internal orange A-B-C.
🟩 Key Trendline (Green)
The green descending trendline has been respected multiple times and acts as strong technical resistance.
⚠️ Scenario: A rejection from this level is highly likely and would mark the end of the current relief rally – completing the larger green wave (B).
🟧 Short Entry Zone
The orange Fibonacci zone around 142 USDT marks an ideal short setup area.
This level is confluence of Fibonacci extensions and previous resistance.
⚪ What’s Next?
After the orange wave C finishes (completing green wave (B)), I expect an impulsive move to the downside – likely unfolding as a classic 1-2-3-4-5 wave within the green wave (C).
Target zones:
First zone: ~108 USDT (highlighted by green/yellow/red Fibonacci extension),
Final bear target: Possible deep wick below due to the high volatility and liquidity in that zone.
✅ Key Support Zone (Green / Yellow / Red)
Around 108 USDT, we find a strong confluence support – labeled as End of Bears.
This zone may act as a potential reversal point, possibly kicking off a new bullish cycle with long-term targets reaching 200+ USDT.

LTC Targets $70: A High-Probability Reversal SetupLitecoin (LTC) has just broken below the critical $80 low, signaling that bearish pressure is firmly in control. Currently trading at $79—just beneath the swing low at $80—LTC is also sitting below the monthly open at $82.98. With the bears flexing their dominance, traders are left wondering: Where does the price head next? What’s the target for the bears, and where can bulls find an opportunity to re-enter the market? Let’s dive into the charts, pinpoint the key levels, and craft a plan that could turn this downturn into a golden opportunity.
The Current Market Picture
LTC’s recent breach of $80 confirms the bearish momentum that’s been brewing since its peak at $147.06 on December 5, 2024. Litecoin enjoyed a stellar 122-day bullish run, soaring +195% from $49.80 to high at $147.06. Now, we’re on the 122nd day of a downtrend—a poetic symmetry that hints at a potential turning point. The question is: where will this descent find its floor, and how can we position ourselves for what’s next?
Support Zone: The $70 Fortress
To identify a robust support zone, we need confluence—multiple technical factors aligning to form a level that’s tough to crack. Here’s what the chart reveals:
Fibonacci Retracement: Using the Fib tool from the 2024 low at $49.80 to the high at $147.06, the 0.618 retracement at $86.95 has already been lost, turning our focus to the 0.786 level at $70.61. This deep retracement is a classic spot for reversals, making it a prime candidate for a support zone.
Yearly Level: At $70.14, this pivot is nearly identical to the 0.786 Fib level, adding significant weight to the area.
Volume Profile: The Point of Control (POC) from a 1.5-year trading range sits right around $70, just above the Fib level. This is the price with the highest traded volume over that period—a natural magnet for price action.
Yearly Order Block: Visualized as a green channel, this order block reinforces the $70 zone, suggesting past institutional buying interest or significant support.
Together, these factors create a $70 support zone that’s brimming with confluence. It’s not just a random level—it’s a fortress where bulls could mount a serious stand.
Long Trade Setup:
Entry Strategy: Use a Dollar-Cost Averaging (DCA) approach to build your position. Start with small buys around $75, laddering down to $70, and increase your position size as price nears the core of the support zone. Aim for an average entry of $73/72.
Stop Loss (SL): Set it below $68 to protect against a deeper breakdown while giving the trade room to breathe.
Take Profit (TP): First Target: $80 (the swing low and monthly open not far off). Main Target: $100 (a key psychological and resistance zone).
Risk-to-Reward (R:R): With an average entry at $73 and SL at $68, you’re risking $5 to gain $27 (to $100)—a stellar 5:1 R:R or better. This is a high-probability setup that rewards patience.
Execution Tip: Watch for bullish signals in the $70-$75 range—candlestick pattern, volume spikes, or RSI divergence. This isn’t about chasing; it’s about precision.
Resistance Zone: The $100 Battleground
If bulls reclaim control and push LTC higher, the $100 psychological level looms as a major resistance zone. Here’s why it’s a HOTSPOT:
Yearly Open: At $103.28, this level is close enough to $100 to bolster its significance.
Anchored VWAP: Drawn from the 2024 low at $49.80, the VWAP currently sits around $102.4, adding another layer of resistance.
Historical Context: The $100 mark has been a recurring battleground, with bulls and bears clashing repeatedly. It’s a price that carries weight.
A rally to $100 wouldn’t just be a recovery—it’d be a statement. A clean break above could hint at a broader trend reversal, but until then, it’s a ceiling to respect.
What’s Next? Bears vs. Bulls
For now, the bears are driving LTC lower, with the break below $80 opening the door to the $70 support zone. That’s their likely target—a level where selling pressure could exhaust itself. For bulls, $70 isn’t just a floor; it’s a launchpad. The DCA long setup offers a low-risk, high-reward entry.
Wrapping It Up
Litecoin’s drop from $147.06 to $79 has been brutal, but the chart is screaming opportunity. The $70 zone—backed by Fibonacci, levels, volume, and order blocks—is where bulls could turn the tide. With a DCA entry at around $73/72, SL below $68, and a main target at $100, you’ve got a trade setup that could deliver a 5:1 payoff. Meanwhile, $100 stands as the bears’ next big test if momentum shifts.
So, will you wait for LTC to hit $70 and strike, or watch the action unfold? The levels are clear—now it’s your move. Use this analysis to sharpen your edge, and let’s see where Litecoin takes us in the days, weeks, and months ahead.
________________________________________
If you found this helpful, leave a like and comment below! Got requests for the next technical analysis? Let me know, I’m here to break down the charts you want to see.
Happy trading =)

IP ANALYSIS🔮 #IP Analysis 💰💰
🌟🚀 As we can see that #IP is trading in a symmetrical triangle and there was a breakdown of the pattern. Last time there was a bullish move from the same support level. We can expect again a bullish momentum from its major support level🚀🚀
🔖 Current Price: $4.190
⏳ Target Price: $5.500
#IP #Cryptocurrency #DYOR

NFP BIG BULL SETUP BREAKOUT ALERT!🔥 Market Update for Traders! 🔥
Right now, the market is showing BEARISH momentum, and it's looking like we're heading for a dip. We could see the market fall and sweep the area around 3052 👀. Once that happens, expect a *huge* bounce back as the market could be getting ready to **shoot to the moon 🚀🌕!
🛑 KEY BUY LEVEL: 3130 - This is where you want to be ready to go long! 📈
🎯 First Target: Once we hit 3130, eyes on the ATH (All-Time High) for the retest! 🙌 And from there, we're eyeing a target at 3200 🚀🔥.
💥 NFP News Incoming! 💥
After Trump's speech, gold could *fall* around 1000 pips ⬇️, but **NFP could trigger a huge pump 📊💥. Stay sharp and trade with caution.
💡 Risk Management is KEY! Always follow your plan, set stop losses, and protect your capital. Don't let emotions drive your decisions! 📉🔑
Trade smart, stay sharp, and let's get those gains! 💸💥
#BearishMomentum #BullishReversal #RiskManagement #GoldPrice #NFPAlert

#ATOMUSDT shows a strong bullish impulse 📈 LONG BYBIT:ATOMUSDT.P from $5.100
🛡 Stop loss $4.948
🕒 4H Timeframe
⚡️ Overview:
➡️ The POC (Point of Control) BYBIT:ATOMUSDT.P is at $4.628, which marks the high-volume area from which the current bullish move started.
➡️ A breakout above the $5.00 resistance occurred with strong volume, confirming bullish strength.
➡️ The upward move is supported by large green candles and rising trading activity.
➡️ The $5.100 entry level aligns with previous consolidations and acts as a flipped support.
🎯 TP Targets:
💎 TP 1: $5.188
💎 TP 2: $5.280
💎 TP 3: $5.350
📢 Watch for price holding above $5.00 — it’s key for continued upside.
📢 If price drops below $4.948, the long setup becomes invalid.
BYBIT:ATOMUSDT.P shows a strong bullish impulse — confirmation via volume and breakout supports the continuation scenario.

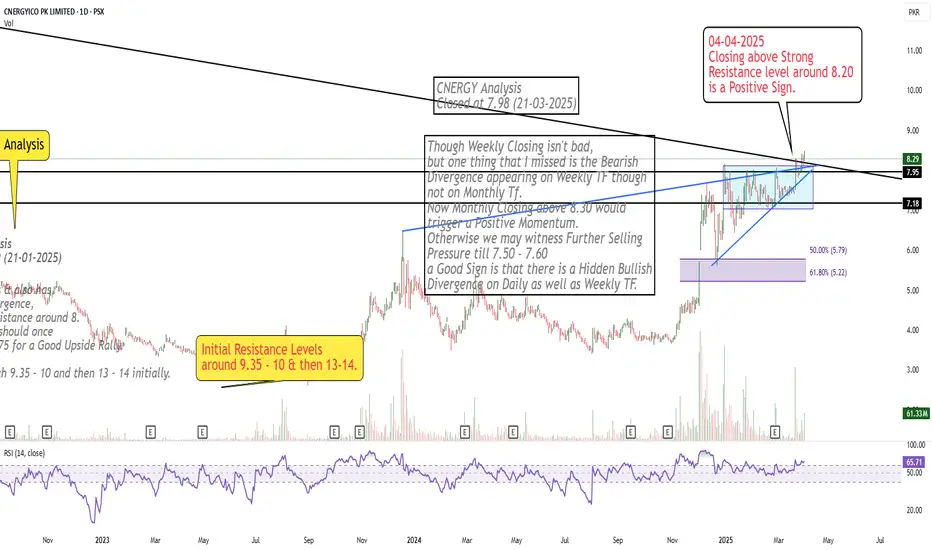
Crossed Important Resistance Area
Closing above Strong
Resistance level around 8.20
is a Positive Sign.
#ETH #ETHUSDT #ETHEREUM #LONG #SWING #Analysis #Setup #Eddy#ETH #ETHUSDT #ETHEREUM #LONG #SWING #Analysis #Setup #Eddy
ETHUSDT.P Swing Long Analysis & Setup
Important area of the upper time frame for swing are identified and named.
This setup is based on a combination of different styles, including the volume style with the ict style.
Based on your strategy and style, get the necessary confirmations for this Swing Setup to enter the trade.
Don't forget risk and capital management.
The entry point, take profit point, and stop loss point are indicated on the chart along with their amounts.
The responsibility for the transaction is yours and I have no responsibility for not observing your risk and capital management.
🗒 Note: The price can go much higher than the second target, and there is a possibility of a 500% pump on this currency. By observing risk and capital management, obtaining the necessary approvals, and saving profits in the targets, you can keep it for the pump.
⚠️ Warning : The stop loss is dramatic and large. Place the stop loss based on your strategy and after getting entry and confirmation on the entry point behind the last shadow that will be created. (( This is just my opinion and is not meant to be 100% correct, so be careful with your capital. ))
Spot Investing : ((long 'buy' position)) :
🟢 Entry 1 : 1800
🟢 Entry 2 : 1500
First entry point calculations :
⚪️ SL : 1370 ((23.89%))
⚫️ TP1 : 4500 ((150%))
⚫️ TP2 : 5000 ((177.78%))
⚫️ TP3 : 8000 ((344.44%))
⚫️ TP4 : 10000 ((455.56%))
‼️ Futures Trading Suggested Leverages : 3-5-7
The World Let it be Remembered...
Dr. #Eddy Sunshine
4/4/2025
Be successful and profitable.
Do you remember my first Ethereum swing long signal?
My first swing long signal was provided on Ethereum, which was spot pumped by more than 100% and was profitable :

ATOM ANALYSIS📊 #ATOM Analysis
✅There is a formation of Falling Wedge Pattern on daily chart with a good breakout and currently retests from the major resistance zone and again trading around its major resistance zone 🧐
Pattern signals potential bullish movement incoming after a successful breakout of resistance zone
👀Current Price: $4.800
🚀 Target Price: $6.300
⚡️What to do ?
👀Keep an eye on #ATOM price action and volume. We can trade according to the chart and make some profits⚡️⚡️
#ATOM #Cryptocurrency #TechnicalAnalysis #DYOR

#SAND #SANDUSDT #SANDBOX #LONG #SWING #AMD #Eddy#SAND #SANDUSDT #SANDBOX #LONG #SWING #AMD #Eddy
SANDUSDT.P SWING Long AMD Setup
Important areas of the upper time frame for scalping are identified and named.
This setup is based on a combination of different styles, including the volume style with the ict style. (( AMD SETUP ))
Based on your strategy and style, get the necessary confirmations for this Swing Setup to enter the trade.
Don't forget risk and capital management.
The entry point, take profit point, and stop loss point are indicated on the chart along with their amounts.
The responsibility for the transaction is yours and I have no responsibility for not observing your risk and capital management.
By scratching the price and time bar, you can see the big picture and targets.
Note: The price can go much higher than the second target, and there is a possibility of a 50%-100% pump on this currency. By observing risk and capital management, obtaining the necessary approvals, and saving profits in the targets, you can keep it for the pump.
Be successful and profitable.

#X #XUSDT #XEMPIRE #LONG #Setup #Eddy#X #XUSDT #XEMPIRE #LONG #Setup #Eddy
XUSDT.P Long Setup
Important areas of the upper time frame for scalping are identified and named.
This setup is based on a combination of different styles, including the volume style with the ict style.
Based on your strategy and style, get the necessary confirmations for this setup to enter the trade.
Don't forget risk and capital management.
The entry point, take profit point, and stop loss point are indicated on the chart along with their amounts.
The responsibility for the transaction is yours and I have no responsibility for not observing your risk and capital management.
Note : The price can go much higher than the second target, and there is a possibility of a 100% pump on this currency. By observing risk and capital management, obtaining the necessary approvals, and saving profits in the targets, you can keep it for the pump.
Warning : The stop loss is dramatic and large. Place the stop loss based on your strategy and after getting entry and confirmation on the entry point behind the last shadow that will be created.
Be successful and profitable.
I hope you enjoyed the previous analysis and signal of this currency.
Previous analysis and signal Of X Empire :

CFX ANALYSIS📊 #CFX Analysis
✅There is a formation of Falling Wedge Pattern on daily chart with a good breakout and currently retests from the major resistance zone🧐
Pattern signals potential bullish movement incoming after a successful retest
👀Current Price: $0.0775
🚀 Target Price: $0.1210
⚡️What to do ?
👀Keep an eye on #CFX price action and volume. We can trade according to the chart and make some profits⚡️⚡️
#CFX #Cryptocurrency #TechnicalAnalysis #DYOR

Apollo Tubes, 1WChannel Pattern is Looking Very Good , Take little Time to Breakout from the Pattern
Enter only after the Breakout of Upper Trendline
Stop line Should be Minimal so your profit should be High , Follow 1:2 Risk, Reward minimal in Every Trade .
Follow For More Swing Ideas Like This

PhoenixLTD, 1W & 1DLooking very Good Channel Pattern and it is ready to Breakout
Enter into it after the upper trendline Breakout
it is Combination of Both Triangle and Channel Patterns , it can Break any time
so look an eye on it or make an Alert above trendline broke
Follow For More Swing Trade Ideas Like This

FluoroChem ,1WFirst Triangle Pattern is Breaked Out and Next Channel Pattern is Formed at Retest for Triangle Pattern .
Now Channel Pattern is Ready to breakout , SO look an Eye on it when Breaking
Only Enter after the breakout of upper Trendline of Channel Pattern .
Be Careful when entering at breakout
Follow for more Swing Trade Ideas Like This

Reversal in Godrej Properties.On monthly Time frame, Godrej Properties is taking support at golden zone of Fibonacci retracement. Weekly closing above 2203 will the entry and closing below 1950 will be the SL. Expecting new high in coming months.
Please note: This a Monthly setup so it will be long term Investment. Will keep on adding quantity and weekly basis.

#AVAX/USDT Short-term riseHello traders!
There is an upward wave and the price is declining in a correction . I expect a similar upward wave. We have an POI Zone and I expect the wave to start from there.
