New ATH , GOLD is comming 3173⭐️GOLDEN INFORMATION:
US President Donald Trump dismissed expectations that the new tariffs would target only a select group of nations with the largest trade imbalances, declaring on Sunday that reciprocal tariffs would apply universally. This announcement, coupled with the existing 25% duties on steel, aluminum, and auto imports, has intensified fears of an escalating global trade war.
Additionally, investors are increasingly convinced that the economic slowdown triggered by these tariffs will pressure the Federal Reserve (Fed) to resume rate cuts, despite persistent inflation concerns. As a result, Gold has surged to a fresh record high, marking its strongest quarterly performance since 1986.
⭐️Personal comments NOVA:
The backdrop of everything from technical to political and economic is supporting the increase in gold prices in the first quarter of 2025. Gold prices have the highest growth in history.
⭐️SET UP GOLD PRICE:
🔥 ATH : SELL 3162 - 3164 SL 3169
TP: 3155 - 3140 - 3127
🔥BUY GOLD zone: $3093 - $3091 SL $3086
TP1: $3100
TP2: $3110
TP3: $3120
⭐️Technical analysis:
Based on technical indicators EMA 34, EMA89 and support resistance areas to set up a reasonable BUY order.
⭐️NOTE:
Note: Nova wishes traders to manage their capital well
- take the number of lots that match your capital
- Takeprofit equal to 4-6% of capital account
- Stoplose equal to 2-3% of capital account
Longsetup

ADA - Next Trade Setups to WatchADA’s been stuck in this sideways grind for a while, and the volume’s basically ghosting us. So, where’s it at, and where’s the next move? Let’s dig in.
ADA’s sitting at $0.6615 right now, trading below the yearly open at $0.8451 and the range’s sweet spot, the POC, at $0.7325. That tells me it’s leaning a bit bearish, but not exactly screaming panic, more like it’s just chilling in this 57 day range. It tapped the monthly open at $0.6328 recently, bounced a little, but without volume showing up, it’s like nobody’s ready to commit yet.
Key Levels
Resistance Zones (Short Opportunities)
1.) Range POC: $0.7325, this is the most traded price within the 57 day range, acting as a magnet for price. A rejection here could signal a short setup.
2.) Yearly Open ($0.8451): a psychological and structural level that could cap upside if momentum remains weak. Trading below this level keeps the yearly bias bearish. A break above with volume would flip the narrative.
Support Zones (Long Opportunities)
1.) Monthly Open: $0.6328, already saw a little bounce here with that swing failure move, perfect setup for a long trade if you were quick on the draw.
2.) Yearly Open 2024 + 21 Monthly EMA: $0.594 - $0.5928, strong confluence with the prior yearly open and a key moving average. This zone aligns closely with the swing low at $0.5801, forming a robust support cluster between $0.5801 - $0.594.
3.) 21 SMA: $0.53, a deeper support level if the above zone fails. This would indicate a more significant breakdown, but it’s a potential accumulation area for longer-term traders.
Market Structure Analysis
Bearish Bias Above Swing Low: Trading below the yearly open and POC suggests sellers are in control unless price reclaims $0.7325 with conviction.
Range-Bound Behaviour: The 57 day range indicates consolidation. Volume is the missing catalyst, watch for a spike to confirm direction.
Swing Low as Key Pivot: The $0.5801 level is critical. A hold here maintains the range; a break below shifts focus to $0.53 and signals capitulation.
High-Probability Trade Setups
Long Setups
1.) Long Setup #1 at Swing Low ($0.5801 - $0.594 Zone)
Entry Trigger: Look for a swing failure pattern (SFP) where price dips below $0.5801, reclaims it, and shows rejection of lower prices (e.g., a bullish candle with a wick below).
Stop Loss (SL): Place just below the swing low
Take Profit (TP): $0.70 (near-term resistance)
Stretch Target: $0.8451 (yearly open), though this requires stronger momentum.
Confirmation: Higher-than-average volume on the reclaim + bullish price action (e.g., engulfing candle).
2.) Long Setup #2: $0.4735 Sniper Entry
Entry Trigger: If ADA takes a bigger tumble, $0.4735 is your sniper’s nest, think of it as catching the knife with style. Could be a wick that snaps back.
This is a deeper, high-reward play. Price has to fall by a lot from here, but if it hits, the R:R is amazing, and it’s below most traders radar. Patience is the name of the game.
Short Setup
At POC ($0.7325) or Yearly Open ($0.8451)
Strategic Outlook
Current Stance: If not in a trade, the $0.5801 level is the highest-probability long setup due to confluence and R:R. The SFP at $0.6328 today was a missed opportunity, but a deeper pullback sets up an even better entry.
Breakout Watch: A decisive close above $0.7325 (POC) with volume shifts focus to $0.8451. Conversely, a break below $0.5801 targets $0.53.
Patience is Key: Low volume suggests waiting for a clear catalyst (e.g., news, BTC move) to drive ADA out of this range.
Wrapping It Up
The $0.5801 swing low long with SL below and TP at $0.7 - $0.8451 is the standout trade right now—low risk, high reward, and backed by confluence. Monitor volume closely, as it’s the linchpin for any breakout or reversal. If ADA holds this support and volume picks up, the retest of $0.8451 becomes plausible.
If you found this helpful, please leave a like and a comment. Happy trading!

EOS ANALYSIS📊 #EOS Analysis
✅There is a formation of Falling Wedge Pattern on daily chart with a good breakout and currently retesting the major resistance zone🧐
Pattern signals potential bullish movement incoming after a breakout of major resistance zone
👀Current Price: $0.6235
🚀 Target Price: $0.9200
⚡️What to do ?
👀Keep an eye on #EOS price action and volume. We can trade according to the chart and make some profits⚡️⚡️
#EOS #Cryptocurrency #TechnicalAnalysis #DYOR

DOT - Please mark this moment!Dear My Friends,
It must be admitted that the current market is very bad, as most investors' assets are being significantly divided. Information is chaotic, and many accounts are being liquidated. What else is there? FUD and more FUD are enveloping the market, causing fear, panic selling, and exits. And I, too, have been hit while holding DOT or LTC. However, my confidence remains unshaken when I look at the charts. News may deceive me, but the charts won’t. In the long-term trend, DOT’s price is still extremely good. It’s simply a breakout and retest. The price is dropping, but the RSI is still rising. RSI divergence is still present. What we need to do now is patiently wait. Bitcoin has broken its all-time high, but ETH and large-cap coins haven’t yet. Keep that in mind.
Best Regards,

ETH looks like a giant bull flagWell the subject about says it all, I am hopeful, og hodler no gains no pain!

ATH 3127, continues to aim for big growth⭐️GOLDEN INFORMATION:
Gold's record-breaking rally continues unchecked as buyers push prices past the $3,100 milestone for the first time ever. Mounting concerns over a potential global trade war and rising stagflation risks in the United States (US) have further fueled demand for the safe-haven metal, reinforcing its status as a store of value.
A recent report from The Wall Street Journal (WSJ) suggests that US President Donald Trump may introduce even higher and broader reciprocal tariffs on April 2, known as “Liberation Day.” This prospect has sent fresh waves of risk aversion rippling through global markets, amplifying investor uncertainty.
⭐️Personal comments NOVA:
Tariff pressure, fears of trade war outbreak in April. Gold price is growing continuously, expected to reach 3127
⭐️SET UP GOLD PRICE:
🔥SELL GOLD zone: $3126 - $3128 SL $3133
TP1: $3120
TP2: $3110
TP3: $3100
🔥BUY GOLD zone: $3092 - $3094 SL $3087
TP1: $3098
TP2: $3103
TP3: $3110
⭐️Technical analysis:
Based on technical indicators EMA 34, EMA89 and support resistance areas to set up a reasonable BUY order.
⭐️NOTE:
Note: Nova wishes traders to manage their capital well
- take the number of lots that match your capital
- Takeprofit equal to 4-6% of capital account
- Stoplose equal to 2-3% of capital account

LONG ON ETHEREUM (ETH/USD)Ethereum has given a change of character (choc) to the upside on the 4 hour timeframe...
followed by a nice sweep of engineered liquidity!
Its currently respecting a key demand are and I believe it will now rise for 300-500 points this week.
I am buying Eth to the next level of resistance.

ZEC ANALYSIS📊 #ZEC Analysis
✅There is a formation of Falling Wedge Pattern on daily chart with a good breakout and currently retesting the major resistance zone🧐
Pattern signals potential bullish movement incoming after a breakout of major resistance zone
👀Current Price: $37.80
🚀 Target Price: $50.00
⚡️What to do ?
👀Keep an eye on #ZEC price action and volume. We can trade according to the chart and make some profits⚡️⚡️
#ZEC #Cryptocurrency #TechnicalAnalysis #DYOR

$AAL super oversoldRSI at very low levels and has long term support at the $10 range. Anticipating a move back to current resistance levels $12-$13. Look at RSI 1D, 1W, 1M. Not the worst company and traveling isn’t going anywhere and Southwest ( NYSE:LUV ) is charging for bags.
NFA
WSL

#X #XUSDT #XEMPIRE #LONG #Scalp #Scalping #Eddy#X #XUSDT #XEMPIRE #LONG #Scalp #Scalping #Eddy
XUSDT.P Scalping Long Setup
Important areas of the upper time frame for scalping are identified and named.
This setup is based on a combination of different styles, including the volume style with the ict style. (( AMD SETUP ))
Based on your strategy and style, get the necessary confirmations for this scalping setup to enter the trade.
Don't forget risk and capital management.
The entry point, take profit point, and stop loss point are indicated on the chart along with their amounts.
The responsibility for the transaction is yours and I have no responsibility for not observing your risk and capital management.
Note: The price can go much higher than the second target, and there is a possibility of a 70% pump on this currency. By observing risk and capital management, obtaining the necessary approvals, and saving profits in the targets, you can keep it for the pump.
Be successful and profitable.

Reciprocal tariffs - gold continues to rise✍️ NOVA hello everyone, Let's comment on gold price next week from 03/31/2025 - 04/04/2025
🔥 World situation:
Gold prices surged on Friday, reaching a new all-time high of $3,086 as uncertainty surrounding US trade policy and an uptick in the Federal Reserve's (Fed) preferred inflation gauge fueled demand for the safe-haven metal. Following this, market sentiment suggests growing confidence that the Fed will implement two rate cuts in 2025. At the time of writing, XAU/USD trades at $3,079, up 0.79%.
Investor sentiment remains cautious as markets brace for April 2, dubbed “Liberation Day” by US President Donald Trump, who has signed an executive order imposing a 25% tariff on all imported automobiles. This move has sparked global reactions, particularly from Canada and the European Union (EU), both of which are preparing retaliatory measures in response to the tariffs.
🔥 Identify:
Gold price moves up, early April will continue to explode to NEW Ath
🔥 Technically:
Based on the resistance and support areas of the gold price according to the H4 frame, NOVA identifies the important key areas as follows:
Resistance: $3100, $3132, $3150
Support : $3002, $2957
🔥 NOTE:
Note: Nova wishes traders to manage their capital well
- take the number of lots that match your capital
- Takeprofit equal to 4-6% of capital account
- Stoplose equal to 2-3% of capital account
- The winner is the one who sticks with the market the longest

TIA: 40% Crash in Sight – What's Next?TIA recently lost its strong $4 support, and that level is now acting as resistance. For the past two months, the price hasn’t been able to climb back above $4, leaving us with one burning question: Is more blood on the table?
Broken Support: TIA has given up its $4 support, which now serves as resistance.
Looking at November 2024: The low from November 2024 was around $1.9. Revisiting that level could provide us with a high-probability long trade.
Trade Setup Opportunity
Entry Point: Set an alarm for the $1.9 low. A successful bounce here would signal a potential long trade opportunity.
Target & Reward: With the goal of targeting the $3 level, this trade could offer a risk-to-reward ratio of at least 5:1.
Implication: If the $1.9 level is revisited and holds, we could be looking at a scenario with roughly 40% more downside in the current trend—but also a setup for a low-risk long if the bounce holds.

SUI Swing: The Art of Patience in TradingSUI has been playing nice with the technicals lately, giving us some really neat swing trade opportunities. Remember that short trade we talked about—from $3 down to around $2? Well, here's why that setup was a winner.
After that initial short trade, SUI bounced off $2 and then traded in a tight range between $2.5 and $2.2 for about two weeks. Then it broke higher to test the monthly open at $2.83—and it hit that level right on the dot. That’s where all the magic happens.
Why This Short Trade Worked
Fibonacci Confluence: When you draw a Fibonacci from the high at $3 to the low at $1.9626, the 0.786 level comes in at about $2.778. This is right near the monthly open, and we know that price tends to reverse between the 0.618 and 0.786 zones.
Trading Range POC: The $2.8 area was our previous point of control, so it adds extra weight as a resistance level.
Anchored VWAP: The VWAP from the high at $3.8999 sits just above the monthly open at around $2.855, giving us another nod that this level is important.
Fib Speed Resistance Fan: Even the speed resistance fan at the 0.618 level lines up with the $2.8 zone.
All these factors lined up to form a solid resistance area. That’s why short entries between $2.778 and $2.855 made sense.
Trade Setup Recap
Short Trade:
Entry Zone: $2.778 to $2.855
Target: The bullish order block at about $2.4745, which also lines up with the 0.618 fib retracement from the low at $2.2358 and the high at $2.8309
Risk-to-Reward: This setup gave us a risk-to-reward of 4:1 or even better, depending on where you set your stop-loss.
There’s also a possible long trade at the bullish order block, but that one’s only for when you see the confirmation.
Wrapping It Up
The takeaway? Confluence is your best friend. Waiting for that high-probability setup can really pay off. Let the trade come to you, don’t force it, and stay calm and focused.
Thanks for reading this SUI analysis. If you liked it, please leave a like and drop a comment. Happy trading!

CHILLGUY: The Perfect Range Play Before Lift-Off!CHILLGUY has been in solid sideways accumulation, with a few deviations along the way. Now, it’s sitting near the bottom of the range, setting up for a strong move up. A sharp breakout is on the table, targeting a gap fill.
Entry: Now
TP: 0.03-0.04
SL: 0.022
Stay tuned and follow me so you don’t miss the next big setups! 🚀

SUI ANALYSIS🚀#SUI Analysis :
🔮As we can see in the chart of #SUI that there is a formation of "Falling Wedge Pattern". In a daily timeframe #SUI broke out the pattern. Expecting a bullish move in few days if #SUI retest the levels
⚡️What to do ?
👀Keep an eye on #SUI price action. We can trade according to the chart and make some profits⚡️⚡️
#SUI #Cryptocurrency #TechnicalAnalysis #DYOR

breakout - gold price rebounds 3045⭐️GOLDEN INFORMATION:
Gold prices remained stagnant late in the North American session, constrained by a rebound in the US Dollar Index (DXY), which initially dipped to 104.18 before recovering. The turnaround came after the White House confirmed that President Donald Trump would unveil new automobile tariffs around 22:00 GMT. As of writing, XAU/USD is trading at $3,019, showing little change.
Despite reports from The Wall Street Journal suggesting that Trump may introduce limited tariff measures, including on automobiles, bullion traders struggled to find momentum. Meanwhile, the DXY, which measures the Greenback against a basket of six major currencies, climbed 0.32% to 104.55, further weighing on gold’s appeal.
⭐️Personal comments NOVA:
Gold price recovers, breakout of H1 frame. With the latest 25% car tax policy, gold price reacts strongly and increases again.
⭐️SET UP GOLD PRICE:
🔥SELL GOLD zone: $3045 - $3047 SL $3052
TP1: $3038
TP2: $3030
TP3: $3020
🔥BUY GOLD zone: $3023 - $3021 SL $3016
TP1: $3030
TP2: $3040
TP3: $3057
⭐️Technical analysis:
Based on technical indicators EMA 34, EMA89 and support resistance areas to set up a reasonable BUY order.
⭐️NOTE:
Note: Nova wishes traders to manage their capital well
- take the number of lots that match your capital
- Takeprofit equal to 4-6% of capital account
- Stoplose equal to 2-3% of capital account

XRP ANALYSIS🔮#XRP Analysis 💰💰
#XRP is trading in a symmetrical triangle in a weekly time frame and if it breakouts with high volume then we can see a bullish momentum in #XRP. Before that we will see little bit bearish movement towards its support zone and that a bullish movement.
🔖 Current Price: $2.3520
⏳ Target Price: $2.9740
⁉️ What to do?
- We can trade according to the chart and make some profits in #XRP. Keep your eyes on the chart, observe trading volume and stay accustom to market moves.💲💲
🏷Remember, the crypto market is dynamic in nature and changes rapidly, so always use stop loss and take proper knowledge before investments.
#XRP #Cryptocurrency #Pump #DYOR

Nvidia Update New levels to the downside Longs and shortsIn this video I discuss the market structure shift in Nvidia and highlight new levels to be aware of to the downside . Potential here for longs and shorts .
Tools used Fibs, Gann Square , Speed Fan , Order blocks .
Please Like and comment if you have any questions . Have a great Day and thanks for your support

GERMAN 40 Long Positive Surprises?EU data going to be released:
M3 Money Supply y/y
Private Loans y/y
EU Economic Forecasts
Never the less,technically German 40 is providing very interesting oppurtunity
where the bulls are accumulatiing their positions
Chart:
green arrows: More buys/add to more buying positions
1 profit target,but 7 different entries for aggressive and conservative traders
red-line: Below the red line the strong bearish pressure is starting, where the bulls get bigtroubles.In this case,if the price holds just for a short time below the red zone,but returns back above,it will be a clear sign that the bulls are taking back control.
If not,the bullish trade setup is not valid anymore.
Also it is possible that winning trades should be liquidated immediately,once news catalysts/events cause the market to turn down(market trend change).
In this case I recommand to close immediately the positions, and waiting for new entry signal.
It can also happen, that we have to close the positions, and the price coming back to our origin entry. We can use the stup to enter again,once confirmation aligned with signals(Respecting/Rejecting OF THE RED LINE).

Still Good to Go..as Mentioned in Yesterday's Video,
it Hit 430-435 range and closed around 420.
Stoploss for Now 398
It may hit 450 and then 460

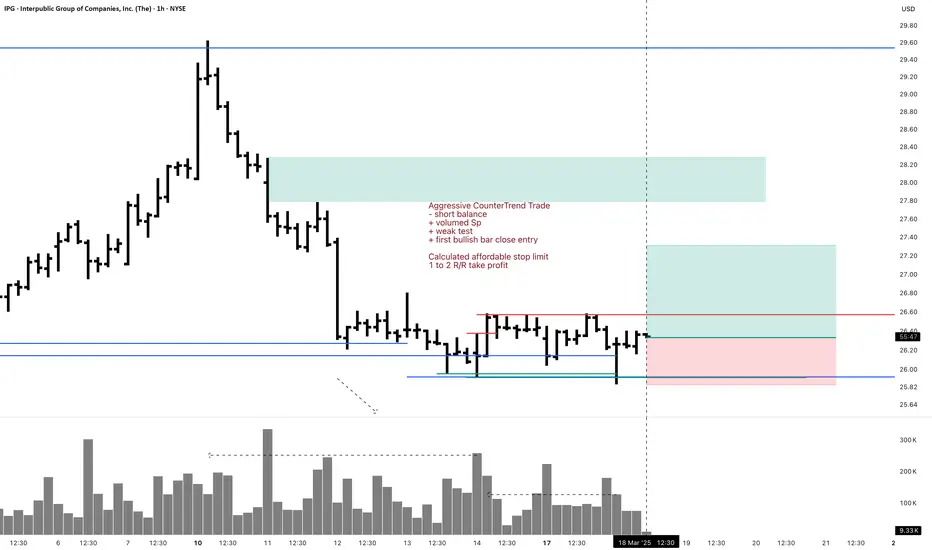
IPG 1H Swing Long Aggressive CounterTrend TradeAggressive CounterTrend Trade
- short balance
+ volumed Sp
+ weak test
+ first bullish bar close entry
Calculated affordable stop limit
1 to 2 R/R take profit
Day CounterTrend
"- short balance
+ support level
+ volumed expanding ICE level"
Month CounterTrend
"- short impulse
+ support level
+ T1 level
- before 1/2 correction"
Year Trend
"+ long impulse
- correction"
Tesla Update 2 Plan the trade and be PreparedUpdate on the Monthly chart with revised level which is worth noting on your charts and being prepared for . Enjoy the update and thanks for watching

Tesla Update 3 Whats Next after Target Long Hit Quick recap of the previous level I gave for tesla which is now + 35% off of that level . In this video I use fibs and channels + gann box .
Show your support for continued analysis with a boost and feel free to ask any questions
