GER40 LONG SETUP IDEA - BUY THE DIP📈 LONG SETUP - BUY THE DIP (Swing Trade)
Entry: 22,350 - 22,400
Take Profit (TP): 23,500 (first target), 24,000 (extended target)
Stop Loss (SL): 22,150
Reasoning:
Strong historical support at 22,300 - 22,400.
Bullish divergence on MACD and RSI on 1H and 4H charts.
High timeframe trend remains bullish; expecting continuation after the retracement.
📈 Market Overview & Bias
Daily & 4H Charts:
The GER40 has been in a strong bullish trend over the past few months but is currently experiencing a retracement.
The 21 EMA and 8 EMA are converging, signaling indecision or potential trend exhaustion.
200 EMA remains below price, suggesting long-term uptrend remains intact.
The 100 EMA is acting as resistance on lower timeframes.
Key support zones: 22,300 and 21,900.
Key resistance zones: 23,000 and 23,500.
Lower Timeframes (1H & 15M)
The price is consolidating between the 22,400 - 22,700 range.
A potential reversal pattern is forming on the 15M chart with bullish divergence on RSI and MACD.
ATR values suggest increased volatility, so tight stop losses are necessary.
Key Economic & Geopolitical Considerations
ECB Rate Decision (March 21, 2025)
Hawkish stance → Might push GER40 lower.
Dovish stance → GER40 could break resistance.
US CPI & NFP Reports
Inflation data affecting European stock sentiment.
Strong USD could pressure GER40 downward.
Geopolitical Risks
German & EU economic policies affecting investor sentiment.
Tensions between China/EU and EU/USA on trade policies could add volatility.
mportant: this is not personalized financial advice. It’s an illustration of how one might combine risk management principles with the support/resistance zones in play.
Final Note & Disclaimer
All market scenarios carry probabilities, not certainties. Technical signals are best combined with macro fundamentals (e.g., interest rates, USD behavior, geopolitical risks) to form a well‐rounded market view. This consolidated analysis serves an educational purpose—always do additional research or consult a licensed professional before making trading or investment decisions.
Longsetup

USDCHF: The battle of 0.9000 - Sell or wait?Hello everyone, Ben here!
USDCHF previously broke its uptrend as the fundamental landscape shifted, and the dollar entered a correction phase. Clearly, sellers are in control, as illustrated on the chart.
Fundamentally, the situation is becoming more complex due to the tariff war initiated by Trump, with European countries responding in kind. Economic risks are rising. Additionally, with rumors of rate cuts from Trump and Powell, the dollar has entered a correction phase, which has had a positive impact on the forex market.
From a technical perspective, the 0.9000 level plays a crucial role, as it represents a strong zone. If sellers manage to keep the price below this level, within the selling zone, it will confirm further downside movement.
I also cannot rule out the possibility of a retest of the previous breakout range before a deeper decline. Emphasizing the 0.9000 level!
Best regards,
Bentradegold!

EURUSD: Attempting to change the trendHello dear friends, Ben here!
Currently, EURUSD is attempting to capture recovery due to the dollar's adjustment. The price is forming a reaction from the resistance channel consolidation before breaking out and growing further.
Accordingly, after breaking through the trend channel resistance level, the price has moved into a consolidation phase around the range of 1.053 to 1.021. Within this, the price is testing the resistance level of 1.038. From this, we can argue that the market is still working to change its trend and become stronger against the dollar's adjustment.
Resistance levels: 1.038, 1.053
Support levels: 1.033, 1.021
Emphasizing the resistance level of 1.038, with confirmation of consolidation above this level, there will be nothing stopping EURUSD from further growth.
Best regards, Bentradegold!

GOLD → Consolidating around 2921 — Poised for a Breakout!OANDA:XAUUSD continues its upward trajectory amid rising economic risks and a weakening dollar. The metal is currently testing resistance at 2921 and appears poised for further gains.
The U.S. dollar has broken its bullish structure, driven by comments from the U.S. Treasury regarding potential rate cuts. This intervention has significantly influenced market sentiment. Theoretically, gold is unlikely to decline further due to trade war risks and expectations of a dovish Fed policy. Additionally, weak ADP employment data and PMI figures could provide further bullish momentum for gold.
Key levels to watch are 2913 and 2903, which have already been tested and tapped into liquidity zones. Now, all eyes are on 2927—if this level holds, gold could retreat back to the 2913-2903 support zone. However, a breakout above 2927 could fuel further upside, with the next targets at 2942-2956.
Share your thoughts, opinions, and questions—let's discuss what’s unfolding in the market!

RUNE/USDTHere i can see the best spot opportunity in RUNEUSDT as it is now on it's most important support level as it respect it's Support level it may show some good rally.

DOT/USDT Fly timeAs i can see in weekly chart that if DOT respect it's Support level, it may fly. As shown in chart.

AUDUSD BUY NOW 120 PipsLooking at the monthly charts, it seems like we've hit a key level where the price has bounced back up nicely. This indicates a shift in the overall trend, making it look like there's potential for some upward movement. Since the DXY (which tracks the strength of the dollar) is weakening, we might be able to ride this wave up and take advantage of the positive momentum in the market. It’s all about following the trend and going with the flow!
Risk to reward is very lovely
Follow me for your support
Thank You

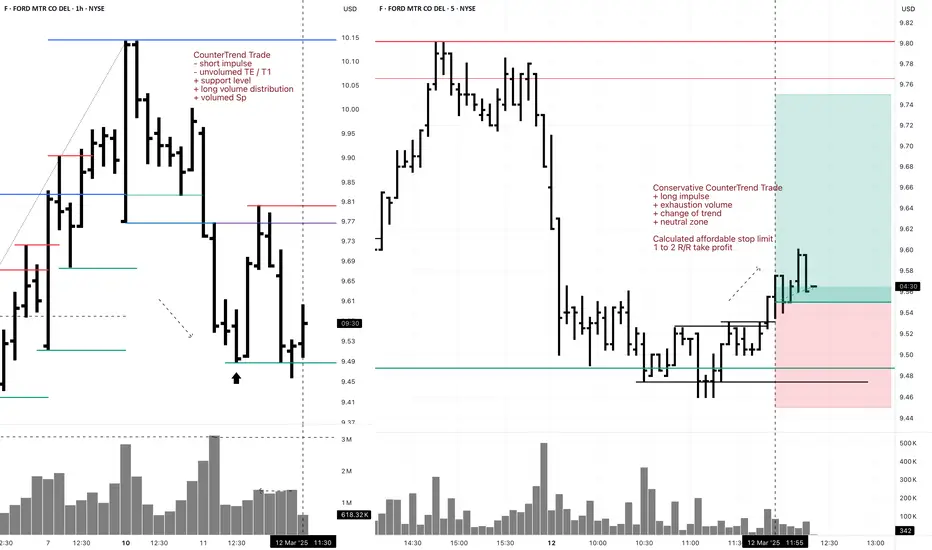
F 5M DayTrade Long Conservative CounterTrend TradeConservative CounterTrend Trade
+ long impulse
+ exhaustion volume
+ change of trend
+ neutral zone
Calculated affordable stop limit
1 to 2 R/R take profit
1H CounterTrend
"- short impulse
- unvolumed TE / T1
+ support level
+ long volume distribution
+ volumed Sp"
1D CounterTrend
"+ long impulse
- biggest volume on correction
- below SOS test level
- below support level
+ 1/2 correction"
1M Trend
"- short impulse
+ 1/2 correction
- unvolumed T1
+ support level
+ reverse volume approach
+ volumed manipulation"
1Y Trend
"+ long impulse
+ volumed T2 level
+ volumed 2Sp+
+ weak test"
F 5M Daytrade Conservative CounterTrend TradeConservative CounterTrend Trade
+ long impulse
+ T1 level
+ support level
+ 1/2 correction
+ volumed 2Sp-
Calculated affordable stop limit
1 to 2 R/R take profit
1H Countertrend
"- short impulse
- unvolumed TE / T1
+ support level
+ long volume distribution
+ volumed Sp
+ test"
1D Trend
"+ long impulse
- biggest volume on correction
- below SOS test level
- below support level
+ 1/2 correction"
1M CounterTrend
"- short impulse
+ 1/2 correction
- unvolumed T1
+ support level
+ reverse volume approach
+ volumed manipulation"
1Y Trend
"+ long impulse
+ volumed T2 level
+ volumed 2Sp+
+ weak test"

PPI, gold price opportunity to create new ATH above 2956⭐️Smart investment, Strong finance
⭐️GOLDEN INFORMATION:
Core CPI, excluding volatile food and energy prices, eased from 3.3% in January to 3.1% year-over-year, signaling ongoing disinflation in the U.S. economy.
Meanwhile, the Atlanta Fed’s GDPNow model projects a -2.4% contraction for Q1 2025, marking the first negative reading since the COVID-19 pandemic.
Money market traders have adjusted their expectations for Federal Reserve easing in 2025, pricing in 71 basis points of rate cuts—down from 77 bps the previous day, according to Prime Market Terminal data.
⭐️Personal comments NOVA:
Gold has accumulated, continues to grow and heads towards a new ATH: 2976
⭐️SET UP GOLD PRICE:
🔥SELL GOLD zone: $2954 - $2956 SL $2959 scalping
TP1: $2950
TP2: $2945
TP3: $2940
🔥SELL GOLD zone: $2975 - $2977 SL $2982
TP1: $2968
TP2: $2960
TP3: $2950
🔥BUY GOLD zone: $2920 - $2918 SL $2913
TP1: $2930
TP2: $2940
TP3: $2950
⭐️Technical analysis:
Based on technical indicators EMA 34, EMA89 and support resistance areas to set up a reasonable BUY order.
⭐️NOTE:
Note: Nova wishes traders to manage their capital well
- take the number of lots that match your capital
- Takeprofit equal to 4-6% of capital account
- Stoplose equal to 2-3% of capital account

PEAQ down 87% – Is it Time to Buy the Dip?PEAQ has been in a brutal downtrend, dropping 87% within 92 days and printing 9 straight weekly red candles, with the 10th currently red as it trades below the weekly open. Now, price is attempting to stabilise around the key $0.10 level, hinting at a potential high-probability long trade setup.
Key Levels to Watch:
Support: $0.10 (Price has been trying to hold this level for two days.)
Resistance: $0.11 (A reclaim of this level increases the probability of a move higher.)
Major Resistance: $0.1260 – $0.1280 (Weekly open + bearish order block.)
Technical Confluences Supporting the Trade:
The Fib retracement from $0.1337 to $0.0989 shows that the 0.786 Fib level ($0.1263) aligns with the bearish order block from the previous trading range.
The weekly open at $0.128 strengthens the take-profit zone, making it a logical exit point.
Price has failed to break below $0.10, signaling a possible accumulation phase.
Long Trade Setup
Entry: Around $0.10
Stop Loss: Below $0.0989 (Tight SL for minimal risk)
Take Profit Target: $0.1260 (Right before key resistance)
Risk-to-Reward (R:R): 17:1 🚀 (Risking only 1.5% to potentially gain 25%)
Additional Play:
If price reclaims $0.11 with strong volume, look for order flow confirmation to add to the position. The move towards $0.12+ could be quick, as there's little resistance in between.
This setup offers a strong risk-reward ratio, making it an attractive trade with minimal downside and high upside potential. Watch for bullish momentum above $0.11, as that could confirm a stronger push to the weekly open at $0.128.

#RUNEUSDT is showing signs of growth📈 Long BYBIT:RUNEUSDT.P from $1.161
🛡 Stop loss $1.140
🕒 1H Timeframe
⚡️ Overview:
➡️ The main POC (Point of Control) is at 1.08, indicating the area with the highest trading volume.
➡️ The 1.154 level acts as a local support, as the price previously bounced from this zone.
➡️ The volume and market profile highlight areas of high trader activity, especially in the 1.100 – 1.161 range.
🎯 TP Targets:
💎 TP 1: $1.174
💎 TP 2: $1.185
💎 TP 3: $1.195
📢 Monitor key levels before entering the trade!
📢 If 1.140 is broken downward, the trade may be invalidated.
📢 If the price holds above 1.161 and continues rising, the bullish momentum remains intact.
BYBIT:RUNEUSDT.P is showing signs of growth — expecting further upside movement!

#XLMUSDT is showing signs of growth📈 Long BYBIT:XLMUSDT.P from $0.26325
🛡 Stop loss $0.25955
🕒 1H Timeframe
⚡️ Overview:
➡️ The main POC (Point of Control) is at 0.25511, indicating the area with the highest trading volume.
➡️ The 0.25955 level acts as a local support, as the price previously bounced from this zone.
➡️ The volume and market profile highlight areas of high trader activity, especially in the 0.24984 – 0.26325 range.
➡️ The chart shows a forming bullish structure, confirming the potential for further upward movement.
🎯 TP Targets:
💎 TP 1: $0.26630
💎 TP 2: $0.26930
💎 TP 3: $0.27240
📢 Monitor key levels before entering the trade!
📢 If 0.25955 is broken downward, the trade may be invalidated.
📢 If the price holds above 0.26325 and continues rising, the bullish momentum remains intact.
BYBIT:XLMUSDT.P is showing signs of growth—expecting further upside movement!

ABCD Pattern appearingImportant fib level tested.
ABCD pattern appearing but not
yet confirmed.
Should not break 15 on Closing basis.

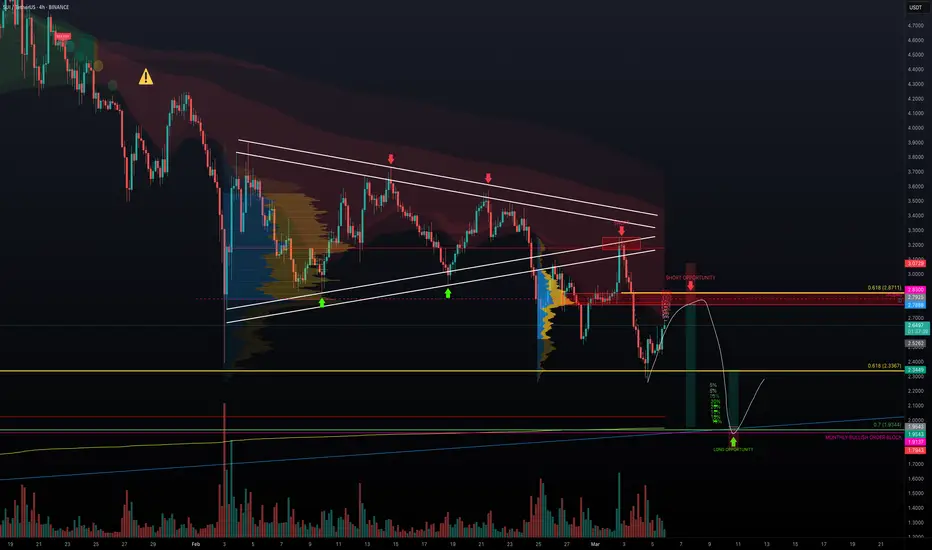
SUI - Short or Long? The Ultimate SUI Trade BlueprintHere’s an update to the analysis I did one month ago on February 10. Since then, SUI has continued to show its bearish tendencies—making lower highs and lower lows. After that dramatic 30% drop from a golden pocket short opportunity, the price started inching up on low volume. This weak rally suggests that while buyers are testing the ceiling, the overall trend remains down. That sets the stage for two possible plays: a short trade if the price reaches the resistance zone, and a long trade if it bounces off a strong support level.
1. Identification of Support and Resistance Zones
Resistance Zone (for the Short Trade):
Daily Resistance: ~2.7888
Point of Control (POC): Around 2.8035
Monthly Open: 2.83
0.618 Fibonacci Retracement: 2.8711
All these levels combine to create a robust resistance area where sellers are likely to step in.
Support Zone (for the Long Trade):
$2 Psychological Level: A key round number that attracts attention.
0.7 Fibonacci Retracement: Derived from the swing low of $0.4625 to the high of $5.3687, this places an important level at 1.9344 (just below $2).
Monthly Bullish Order Block: At 1.9137, indicating buying interest.
Fib Speed Fan (0.786): Points to support near the $2 mark.
POC: 2.0225
Anchored VWAP: Calculated from the deep low at $0.362, which again aligns around $2.
These multiple layers of confluence make the $2 area a strong support zone and an attractive entry point for a long trade.
2. Short Trade Setup
The Plan:
Building a short position gradually using a laddering strategy. With a $15,000 allocation from a $100,000 account, scale in at different levels to keep risk in check.
Scaling In (Entry Levels):
Entry # Entry Price % of Position Amount Invested ($)
1 2.6808 5% $750
2 2.7070 5% $750
3 2.7314 10% $1,500
4 2.7552 10% $1,500
5 2.7755 10% $1,500
6 2.7990 15% $2,250
7 2.8242 20% $3,000
8 2.8485 25% $3,750
Total: Avg. ~2.7924 $15,000
Stop Loss: Set at $3.07, limiting the risk to about $1,506 (roughly 10% of the trade allocation or 1.51% of the account).
Scaling Out (Exit Levels):
Exit Cover Price % of Position Amount Paid to Cover ($)
1 2.7925 5% $750.02
2 2.1715 5% $583.23
3 2.1365 10% $1,147.66
4 2.0981 20% $2,254.07
5 2.0630 20% $2,216.36
6 2.0257 10% $1,088.14
7 1.9930 15% $1,605.87
8 1.9625 15% $1,581.29
Outcome:
Total: Avg. ~2.09 $11,226.65
Net Profit: $15,000 (initial proceeds) – $11,226.65 (cost to cover) = $3,773.35
Profit % on Trade: +25.16%
Risk-to-Reward Ratio (R:R): Approximately 2.51
This laddering approach helps to secure profits at various levels while managing the risk effectively.
3. Long Trade Setup
The $2 support zone is a magnet, backed by multiple confluences. When SUI tests this area and shows signs of a rebound, it sets up a great opportunity to go long.
Key Support Details:
$2 Psychological Level: A well-watched price point.
0.7 Fibonacci Retracement: Places a key level at 1.9344 from the low ($0.4625) to the high ($5.3687).
Monthly Bullish Order Block: At 1.9137, adding to the support.
Fib Speed Fan (0.786): Confirms support near $2.
POC & Anchored VWAP: Both clustering around $2 (POC at 2.0225 and VWAP from a low of $0.362).
Trade Details:
Entry: Buy at $2.00
Target: Sell at $2.337 for an approximate 20%+ gain
Stop Loss: Set just below $1.80 to protect against further downside
Risk-to-Reward Ratio: About 2.44 or better
Wrapping It Up
In this dual-setup strategy, we're well-prepared for different market outcomes:
Short Trade: If SUI rallies into the tightly clustered resistance zone, scale into a short with defined entries, exits, and a stop loss that caps our risk at about 1.51% of the account. Exit ladder aims for an average cover price of around $2.09, netting a neat profit of approximately $3,773 (or +25.16% on the trade).
Long Trade: Conversely, if SUI finds strong footing at the confluence-rich $2 support zone, we can flip to a long position. Entering at $2.00, with a target of $2.337 and a stop loss below $1.80, gives an attractive risk-to-reward ratio of roughly 2.44.
This approach lets us capitalise on both sides of the market. Keep an eye on volume and price action. Happy trading! P.S. If you have any coin requests, feel free to share them in the comments. I will be selecting one or two for the next TA.
SUI’s Wild Ride – Finding the Next Long Trade SetupSUI had an incredible 2024, skyrocketing +1060% in just 154 days. The price peaked at the psychological $5 mark, where multiple rejections signaled a momentum shift. By the end of January 2025, the trend turned bearish, leading to a sharp correction.
Trend Shift & Momentum Analysis
I've been working on a new trend identifier indicator that helps spot trends, allowing traders to identify swing trade opportunities and manage their positions effectively. This indicator clearly highlighted the momentum shift, confirming the bearish turn and the sharp price drop that followed.
Key Support Zones & Confluences
Now that the bearish trend is in play, the focus is on identifying a solid long opportunity:
Point of Control (POC) from Previous Trading Range (~$2) – A major psychological level that many traders are watching
Trend-Based Fibonacci Extension (1:1) at $2.0373 – Adding confluence to this critical support area
Fib Speed Fan (0.75 Level) – Aligns with the $2 region, reinforcing support
Anchored VWAP (~$1.885) – From the 2023 lows, acting as an additional support zone
What’s Next for SUI?
The market is in search of a strong support level where bulls can regain control. Let’s see if we find support at the $3 mark. The $2 zone stands out as a prime area for a potential long entry, given the multiple technical confluences. If price reaches this level, we’ll be watching closely for confirmation of a bullish reversal.
Final Thoughts
SUI has had an extraordinary run, but corrections are natural in strong trends. The key now is to see where price stabilises and if the bulls can make a strong comeback. Time will tell how this plays out, but for now, $2 is a level to keep an eye on for a potential long setup.
BTW: I've just launched a FREE TradingView indicator – Multi Timeframe 8x MA Support & Resistance Zones. It helps visualise key support and resistance levels across different timeframes. Check it out and let me know your thoughts!

GBP/USD 15-Minute Chart Analysis & Trade SetupGBP/USD 15-Minute Chart Analysis & Trade Setup
📊 Trade Setup Idea
🟢 Bullish Scenario (Long Entry)
Entry: Above 1.29050 (if price sustains & closes above)
Target 1: 1.29400
Target 2: 1.29800 (if strong breakout)
Stop Loss: Below 1.28600 (tight SL for risk control)
✅ Confirmation: Look for a retest of 1.29050 as support before entry
**Key Observations:**
1. **Price Movement:** GBP/USD is currently trading around **1.28937**, with recent bullish momentum.
2. **Moving Averages:**
- The price has crossed above the short-term moving averages (red & blue), indicating potential short-term bullish sentiment.
- The black moving average (likely a longer-term MA) may act as dynamic resistance/support.
3. **Volume Surge:** A notable increase in volume suggests strong participation from buyers.
4. **Potential Resistance:** Around **1.29050 - 1.29100** based on previous highs.
5. **Support Levels:** **1.28800 - 1.28650** may act as support zones if price retraces.
### **Trading Insights:**
- A **break above 1.29100** could trigger further upside momentum.
- If **price fails to sustain above 1.2890**, a pullback towards support zones may occur.
- Consider **risk management** before entering trades.

Bullish Continuation Pattern (Bullish Flag)Bullish Continuation Pattern, Bullish Flag
🔹 Bullish Flag – The price had a strong upward move, followed by a slight consolidation. If it breaks above resistance, it could continue the uptrend.
📊 Key Levels to Watch:
Target 1.57000
Stop Loss 1.55300
Support: Around 1.555
Resistance: Around 1.561 - 1.565
If price breaks above resistance with volume, it could indicate a strong bullish move! 🚀
⚠️ Risk Management: Always use 1-2% risk per trade to protect capital.
📌 Trade Wisely & Stick to Plan! 🚀

[LONG] STX - STACKS on support and ready for a bounceSTX is another beaten up coin that this year alone lost more than 60% of it's already beaten up marketcap. From the peak on April of 2024 to January of this year STX was already down 50%. Bulls got completely obliterated, but not everything is lost for STACKS: Sitting at $0.75 is now testing (and holding) for second time the previous 2023 resistance, now turned support. A bounce here doesn't immediately mean the end of the fall, but we can catch a good counter-trend move to retest the distribution zone on the $1.44 to $2.00 range
1st Entry: $0.75 (previous resistance, now support)
2nd Entry: $0.65 (most traded zone)
move SL to Break even if price breaks the previous high at $1.00
1st TP: $1.34
2nd TP: around $1.80 or look for signs of weakness in lower timeframes at this area

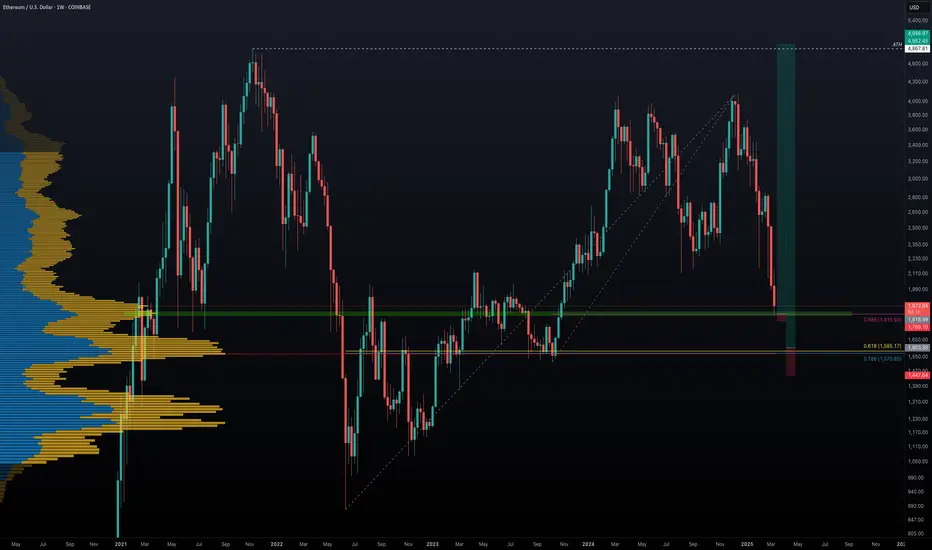
Ethereum's Potential Bottom: Could $5000 Be Next?Ethereum has experienced a significant 56% drop over the last 84 days. Has ETH found its bottom, or is more downside ahead? Let's break it down.
🔹 Fibonacci Retracement from October Low (2023) to December High (2024)
Starting with the Fibonacci retracement from the low of $1520.85 on 12th October 2023 to the high of $4109 on 16th December 2024, ETH recently hit the 0.886 Fib retracement at $1815.9 and saw a bounce. This area aligns with the Point of Control (POC) from previous price action, a potential signal that this could be a major support zone.
However, the real question is whether this is the final bottom, or if ETH will retest lower levels.
🔹 Further Fibonacci Retracement Analysis
Next, we take a larger Fibonacci retracement, from the low of $879.8 on 18th June 2022 to the high of $4109. The 0.786 Fib retracement at $1570.85 appears to be a critical support zone, as it also coincides with the POC in the volume profile of the entire market structure. This indicates that the $1570-$1600 region is a significant area of interest for buyers to step in.
🔹 Log Scale Fibonacci Confluence
To further strengthen this analysis, applying the same Fibonacci retracement on a log scale shows the 0.618 Fib retracement at $1585.17, very close to the POC and 0.786 Fib level, reinforcing this region as a major support zone.
🔹 High-Probability Long Setup
If ETH revisits the $1570-$1600 zone, this forms an ideal high-probability long setup with excellent risk/reward potential. A potential R:R ratio of more than 20:1 could materialise if this setup plays out and price targets $5000 as a take-profit level. The stop loss placement will determine the exact risk-to-reward, but the reward could be massive if this level holds.
💬 What are your thoughts? Will Ethereum find its bottom around these key levels? Excited to see how this develops! 🚀
Solana: Time to Buy or More Pain Ahead?Solana has been in freefall since peaking at nearly $300 on January 19, 2025, dropping a staggering 61% to $115,47 in just 50 days, currently trading at around $119. A support zone for potential reversals.
The big question now: Is this the time to go long, or is more selling pressure ahead? Let’s break it down.
Key Support & Resistance Levels
Lost Key Level at $120
Solana lost the key support at $120, turning it into a resistance zone. For bulls to regain control, SOL must reclaim this level with confirmation and increased volume.
Next Key Lows to Watch
Below the current price, the next key liquidity zones are at $110 and $105, where buyers may step in.
Major Support Zone – $104 to $96
If selling continues, we have a strong support zone between $104.14 and $96.96, backed by multiple confluences:
Anchored VWAP Support: Taking the anchored VWAP from the 2023 lows at $8, we find it currently aligning near $100, a key psychological level.
Monthly Order Block: On the monthly timeframe, an order block sits right at $100 mark, reinforcing this level as strong support.
2024 Yearly Open: The yearly open from 2024 is at $101.72, adding another layer of confluence.
0.666 Fibonacci Retracement: Measuring from $8 to the all-time high of $295.83, the 0.666 Fib retracement is at $104.14, further strengthening this support zone.
Liquidity Pools: There's a lot of liquidity around the $100 area
Fib Speed Fan Support: The 0.7 Fib speed fan also aligns perfectly with this support zone.
Conclusion: The $104–$97 range becomes a high-probability long entry zone with minimal risk.
Long Trade Setup
Entry Zone: $118 – $97
Stop Loss: Below $95
Take Profit Target: $135
Average Entry: $105 (DCA)
Risk-to-Reward (R:R): a solid 3:1 or better
Strategy & Execution
With SOL already down over 60%, scaling into a long position makes sense. Here's how to do it the right way:
1️⃣ DCA Strategy – Instead of going all in, scale in gradually within the $118–$97 range for a better average entry.
2️⃣ Volume & Price Action – Watch for a spike in volume and bullish price action before adding to the position.
3️⃣ Psychological Level Play – There are likely many buy orders around $100, meaning a bounce before hitting lower support is possible.
Stay tuned for updates as this trade unfolds! 🚀

XLM Crashes Below Key Support – Is a Reversal Near?XLM has broken its previous low, raising the question: where is the next major support zone? To determine this, we will focus on fibonacci, moving averages, and order blocks to find a high-probability bounce area for a potential long position.
🔍 Fibonacci Retracement – Locating the Next Support Level
Using the Fibonacci retracement tool from the low at $0.0757 to the high at $0.6374:
0.618 Fib Retracement → $0.2903 (Already Lost) ❌ Current Price: $0.248
Next Major Fib Level – 0.786 Retracement at $0.1959
Since the 0.786 Fib level is a key retracement point, we need further confluence factors to confirm its strength as a potential support zone.
🔗 Confluence Factors Strengthening the Support Zone ($0.1959 – $0.17179)
1:1 Trend-Based Fibonacci Extension
High: $0.6374
A: $0.3179
B: $0.515
1:1 extension aligns at $0.1902 → Strong confirmation near 0.786 Fib retracement ✅
Wave A-B Fibonacci Extension
1.618 Fib extension from wave A to B is at $0.1875 → Aligns with the 1:1 trend-based extension ✅
Daily Support Level at $0.1962
Sits almost exactly at the 0.786 retracement ($0.1959) ✅
21 EMA & 21 SMA for Moving Average Support
21 EMA at $0.20338
21 SMA at $0.17187
Order Block Between $0.2208 – $0.1964
Demand area aligns with the major support zone ✅
Key Takeaway:
A high-probability support zone is now identified between $0.1959 and $0.17179, with multiple confluences suggesting a strong potential bounce.
Trade Plan – Scaling Into a Long Position
Given the strong confluence at the support zone, the best approach is scaling into a long trade.
DCA Entry Strategy:
Start scaling in at $0.22, as an order block exists between $0.2208 – $0.1964
Main focus remains on the support zone ($0.1959 – $0.17179)
Stop Loss:
Below the 21 SMA ($0.17187) for invalidation
Take Profit Levels for Optimal R:R:
First TP at $0.25 → Resistance area
Next TP at $0.30 → Strong psychological & resistance level
R:R Approximation:
2:1 R:R for first TP ($0.25)
3:1+ R:R if targeting $0.30
High-Probability Support Zone Identified
✔ Multiple confluences confirm a strong support zone at $0.1959 – $0.17179
✔ Scaling into a long from $0.22 to $0.17179, with stop loss below the 21 SMA ($0.17187)
✔ Take profit levels set at $0.25 & $0.30 for a solid R:R trade
Alternative bullish scenario: A reclaim of lost key low at $2526 with rising volume could signal a long opportunity, only on confirmation.
💬 Will XLM bounce from this key support? Let me know your thoughts in the comments! 🚀🔥

PFE 1H Long Swing Conservative Trend TradeConservative Trend Trade
+ long impulse
+ SOS level
+ support level
+ 1/2 correction
+ biggest volumed Sp
Calculated affordable stop limit
1 to 2 R/R take profit before 1/2 of the Month
Expandable to 1/2 of the Year
Daily Trend:
"+ long impulse
+ neutral zone
+ close to 1/2 correction"
Monthly CounterTrend
"- short balance
+ unvolumed expanding ICE
+ volumed 2Sp-
+ weak test"
Yearly Trend
"+ long impulse
+ 1/2 correction
+ exhaustion volume?"
Will add more if corrects to 1/2 of 1H wave.
