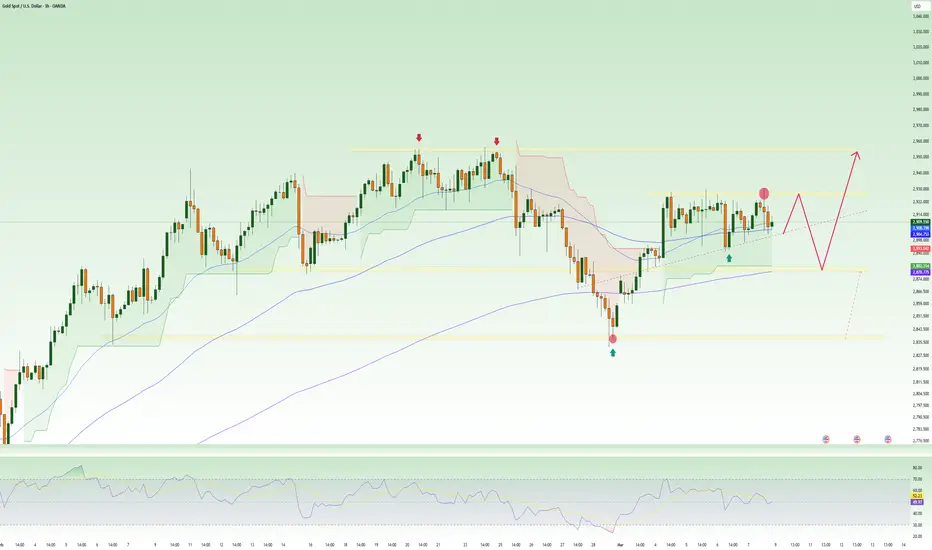
GOLD → The calm before the NFP torm! What’s next?OANDA:XAUUSD is currently trading within the 2926 - 2894 range, signaling a pause after its recent strong uptrend. If a false support breakdown occurs, the market could quickly revert, especially amid signs of a recovering USD.
However, a weaker dollar and expectations of a Federal Reserve policy shift toward easing continue to support gold demand. Despite the temporary suspension of Trump’s tariff measures, the precious metal remains in focus as a safe-haven asset.
Traders are now closely watching the NFP report, which could dictate the dollar’s future trajectory and influence Fed policy decisions. In the short term, attention will be on Initial Jobless Claims data, which may provide early signals about the U.S. labor market.
Technical Outlook
-Gold remains within the 2926 - 2894 range, potentially testing liquidity near the 2894 support zone.
-An unfilled fair value gap (FVG) below 2894 could lead to a brief dip before a rebound.
-Given the bullish long-term trend in gold and the ongoing dollar weakness, the probability of a price recovery remains high.
In this scenario, gold may fake out a breakdown, grab liquidity near support, and then resume its broader uptrend.
Best regards, Bentradegold!
Longsetup

BTC long opportunity upcoming -- short term bearishsee chart with more detailed text explaining trade idea

$ELF on the shelf; reversal?Hello, with some selling pressure from the triple digits into a demand zone that dates back a year and change if not 2 plus, we can potentially see a reversal on $ELF. Looks like a finish of the Elliot Wave pattern as well. Targets are labeled. Will be on watch. GL.
WSL

JUP in Danger: Are We in for a Crash?JUP has been on a four-day downtrend, and it's starting to show its bearish side. The token has lost its yearly open, which was a major support level. Let’s break down the key support and resistance to see what the chart is telling us.
Support & Resistance
Resistance:
Yearly Open & Monthly Level: JUP has dropped below the yearly open at $0.8169 and the monthly level at $0.7427
Support:
Long-Term Range & Liquidity: JUP has been trading within a range for over 300 days, with a significant amount of liquidity below the low at $0.6328 from 5 July 2024.
POC: The volume profile shows the POC sitting at around $0.5, marking an attractive entry point for a long position.
Fibonacci Confluence: The 0.786 Fibonacci retracement level falls just below the key low at $0.431 (a level last seen on 12 February 2024), offering a great long trade setup.
Long Trade Opportunity:
Alarms are set, let's see if JUP drops to these key support levels. If it does, we could have a solid long setup on our hands.

BTC ANALYSIS🔮 #BTC Analysis
💲💲 #BTC is trading in a Symmetrical Triangle Pattern. If the price of #BTC breaks and sustain the higher price then will see a pump. Also there is an instant strong support zone. We may see a retest towards the support zone first and then a reversal📈
⁉️ What to do?
- We have marked crucial levels in the chart . We can trade according to the chart and make some profits. 🚀
#BTC #Cryptocurrency #Support #Resistance #DYOR

Put your seatbelts on for $SMCI to $55-65 range- NASDAQ:SMCI traders be ready to pounce and ride the momentum for this name.
- Buyers are getting aggressive and price can easily be pushed to 55 ( 200 sma ) to 65 range.
- $55 seems to be a resistance, if price moves above that then we could be seeing some parabolic moves in this name.
- Please Notes that, NASDAQ:SMCI has to submit SEC filing before Feb 25, 2025 and CEO re-assured that they would be filing the documents to SEC in time.
- So, next 2 weeks, buckle up your seatbelts for volatility!

Continue to motivate the price, world trade tensions✍️ NOVA hello everyone, Let's comment on gold price next week from 03/10/2025 - 03/14/2025
🔥 World situation:
Kugler emphasized that uncertainty poses challenges across the economy. Earlier, she noted that monetary policy is likely to remain steady for some time and dismissed wages as a driver of inflation.
Meanwhile, Fed Chair Jerome Powell reaffirmed that the central bank is in no rush to cut interest rates. He acknowledged that achieving the 2% inflation target will be a gradual process and cautioned against overreacting to short-term data fluctuations, stating that the Fed is well-positioned on monetary policy.
When asked about tariffs, Powell noted that their potential inflationary impact remains uncertain.
🔥 Identify:
The accumulation of over 2900 is a good signal, trade tensions will be comprehensive in the world that is when gold price grows over 3000
🔥 Technically:
Based on the resistance and support areas of the gold price according to the H4 frame, NOVA identifies the important key areas as follows:
Resistance: $2928, $2955
Support : $2880, $2837
🔥 NOTE:
Note: Nova wishes traders to manage their capital well
- take the number of lots that match your capital
- Takeprofit equal to 4-6% of capital account
- Stoplose equal to 2-3% of capital account
- The winner is the one who sticks with the market the longest
Pratham EPC - High-Risk Opportunity (Not a Recommendation)Pratham EPC appears to be in a potential buy zone between 150-175, with indications of a possible bounce from current levels. However, it is critical to note that this opportunity carries a VERY HIGH RISK profile. Market conditions, volatility, and other external factors could significantly impact the stock's performance.
Disclaimer: This is not a stock recommendation. Investors are strongly advised to consult their financial advisor or conduct thorough due diligence before considering any position in Pratham EPC. Past performance is not indicative of future results, and investing in equities involves inherent risks.
Proceed with caution and ensure alignment with your risk tolerance and investment objectives.

$LMND lagger in fintech, upside potential, EMA SMA crossingNYSE:LMND I'm a fan of financials, NYSE:MA , NYSE:V , NYSE:DFS , NASDAQ:PYPL , NASDAQ:AFRM , etc, even look at $SEZL. I think this name is a laggard in the sector and actually provides a good idea of business, something oversaturated but a different approach and ideas. With momentum and volume this name can trigger great upside potential in the next 3-6 months. Earnings are there and I look the setup here inside the triangle/flag. Long.
Also the 200ema and 200sma are riding nicely and the 50ema and 50sma are crossing over one another.
WSL

$AFRM $70-$80 target, cup and handle WEEKLY, pt. 2 chartYes, I used the brush and drew that juicy cup and handle. I don't know, friends, this one looks really good for setup to long. Part 1 was posted just before this give it a glance. The EMA and SMA used here was the 50 and in the previous chart was 200.
WSL

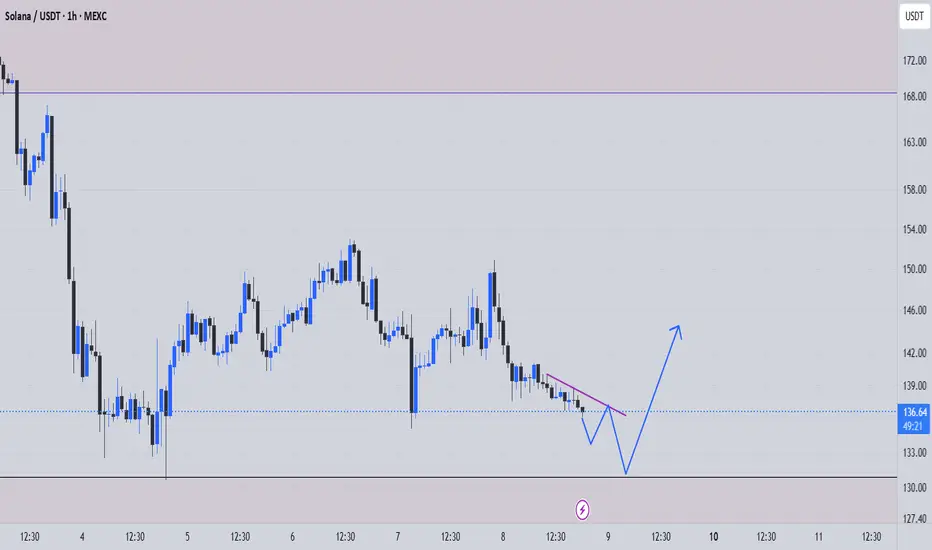
sol buy midterm"🌟 Welcome to Golden Candle! 🌟
We're a team of 📈 passionate traders 📉 who love sharing our 🔍 technical analysis insights 🔎 with the TradingView community. 🌎
Our goal is to provide 💡 valuable perspectives 💡 on market trends and patterns, but 🚫 please note that our analyses are not intended as buy or sell recommendations. 🚫
Instead, they reflect our own 💭 personal attitudes and thoughts. 💭
Follow along and 📚 learn 📚 from our analyses! 📊💡"
DGB ANALYSIS🔮 #DGB Analysis - Breakout 🚀🚀
💲💲 In daily time-frame,Falling Wedge Pattern is forming and a good breakout is done. And a small retest is done, now we would see a good reversal move in #DGB ✅ 💯🚀
💸Current Price -- $0.00955
📈Target Price -- $0.001544
⁉️ What to do?
- We have marked crucial levels in the chart . We can trade according to the chart and make some profits. 🚀💸
#DGB #Cryptocurrency #Breakout #DYOR

BTC/USDT UpdateBitcoin is back to our $85-$86 support level.it is an importantlevel due to the 200 day Ema and trendline support.
another key level is the 200-day MA support,which also aligns with te SBR FOMO low $81.5k

Bitcoin Butterfly Harmonic Pattern – Multi-Fibonacci Confluence!A potential Bullish Butterfly Harmonic Pattern is developing, with point D yet to be completed. If price action reaches the harmonic completion zone, it could present a high-probability long opportunity near a stacked Fibonacci confluence zone.
The D-leg aligns beautifully with the 0.382 Fibonacci retracement of the entire 5-wave Elliott structure from the macro low at $15,476 to the all-time high of $109,588. A level that has acted as key support in the past. Multiple additional Fibonacci confirmations further strengthen this potential bullish reversal zone.
Pattern Breakdown – Bullish Butterfly Formation
The Butterfly Harmonic Pattern is a structured reversal setup, often forming at market extremes before trend shifts.
1️⃣ XA Leg – The initial impulse.
2️⃣ AB Leg – A retracement of 0.786 – 0.886 Fibonacci of XA.
3️⃣ BC Leg – A counter-trend move retracing 0.382 – 0.886 of AB.
4️⃣ CD Leg – The final move, typically extending 1.618 – 2.618 Fibonacci of XA.
📍 In this developing setup:
✅ B-point retraces 0.806 of XA → Butterfly pattern remains valid.
✅ C-point retraces 0.838 of AB → Strengthening structural alignment.
✅ D-leg projection target 1.695 XA extension, converging with multiple key Fibonacci levels.
Fibonacci Confluence – Strong Potential Reversal Zone ($73,783.52 - $73,157)
As price moves toward potential point D, multiple Fibonacci levels create a high-probability reversal area:
0.382 Fibonacci retracement of the entire 5-wave Elliott structure ($73,637.22)
Negative -0.236 Fibonacci retracement at $73,251.43
Negative -0.618 Fibonacci retracement at $73,157
Trend-based Fibonacci Extension 1:1 at $73,783.52
📍 Potential Reversal Zone: Between $73,783.52 and $73,157
Trade Setup – Waiting for Confirmation
Since point D has not completed yet, we should wait for bullish confirmation signals in the reversal zone before entering.
Entry Zone (if price reaches D): Between $73,783.52 and $73,157
Stop Loss: Below $73,157 (D-point invalidation)
Take Profit: B-point resistance
Risk-to-Reward (R:R): 3:1 if TP at B-point
⚠️ Key Reminder:
🚨 The pattern is not confirmed yet. A reaction in the potential reversal zone (e.g., bullish divergences, strong buying pressure, or reversal candlesticks) would strengthen the case for a long position.
Are you watching this level for a potential reaction? Will point D complete? Let’s discuss in the comments! 🚀🔥

BNX: After a +900% Rally, What's Next?BNX had an incredible run, skyrocketing +900% in just 19 days, completing a 5-wave Elliott Wave structure and peaking at $1.3333. Since then, the price has been in a downtrend, now approaching the critical $1.00 psychological support level.
Key Support Levels
The weekly open sits at $0.9387, aligning perfectly with the Point of Control (POC) from the previous trading range, making this a crucial level to watch. However, the bigger question remains—where is the next high-probability trade setup?
Liquidity Below $0.8278 – There's a significant liquidity pool just below this low, making it an attractive area for potential stop hunts before a reversal.
0.5 Fibonacci Retracement ($0.7333) – Measuring the full +900% move, the 50% retracement aligns near a key support zone.
Weekly Bullish Order Block ($0.7076) – A historical area of demand, adding further confluence.
1.272 Fibonacci Extension ($0.7250) – Another confirmation of a potential bounce area.
Anchored VWAP from $0.1334 – Currently sitting at $0.6675, this dynamic support strengthens the buy zone.
0.618 Fibonacci Speed Fan – If the price drops towards this level by late February, it could provide additional confluence for a bounce.
Potential Trade Setups
Bullish Setup: If price sweeps $0.8278 liquidity and enters the $0.7333 - $0.7076 demand zone, a long opportunity with confirmation could offer a great risk-to-reward trade.

EUR/JPY Trade Setup Bullish Breakout StrategyEUR/JPY trade setup is based on a **bullish breakout strategy**. Here’s a breakdown of the analysis:
**🔹 Trade Details:**
- **Entry at 160.200:** This level is identified as a good buying point, likely after a breakout or strong upward momentum.
- **Stop Loss at 159.500:** If the price reverses and hits this level, the trade will be closed to limit potential losses.
- **Target at 161.200:** The price is expected to reach this level if the bullish momentum continues.
### **📊 Why This Trade?**
1. **Resistance Breakout:** If EUR/JPY breaks a key resistance level, it could trigger more buying pressure, pushing the price higher.
2. **Strong Buy Zone:** After breaking resistance, the market often enters a phase where buyers dominate.
3. **Risk Management:** The stop loss is placed to minimize potential downside, ensuring a controlled risk-to-reward ratio.
📌 **Conclusion:** If the price breaks above resistance and holds, it’s a strong buy setup. However, always use proper risk management to protect your capital. 🚀📈

EUR/GBP Trade Analysis & Key LevelsEUR/GBP Trade Analysis & Key Levels
📈 **Current Price:** 0.83800
🔹 **Resistance:** 0.83900
🔹 **Support:** 0.83700
💡 **Market Outlook:**
- Strong **bullish momentum** observed, supported by the **EMA50** trend.
- If the price **breaks resistance**, the next target is **0.84600**.
- If the price **breaks support**, a bearish move may follow.
🎯 **Trade Plan:**
✅ **Entry:** Monitor for breakout confirmation.
✅ **Stop Loss:** 0.83600 (to manage risk effectively).
✅ **Risk Management:** Essential for capital protection.
📊 **Stay updated & trade wisely!** 🚀

The Ultimate Golden Zone to Close Shorts and flip Long TESLA Must Watch Analysis on TSLA revealing the ultimate golden zone to fill your Longs and close your shorts.
In this video I pinpoint a high probability zone of where to take the next long .
I have used a suite of Fibonacci tools to include TR Pocket , Trend based fib, pitch fan , 0.618, VWAP and volume profile to determine the best Long.

NF news - Opportunity for gold price to return to old ATH 2955⭐️Smart investment, Strong finance
⭐️GOLDEN INFORMATION:
Gold’s three-day rally came to a pause as investors locked in profits ahead of the highly anticipated US Nonfarm Payrolls report. A rise in US Treasury yields further dampened the appeal of the non-yielding metal. At the time of writing, XAU/USD remains steady at $2,918.
Despite consolidating above the $2,900 mark, gold faced resistance following an earlier surge in the US 10-year Treasury yield to a one-week high before retreating to 4.286%..
⭐️Personal comments NOVA:
Tariff Situation Remains Long Term Driver for Gold Growth, NF News Key Data to Determine Today's Trend
⭐️SET UP GOLD PRICE:
🔥SELL GOLD zone: $2954 - $2956 SL $2961
TP1: $2945
TP2: $2930
TP3: $2920
🔥BUY GOLD zone: $2832 - $2834 SL $2827
TP1: $2840
TP2: $2850
TP3: $2860
⭐️Technical analysis:
Based on technical indicators EMA 34, EMA89 and support resistance areas to set up a reasonable BUY order.
⭐️NOTE:
Note: Nova wishes traders to manage their capital well
- take the number of lots that match your capital
- Takeprofit equal to 4-6% of capital account
- Stoplose equal to 2-3% of capital account

Bitcoin: Mastering the Art of Resistance and SupportBitcoin recently broke below a 105‐day trading range, anchored by the critical 90K level. After the breakdown, it found support around 80K, prompting a sharp rebound back toward the previous range. This rebound, however, was short‐lived: BTC tested 95K, then quickly retraced, only to rally again toward 90K, where it trades at present.
Overview of BTC’s 105‐Day Range Break and Retest:
Yearly Open at $93,576: This is the single most important level to watch. Price currently sits below the yearly open, suggesting that, for now, bears hold the upper hand. If bulls cannot reclaim this threshold, the yearly candle remains vulnerable to turning red.
90K–95K Resistance Zone: With Bitcoin failing to sustain gains above 95K, this band becomes a natural focal point for potential short entries. Bears are expected to defend this region aggressively.
The question: Where do we go next? Let’s break down both the resistance (short setup) and an upcoming support zone (long setup), incorporating a variety of confluences—from volume profiles and trend lines to Fibonacci retracements and pitchfork alignments.
1. Resistance Analysis & Short Thesis
1.1. Double Top Target at $72,800
A double top pattern has formed, suggesting a measured‐move target near $72,800. While not a guaranteed endpoint, this target serves as an early directional clue. Price could still find support at higher levels, so we use this only as one piece of a larger puzzle.
Double Top Pattern with $72,800 Target:
1.2. The 105‐Day Trading Range & Retest
Bitcoin spent over 100 days ranging between roughly 90K and 105K. The downside break turned that prior range into a new resistance zone—specifically 90K–95K, with an even stronger cluster up to $96,418 (Point of Control from that range).
Fixed Range Volume Profile: The POC (Point of Control) from this 105‐day period lies at $96,418.05, further extending our resistance zone. Price retesting anywhere between 90K and the POC around 96K sets up potential short entries.
Fixed Range Volume Profile Showing POC at $96,418.05:
Stop Loss Guidance: Given the possibility of wicks or “stop hunts,” a safer invalidation point sits above 98K. That buffer allows the trade room to breathe without prematurely stopping out on minor spikes.
1.3. Daily & Weekly Moving Averages
In addition to the above factors, both the daily 21 EMA/SMA and the weekly 21 EMA/SMA are converging in the 90-92K region, acting as additional resistance.
1.4. Bearish Trend Line & Pitchfork Alignment
Bearish Trend Line: Connecting the all‐time high at $109,588 and the swing high at $106,457.44 yields a downward sloping line. This trend line has already acted as resistance near 100K on February 21.
Pitchfork (Modified Schiff): Anchoring from the all‐time high (109,588) to the swing low (97,777.77) and back up to 106,457.44 confirms the same bearish trajectory, aligning neatly with the trend line around 95K.
Bearish Trend Line & Pitchfork Convergence Around 95K:
1.5. Monthly Order Block & Fibonacci Confluence
Monthly Order Block: Spanning from the yearly open (93,576) up to the POC (~96,418), this monthly order block forms a substantial supply zone. Price often gravitates toward the median line of an order block, which sits near 94–95K.
Fibonacci Retracement (0.786): From the swing high at 99,475 (Feb 21) down to the low at 78,258.52, the 0.786 retracement is at 94,934.67—almost exactly the median line of the monthly order block.
Monthly Order Block, Median Line, and 0.786 Fib at ~94,934.67:
When price rallies swiftly to the 0.786 for the first time, it often presents an ideal short entry—especially under a confluence of bearish signals:
2. Short Trade Setup: Laddering In & Out
2.1. Scaling In (Entries)
We allocate $25,000 (from a $100,000 account) and ladder our entries from 89,736 up to 96,206:
Short Trade Laddered Entries:
Stop Loss: $97,560 (slightly below the higher “breathing room” area of 98K).
Max Risk: Approximately $1,028.16 (about 4.11% of the GETTEX:25K position, or 1.03% of the $100k account).
2.2. Scaling Out (Exits)
We plan to take profits in increments as price drops, aiming for an average exit around $79,822.10:
Potential Profit: Approximately $3,704.16 on a $25,000 position, which is +14.82% (or +3.70% of the $100k account).
Risk‐to‐Reward Ratio: 3.60, an attractive R:R for a swing trade.
3. Support Analysis & Long Thesis
Having addressed the downside retest and short scenario, let’s turn to potential support where Bitcoin might reverse for a long trade.
3.1. Double Top Target & 5‐Wave Structure
The double top projected target near $72,800 aligns with a broader Elliott Wave possibility, where BTC may have completed a 5‐wave structure from the low at $15,476 to the all‐time high at $109,588.
A typical Fibonacci retracement of this 5‐wave move suggests the 0.382 level at $73,637.22, which sits near a notable swing high of $73,777—coincidence?
5‐Wave Structure & 0.382 Fib Retracement at ~$73,637:
3.2. Monthly Bullish Order Block & Further Fib Confluence
Monthly Bullish Order Block: Located around $71,280, historically a place where buyers have stepped in.
Fib Retracement (49K to 109K): The 0.618 retracement lands at $72,144.62, adding further confluence around the 72–73K zone.
Taken together, we begin to see a support band forming between $73,777 and $71,280.
Monthly Bullish Order Block & 0.618 Fib ~$72,144.62:
3.3. Fib Speed Fan & Bullish Trend Line
Fib Speed Fan (0.7): On higher timeframes, the 0.7 fan lines up with the same 71–73K region if BTC dips this month.
Bullish Trend Line: Connecting the lows at 49K and 52,550 also aligns with this zone, reinforcing the idea that a cluster of support awaits if price slides that far.
Bullish Trend Line & Fib Speed Fan ~$71–73K:
3.4. Potential Long Trade Setup
Entry Range: Ladder in from 76K down to 71K (or adjust according to personal risk appetite within that 73–71K zone).
Stop Loss: Below 70K, providing sufficient buffer.
Target: At least the monthly open ($84,350), or higher if momentum supports a stronger bounce.
Risk‐to‐Reward (R:R): Aim for 2:1 or better, depending on exact entries and the final target.
4. Summary
Short Trade:
Resistance Zone: 90K–95K, extending up to $96,418 (POC) and with the daily/weekly 21 EMA/SMA acting as additional resistance in the 90-92K region, plus a stop‐hunt buffer above 98K.
Laddered Entry: GETTEX:25K allocated, averaging around $93,706, with a stop near $97,560.
Scaling Out: Average exit near $79,822, netting a +14.82% gain on the position (+3.70% on account).
R:R: 3.60—solid for a swing setup.
Long Trade:
Support Zone: Between $73,777 and $71,280, with multiple Fibonacci and structural confluences.
Laddered Entry: Potential DCA from around 76K down to 71K, with a stop under 70K.
Target: At least $84,350 (monthly open), likely offering a 2:1 or better risk‐to‐reward.
Sharp moves up or down have been the norm lately, often gravitating to the 0.786 fib retracement on each leg, so remain vigilant for sudden volatility.
Ultimately, flexibility is key. If Bitcoin reclaims the yearly open at $93,576 and pushes decisively above 95–98K, the bearish case weakens. Conversely, a significant drop below 80K brings the deeper support zone near 73–71K into sharper focus.
Always be prepared for shifts in market conditions—confirm each setup with multiple indicators and chart patterns before entering any trade. Stay up to date with evolving market dynamics and adjust your strategy accordingly.
Happy trading!
P.S. If you have any coin requests, feel free to share them in the comments. I will be selecting one or two for the next technical analysis.

Gold purchase strategy continues to prioritize. Target 500 pips!Dear friends!
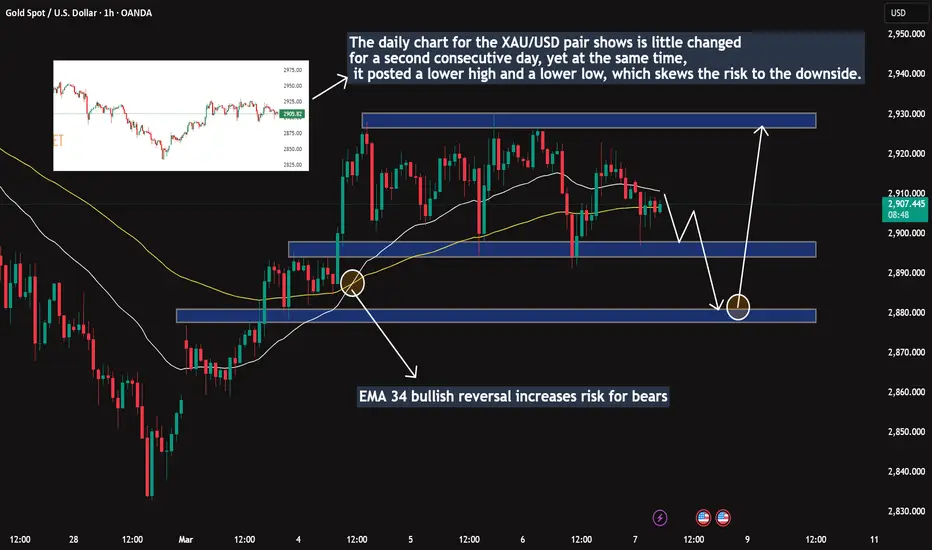
Gold continues to trade negatively for the second consecutive day, despite a combination of factors still acting as key drivers ahead of the crucial U.S. NFP report at the end of this Friday. Rising trade tensions continue to put pressure on investor sentiment.
As mentioned on the 1-hour chart, the daily chart for XAU/USD shows little change for the second consecutive day. However, at the same time, it also records lower highs and lower lows, shifting the risk bias to the downside. Nevertheless, the short-term picture indicates that buyers are struggling to maintain control, with the 34 EMA having reversed, increasing the risk for sellers. As a result, the downside potential remains limited, with dips likely to continue attracting buyers.
Key short-term levels to consider:
Support: 2,894 | 2,876
Resistance: 2,911 | 2,927
Same Support level tested againUpdate as on 06-03-2025
Support level that was
mentioned a month ago, again played
well.
Now again 600 - 630 is the resistance for now.

doge buy midterm"🌟 Welcome to Golden Candle! 🌟
We're a team of 📈 passionate traders 📉 who love sharing our 🔍 technical analysis insights 🔎 with the TradingView community. 🌎
Our goal is to provide 💡 valuable perspectives 💡 on market trends and patterns, but 🚫 please note that our analyses are not intended as buy or sell recommendations. 🚫
Instead, they reflect our own 💭 personal attitudes and thoughts. 💭
Follow along and 📚 learn 📚 from our analyses! 📊💡"
