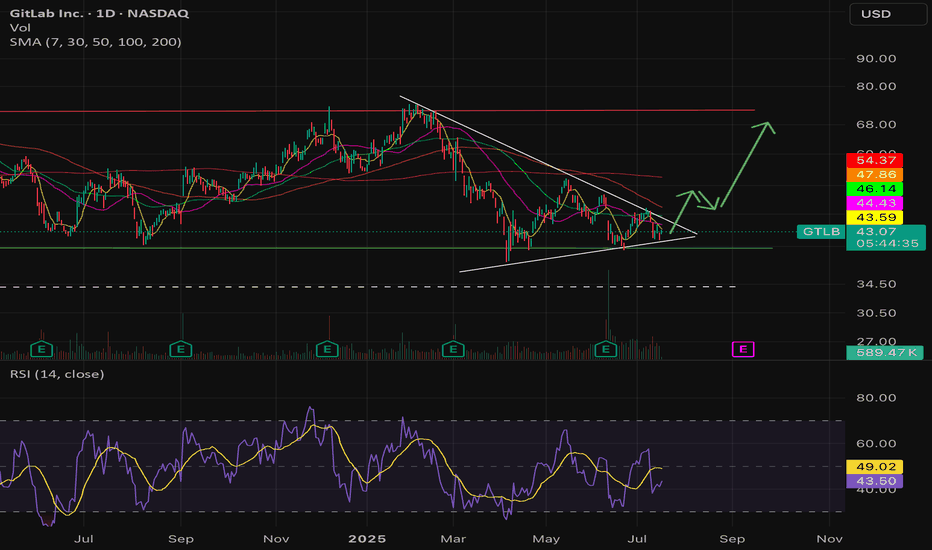
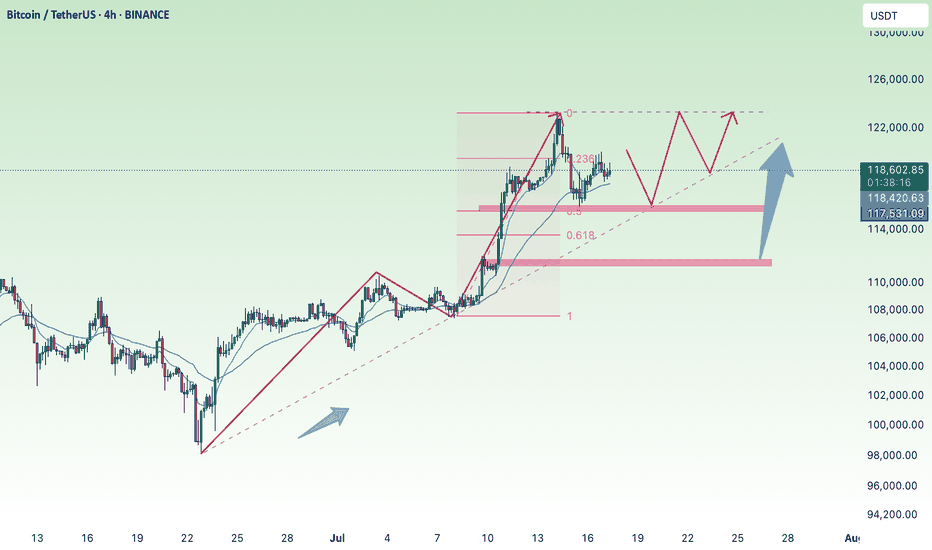
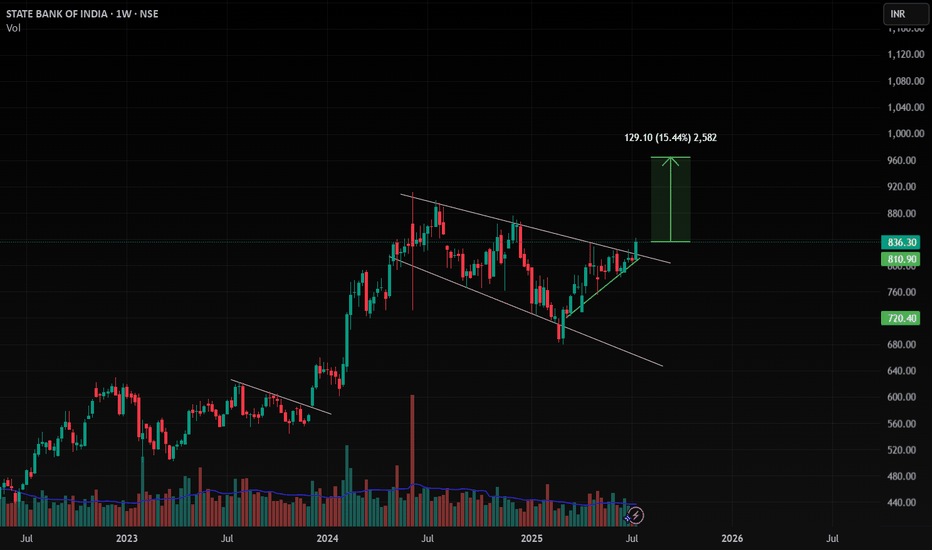
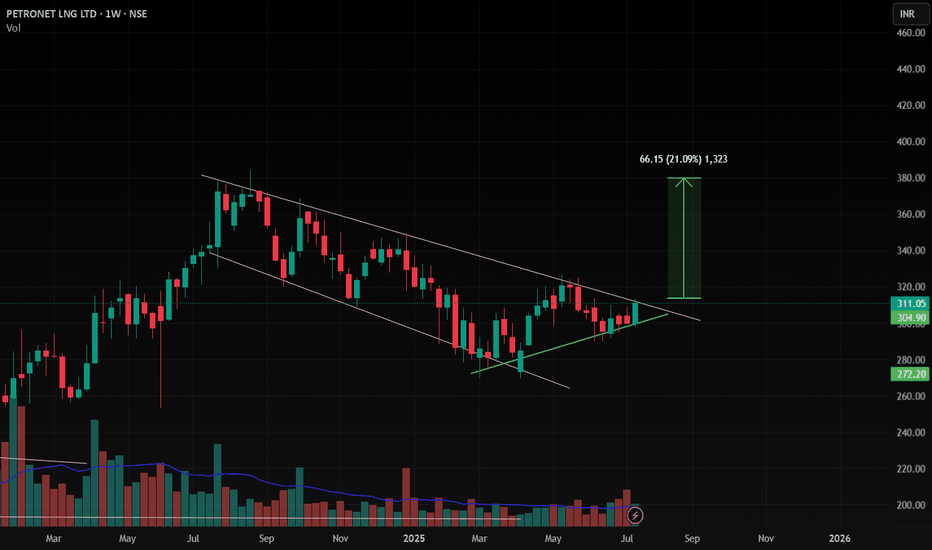
Longsetup
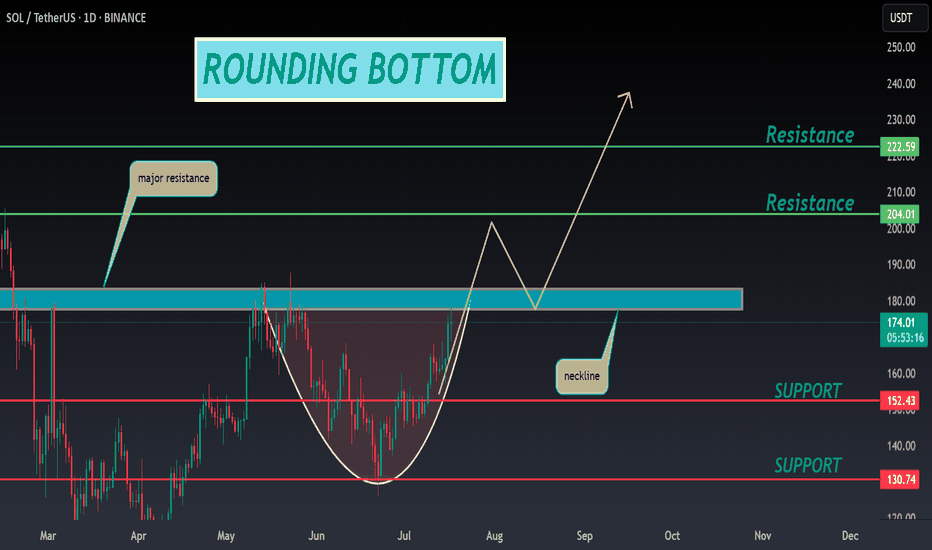
Solana With Another Clear Long Signal Given!Trading Fam,
Not too much to say here other than the fact that my indicator has recently given us another very clear buy signal inside our liquidity block after hitting support. This alone is all we needed for entry but if you're not familiar with how accurate my indicator has been for us on these larger cap/large volume tokens, then you can see below we also have plenty of confirmation from the Heiken-Ashi, RSI, and MACD. Here we go!
✌️ Stew
#OMUSDT Expecting further upside momentum📈 LONG BYBIT:OMUSDT.P from $6.2310
🛡 Stop Loss: $6.1400
⏱ 1H Timeframe
✅ Overview:
➡️ BYBIT:OMUSDT.P is showing strong bullish momentum after breaking above $6.1965, confirming buyer strength.
➡️ The price is now above a key level, which could act as a support for further movement upward.
➡️ The main target for this move is $6.4600, a significant resistance level.
➡️ POC at $5.8242 suggests that major liquidity was accumulated below, reinforcing the bullish outlook.
➡️ Increasing volume indicates strong buying pressure, which supports further upward continuation.
⚡ Plan:
➡️ Enter LONG from $6.2310 if the price holds above this level.
➡️ Risk management with Stop-Loss at $6.1400, to protect against false breakouts.
➡️ Main upside target:
🎯 TP Target:
💎 TP1: $6.4600 — key resistance zone for potential profit-taking.
🚀 BYBIT:OMUSDT.P Expecting further upside momentum!
📢 BYBIT:OMUSDT.P If the price stays above $6.2310, further upside towards $6.4600 is expected.
📢 However, if the price drops below $6.1400, a pullback or range-bound movement could occur.
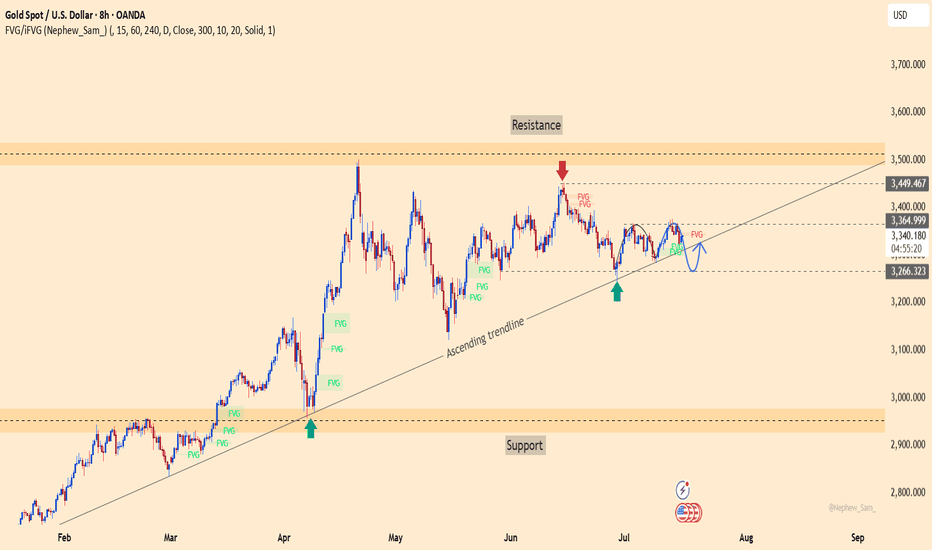
Trade war tensions, will gold prices rise to 2900?Gold News:
🔆On Sunday, Trump announced plans to impose a 25% tariff on all steel and aluminum imports into the United States today. This led to concerns that a new trade war would escalate in the near future. Gold prices rose slightly in Asian trading.
🔆The US 10-year bond yield also fell slightly in early trading, but the DXY Dollar Index rose 0.34% on the day to trade at 108.44.
Review:
🔆Gold prices are expected to retest the ATH level of last Friday. Trump's tariff policy and the response of related countries remain the main factors affecting the upward trend of gold. If tensions continue to escalate, gold prices will continue to maintain the upward trend.
Analysis :
🔆Based on the continued escalation of trade tensions between the United States and related countries
🔆RSI (1H) is rising and above the moving average, indicating an uptrend
The uptrend line is combined with the Resistance - Support zone.
Plan:
🔆Price Zone Setup:
👉Buy Gold 2868 -2870 (European session)
❌SL: 2864 | ✅TP: 2875 - 2882 – 2890
👉Sell Gold 2884 -2886 (European session)
❌SL: 2891 | ✅TP: 2878 - 2870 – 2860
Thank you for reading my comment: "FM"
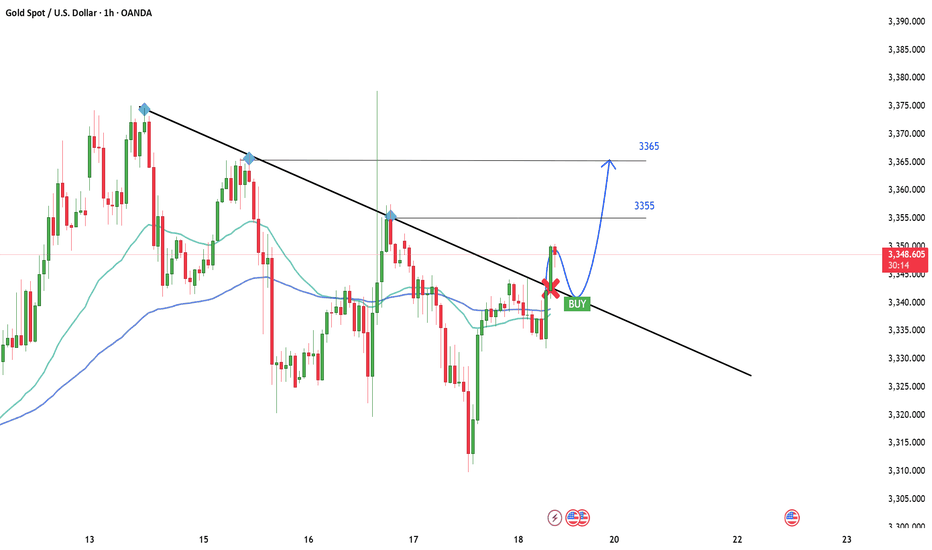
GOLD → First declines, then continues to conquer $2,900OANDA:XAUUSD is currently moving slowly on a bullish trend platform, with the price fluctuating around $2,868 and rising by approximately 0.45% on the day.
Inflation remains on an upward trajectory, and gold is responding as a safe-haven asset. "Gold is on track to reach $2,900 per ounce, and market sentiment remains highly optimistic, despite the short-term strength of the U.S. dollar."
Furthermore, recent statements from Federal Reserve officials indicate that major policy uncertainties—including tariffs and other issues stemming from the early days of former President Donald Trump's administration—are among the biggest challenges in determining monetary policy direction in the coming months.
Currently, the market's focus is on the upcoming Non-Farm Payrolls (NFP) report, set to be released on Friday, which will provide further insights into the overall strength of the economy and the Fed’s policy path. Theoretically, a disappointing jobs report could strengthen the case for interest rate cuts in the U.S., thereby boosting gold prices. However, the opposite scenario is also possible.
From a technical standpoint, gold prices may decline from the $2,870 resistance level to accumulate liquidity and prepare for further upward movement. Specifically, the price could react to lower trend boundaries and the previously broken resistance of the ascending channel. There are no fundamental or technical reasons to break the current trend, and growth may resume after a potential false breakout.
Regards Bentradegold!
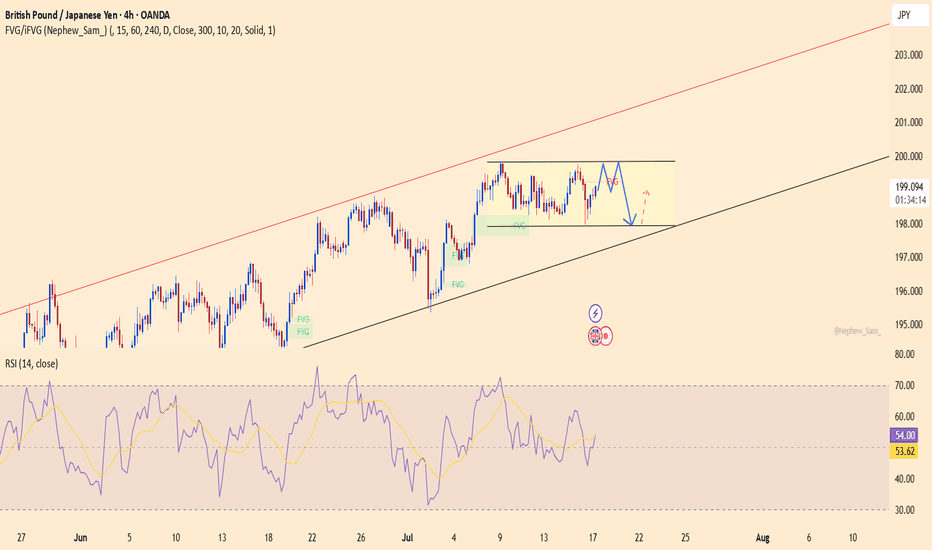
USD/JPY: What's Changing at Year-End?Hello, dear friends!
As the year comes to a close, USD/JPY has shown significant movement, reversing course and dropping below the 157.00 mark. This late-year shift comes as market participants prepare for midweek closures and reduced activity around the New Year holiday. Despite lighter trading volumes, price action remains dynamic, signaling potential shifts in the trend.
Technically, USD/JPY has failed to maintain its position within the parallel ascending channel, suggesting the emergence of a new trend. A key level to watch now is the immediate support at 156.03. The critical question is whether this support will hold and for how long. Looking at the bigger picture, sustained consolidation below the broken channel could lead to a move toward lower targets, as indicated on the 4-hour chart.
If you find this idea insightful, don’t forget to leave your thoughts in the comments below and share it with your network. Your support gives me immense motivation to continue sharing valuable experiences and strategies in the forex market. Let's conquer this journey together!
USDJPY: Correction before dropping to 153.00-152.00Hello everyone, Ben here!
USDJPY has yet to resume its upward trend. Rumors about potential actions from the Bank of Japan (BoJ) are beginning to surface. Meanwhile, the US dollar continues to gain strength.
The 158.46 level represents a strong resistance zone established by the sellers. Strong expectations for an additional interest rate hike by the BoJ this week are also lending support to the JPY. Overall, this influence appears relatively weak but could still provide significant backing for this currency pair.
In theory, any upward movement of this major pair might be limited due to trade policy risks from the soon-to-be-inaugurated US President Donald Trump, which have constrained any significant bullish moves for the safe-haven JPY.
The focus this week will be on Trump’s inauguration speech on Monday and the highly anticipated two-day BoJ policy meeting beginning on Thursday.
From a technical standpoint, the price is attempting to break out of a major range and test key support levels. A false breakout around the 156.56 level could lead to the price targeting newly formed resistance zones. However, if the price settles below 156.56 or even drops under 155.95, it could trigger strong selling pressure sooner than expected.
Best regards, Bentradegold!
SUI’s Wild Ride – Finding the Next Long Trade SetupSUI had an incredible 2024, skyrocketing +1060% in just 154 days. The price peaked at the psychological $5 mark, where multiple rejections signaled a momentum shift. By the end of January 2025, the trend turned bearish, leading to a sharp correction.
Trend Shift & Momentum Analysis
I've been working on a new trend identifier indicator that helps spot trends, allowing traders to identify swing trade opportunities and manage their positions effectively. This indicator clearly highlighted the momentum shift, confirming the bearish turn and the sharp price drop that followed.
Key Support Zones & Confluences
Now that the bearish trend is in play, the focus is on identifying a solid long opportunity:
Point of Control (POC) from Previous Trading Range (~$2) – A major psychological level that many traders are watching
Trend-Based Fibonacci Extension (1:1) at $2.0373 – Adding confluence to this critical support area
Fib Speed Fan (0.75 Level) – Aligns with the $2 region, reinforcing support
Anchored VWAP (~$1.885) – From the 2023 lows, acting as an additional support zone
What’s Next for SUI?
The market is in search of a strong support level where bulls can regain control. Let’s see if we find support at the $3 mark. The $2 zone stands out as a prime area for a potential long entry, given the multiple technical confluences. If price reaches this level, we’ll be watching closely for confirmation of a bullish reversal.
Final Thoughts
SUI has had an extraordinary run, but corrections are natural in strong trends. The key now is to see where price stabilises and if the bulls can make a strong comeback. Time will tell how this plays out, but for now, $2 is a level to keep an eye on for a potential long setup.
BTW: I've just launched a FREE TradingView indicator – Multi Timeframe 8x MA Support & Resistance Zones. It helps visualise key support and resistance levels across different timeframes. Check it out and let me know your thoughts!
RARE ANALYSIS📊 #RARE Analysis : Update
✅As we said earlier, #RARE performed same. Around 300+% move done in #RARE. Same technical analysis here.🧐
Here we can see the price is around its major support zone. 2 times bullish move from the same support point.
👀Current Price: $0.0690
🚀 Target Price: $0.01390
⚡️What to do ?
👀Keep an eye on #RARE price action and volume. We can trade according to the chart and make some profits⚡️⚡️
#RARE #Cryptocurrency #TechnicalAnalysis #DYOR
World trade tensions, gold price opportunity above 2900✍️ NOVA hello everyone, Let's comment on gold price next week from 02/10/2025 - 02/14/2025
🔥 World situation:
Gold extended its rally on Friday as US-China trade tensions escalated and US employment data delivered mixed signals. XAU/USD climbed 0.24%, trading at $2,862.
President Donald Trump’s plans to impose reciprocal tariffs on multiple countries next week provided a boost for bullion, reinforcing its safe-haven appeal. Rising geopolitical uncertainty over the weekend could further drive demand for gold.
Meanwhile, US data showed January’s Nonfarm Payrolls fell short of expectations, but the Unemployment Rate declined from both estimates and December’s reading. This resilience in the labor market could deter the Federal Reserve from easing policy in the near term.
🔥 Identify:
The long-term framework continues for the upcoming uptrend, in the context of the risk of trade war is still very tense, gold becomes a safe investment channel, the opportunity to reach ATH 3000 this year
🔥 Technically:
Based on the resistance and support areas of the gold price according to the H4 frame, NOVA identifies the important key areas as follows:
Resistance: $2886, $2900, $2944
Support : $2833, $2810
🔥 NOTE:
Note: Nova wishes traders to manage their capital well
- take the number of lots that match your capital
- Takeprofit equal to 4-6% of capital account
- Stoplose equal to 2-3% of capital account
- The winner is the one who sticks with the market the longest
TIA SHORT/LONGTIA has dropped below $3.7, the lower boundary of its range, which isn't necessarily a bad thing.
If the price manages to reclaim $3.7, it would confirm a major fakeout, potentially pushing the price back up to $5-$6.
In the short term, we might see a small bounce toward the 21 EMA on the daily timeframe, accompanied by a bullish cross on the Stoch RSI.
After that, another pullback could happen, setting up a second bullish cross on the Stoch RSI—which, historically, has often led to stronger upward moves.
Is Bitcoin Topping Out? Critical Levels to WatchSince the low of $15,476 on November 21, 2022, Bitcoin has surged to an all-time high of $109,588 on January 20, 2025. That’s an incredible +608% increase over 791 days. We also hit the long-anticipated $100K mark. But for almost three months now, Bitcoin has been stuck in a range between $90K and the all-time high, showing some indecision in the market.
Looking Back: Market Structure & Trends
Bitcoin spent over 250 days consolidating between $50K and $70K before finally breaking out in November 2024, right around the U.S. election. That breakout triggered a massive rally, pushing Bitcoin to 100K in just one month. Since then, bulls and bears have been battling it out, trying to establish control over this crucial psychological level.
A look at the pitchfork tool shows that Bitcoin has been rejected at the 0.618, 0.666, and 0.786 levels multiple times while trying to push higher. Recently, we lost the median line of the pitchfork and dropped below 100K, suggesting bullish momentum is fading. The 233 SMA/EMA on the 4-hour TF as well as the 21 EMA/MA on the daily TF has also flipped into resistance, adding to the bearish pressure.
Is February Shaping Up to Be a Bearish Month?
If we compare the current cycle to the 2020 bull market, the price action looks similar, forming a top where Bitcoin struggles to break higher. February could bring a healthy correction before any new leg up.
Key Support Zones & Confluences
Here’s where we could see solid support:
Unfilled CME Gap at $77,930 – Historically, Bitcoin tends to fill these gaps over time
Pitchfork Lower Support Line (~$80K) – If Bitcoin drops, this level aligns with multiple confluences by late February or early March
Fib Speed Fan (0.618 from $50K to ATH) – Perfectly lines up with the pitchfork lower support around $80K
Trend-Based Fibonacci Extension (1.618) – Another confluence at the $79K mark
Fib Retracement (0.5 from $50K to ATH) – Adds more support at $79.3K
Negative Fibonacci Retracement (-0.618) – Lands right at the open gap, reinforcing this zone
Daily 233 EMA/MA – Sitting at $81.3K and $76.4K, further supporting this region
Key Support Zone: $80K - $78K – With all these confluences, this is a strong area for a potential long setup
Additional Support Zone: FWB:88K - $86K – Another important region to watch for a bounce
Resistance Levels & Confluences
Psychological Resistance at 100K – A major battle zone between bulls and bears
Daily 21 EMA/MA (~$99.5K - 101K) – A key resistance level that could cap any upward movement
233 SMA/EMA on the 4H Timeframe – Now acting as resistance, adding pressure to the downside
Potential Trade Setups
Long Setup #1: A potential entry from FWB:88K - $86K
Long Setup #2: $80K - $78K support zone with confirmation could present a high-probability trade
Final Thoughts
Bitcoin is facing strong resistance at 100K, with multiple technical indicators suggesting a possible pullback. While the bigger trend remains bullish, February might bring a correction, providing great long opportunities around the FWB:88K - $86K and $80K - $78K region. Keep an eye on key support zones and look for confirmation signals before jumping into trades.
New Indicator Release
The 4H, Daily, and Weekly support zones seen on the charts are from my new indicator, which I released for free a few days ago. Feel free to check it out and incorporate it into your analysis.
BTC Long, bear trap doneDaily level the last fews days not being able to break belove 95.500-95.000 level.
Looking at the btc liquidity heatmap, there is not really much liquidity left below, loads of liquidity left above 109.000.
Aiming for this huge RR trade, small stoploss. Would be my best trade ever if this succeeds.
Also lots of positive bitcoin news the last few days. Im bullish.
I was also waiting and waiting for 60k 80k levels, but i don't really think it will drop that far anymore, perhaps in the case of a massive world event.
what is happening to BTC right now ?! 🐺 "Hello, KIUCOIN family . I hope you're doing well. 🐺
In this analysis, I've decided to explain what's likely to happen to the BTC price in the immediate short term and the long term. Be sure to stay tuned with me until the end, as it's going to be mind-blowing." 🤯
"First of all, let's examine the monthly chart. In my opinion, this is one of the best timeframes, especially for this analysis, because it reveals extraordinary price targets. Let's dive into it :
As you can see on the monthly chart , BTC is between two uptrend curves that have acted as support and resistance since 2015 . These curves are fairly strong, justifying their classification as strong support and resistance lines on the monthly timeframe.
As you may already know, the higher the timeframe we examine, the more accurate results we can achieve. Therefore, the patterns on the monthly timeframe are much more accurate than those formed on the daily or even the weekly timeframe. In this case, we have a clear and perfect bullish flag pattern . This is a bullish pattern, and its main target, which aligns with our resistance line, is around $165,000. 🔥🐺🚀
So let's reveals more details for you dear 🐺KIUCOIN🐺 family :
In the chart above, on the weekly timeframe, we have a clear AB=CD pattern . This is a well-known pattern in harmonic trading and, in my opinion, is quite accurate. Seven out of ten times, these patterns reach their targets, making them a valuable tool for traders .
So I think there is another secret reason for us to pay attention to it :
BTC.D
As you can see in the chart above, BTC.D is currently within a symmetrical triangle, which could also be considered an ascending triangle in this case. It appears to be on the verge of breaking out. In my opinion, if BTC.D breaks through this resistance level, it could be incredibly beneficial for the BTC price , potentially leading to a significant rally up to $165,000. However, this could also be challenging for altcoins and ETH . While they might also experience pumps alongside BTC, these pumps are likely to be less substantial. After such a BTC-led rally, we could expect a massive altcoin and ETH season. So, stay tuned with me until that time, as we could potentially make life-changing money together during this market cycle.
Now finally it's time to take look at the lower time frame :
As you can see on the daily timeframe , if BTC breaks through the orange resistance line , we could consider entering a long position with a target of the previous all-time high. You could also take some profits at a predetermined level and set your stop at the entry point to protect your initial investment. The remaining position could then potentially continue to generate profits, leading to a higher target of $165,000.
I hope you enjoy this idea dear KIUCOIN family , also always remember :
🐺 Discipline is rarely enjoyable , But almost always profitable 🐺
ZEN’s Reversal Zone – Perfect Time to Go Long?ZEN has seen a sharp 78.65% decline from its $46.28 high, dropping over the past 40 days. With six consecutive red daily candles, we’re at a critical point to determine whether a bullish reversal is near or if further downside is ahead. Let's analyse the key support and resistance zones and establish high-probability trade setups.
Support Levels & Confluences
1️⃣ Psychological Support – $10: Price bounced off $10, aligning with the 0.886 Fib retracement.
2️⃣ Trend-Based Fib Extension 0.786 – $11.33: Indicates potential correction completion
3️⃣ Yearly Open from 2021 – $11.61: Acts as a historical support level
4️⃣ Weekly Support at $11.48 (0.618 Fib Retracement): Aligns with the weekly order block ($12.13 - $11.45)
5️⃣ Monthly 21 SMA – $10.86: Aligns with the 0.786 Fib
Long Trade Setups – Laddering Strategy
Long positions can be laddered from $11.48 (0.618 Fib) down to $10.82 (0.786 Fib) for a better cost basis.
Long Entry #1: $11.48 (0.618 Fib Retracement)
Long Entry #2: $11.00 (Mid-range level between fibs)
Long Entry #3: $10.82 (0.786 Fib Retracement)
Stop Loss: Below $10.60
Take Profit: $14 - $15
R:R: 13:1 (for 0.786 Fib entry)
This laddering approach allows for better risk management and capital allocation.
Alternative Long Entry – Confirmation-Based Trade
Entry: If price reclaims $12.11 (Daily Open & Weekly Level) and retests it as support
Stop Loss: Below $11.48
Target: $14 - $15
R:R: 3:1
Resistance Levels & Short Setup
1️⃣ Weekly Open - $14.20
2️⃣ Monthly Level - $14.85
3️⃣ Weekly Level - $15.12
4️⃣ Key Resistance - $15
5️⃣ 0.5 Fib Retracement from Downward Wave - $15.25
6️⃣ Weekly 21 SMA - $14.92
Short Setup (If Price Reaches Resistance & Shows Weakness)
Entry: Between $14.85 - $15.25
Stop Loss: Above $15.50
Take Profit: $14.2 - wOpen
Key Takeaways:
Ladder long entries from $11.48 - $10.82 to maximise R:R
Alternative long trade if price confirms $12.11 as support
Strong resistance at $14.85 - $15.25, ideal for profit-taking or a short trade setup
Multiple confluences (Fib levels, moving averages, order blocks) confirm these setups
New Free Indicator Release 🚀
I've just launched a FREE TradingView indicator – Multi Timeframe 8x MA Support & Resistance Zones. It helps visualise key support and resistance levels across different timeframes. Check it out and let me know your thoughts!
#BNBUSDT forecast for a long move📉 LONG BYBIT:BNBUSDT.P $589.70
🛡 Stop Loss: $588.50
⏱ 1H Timeframe
📍 Overview:
➡️ BYBIT:BNBUSDT.P continues to move within an ascending channel, gradually recovering after a local correction.
➡️ P OC (Point of Control) at $588.10 indicates a high-interest zone, from which price has rebounded multiple times.
➡️ The key resistance zone is around $592.45 , where the first profit target is set.
➡️ Holding above the current level could trigger further upside movement towards $596.00, strengthening the bullish momentum.
⚡ Plan:
➡️ Considering a LONG entry at $589.70, with a Stop Loss at $588.50 .
➡️ A breakout above $592.45 will confirm buyer strength and pave the way for $596.00.
➡️ Increased volume at the current level suggests institutional interest, increasing the probability of scenario execution.
🎯 TP Targets:
💎 TP 1: $592.45
💎 TP 2: $596.00
📢 BYBIT:BNBUSDT.P maintains a bullish structure despite temporary pullbacks.
📢 Key focus should be on price action at $592.45 – a breakout here will solidify the bullish case.
📢 Monitoring volume dynamics is crucial – increased buying activity will reinforce the uptrend.
🚀 BYBIT:BNBUSDT.P remains strong – expecting a move towards $596.00 upon breakout of key levels!
RNDR SHORT/LONGWe had a strong reaction from $3.5, with a bounce of nearly 50%. Currently, the price is at a support level of around $4.1.
From here, the price could either consolidate or gradually move lower toward $3.5, possibly even $3, as the Stoch RSI still has room to go down.
However, a short-term rally toward the 21 EMA on the daily timeframe ($5.6) is also possible.
I'm considering entering a short if the price makes a fakeout above the 21 EMA, targeting at least $4. After that, if the setup aligns, I would look for opportunities to scale into long positions. We also need to remember that on February 11, RNDR will release 0.10% of its total supply into circulation.
This could add some selling pressure, so it’s worth considering when evaluating potential price movements.
FTT ANALYSIS📊 #FTT Analysis
✅There is a formation of Falling Wedge Pattern on daily chart with a breakout and currently trading around its major support area🧐
Pattern signals potential bullish movement incoming after a successful retest
👀Current Price: $1.946
🚀 Target Price: $3.050
⚡️What to do ?
👀Keep an eye on #FTT price action and volume. We can trade according to the chart and make some profits⚡️⚡️
#FTT #Cryptocurrency #TechnicalAnalysis #DYOR
PYPL : Another Dive or Finally Time to Buy?PayPal (PYPL) has been getting slapped around like a rookie in a heavyweight fight. The stock is now chilling above a thick support zone—right above the 50% and 61.8% Fibonacci retracement levels. Sounds like fancy chart talk, but all it really means is: This could be where the pain finally stops.
There's also an unfilled gap across multiple timeframes, and gaps like these tend to get filled at some point. If NASDAQ:PYPL keeps sliding, it might take out the previous quarterly low. Why does that matter? Because these lows act like a magnet, dragging price down just enough to shake out weak hands before launching higher. That’s when the selling pressure finally dies down. And the RSI? Almost in the basement—last time we saw this (November 2023), PYPL ripped higher shortly after.
My plan? Set alerts, watch closely, and pounce when the signs point to a reversal. I’m not about to catch a falling knife, but if this thing turns around, I sure as hell don’t want to be left behind.
$UBER looks like a bargain to me in FY 2025. PT $95-104- Uber's capital-light business model has been a major boon to their growth and global expansion efforts, whereas robotaxi will be capital extensive.
- The biggest worry regarding robotaxi implementation is the up-front capital required to get the required vehicle fleet on the road, and the years it may take to get the operations running efficiently. However, I don't think that the fear of robotaxi is overblown, as it is simply not a suitable business model in comparison to Uber's current infrastructure.
- I don't believe robotaxi fears will have materialistic impact on Ubers financials for years to come. Therefore, NYSE:UBER is a strong buy for me and I am comfortable in holding this stock and adding more if it dips.
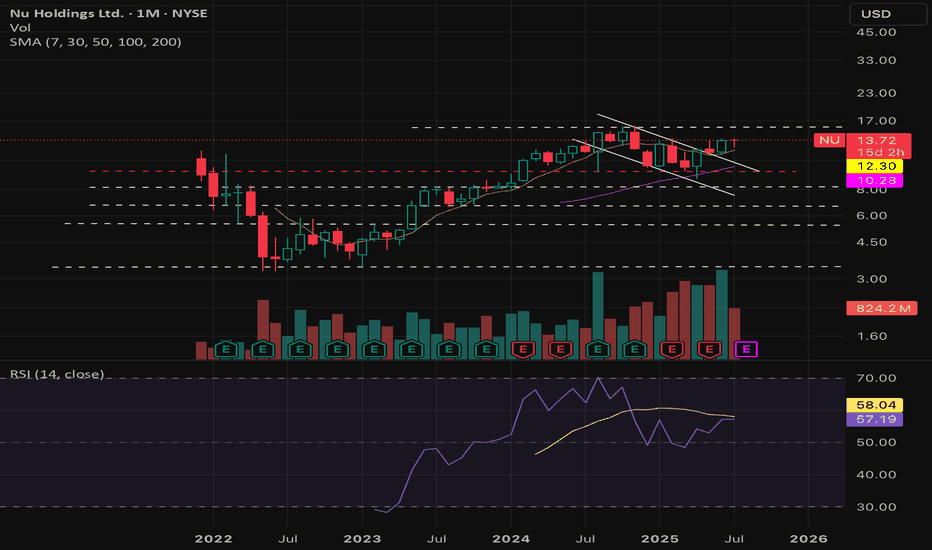
$NU will be 15+ before end of FY 2025- This bank has phenomenal growth, expanding TAM in latin america.
- Numbers speaks for themselves, It's poised for success for rising middle class consumers in latin america.
- Digital Banking will provide immense value in latin america where typical banks were the only way to do banking in the past.