$BTC/USDT MAJOR PUMP? or MAJOR DUMP?BTC, the worlds biggest and fastest growing coin. With a market cap in the Trillions, we are facing a major moment.
Will price dump? or will it pump and go above and beyond.
Lets find out in this analysis!
1. Trend Overview
HTF Bullish:
Price remains above the long-term bullish trendline, showing strong macro support.
Recent price action is consolidating within a major supply zone and liquidity cluster — signaling indecision before a breakout or breakdown.
📈 2. OBV (On-Balance Volume) Analysis
OBV is coiling in a symmetrical triangle, indicating a volume squeeze.
This tightening range typically precedes a major breakout or breakdown, matching the price consolidation near resistance.
🔄 Market Structure
Price has formed a potential top just under the supply/liquidity zone (~$110,000–$112,000).
Swing High is defined just below $112K.
Key structure zones are:
Resistance zone at current levels.
Support zones:
1D FVG ($97K) and Weekly FVG ($87K–$93K)
🟪 Supply & Demand Zones
Supply Zone: $100k - $112k — multiple rejections here indicate this is a key short-term ceiling.
Demand Zone: Deep support between $50-$57K, aligns with trendline and historical value area.
🔵 Fair Value Gaps (FVGs)
1D FVG: $97K area — may act as magnet if price breaks below resistance.
1W FVG: $87K–$93K — stronger structural level to watch.
If both are filled, price may meet the bullish trendline around $90K.
🧠 Liquidity Zones
Above current price: ~$112K is marked as a liquidity grab area — stop hunts may occur before major reversal.
Below: FVG zones could trigger a liquidity sweep downwards before reversal.
🔴 Volume Profile
Strong high-volume node (HVN) around $80K–$97K: acceptance zone, likely to act as magnetic support.
Above $110K is a low-volume node (LVN): if broken cleanly, price may accelerate quickly toward $120K+.
✅ Bullish Scenario
Break above $112K → sweep liquidity → continuation toward $120K–$125K. (Price Discovery)
OBV breakout upwards would confirm.
Hold above FVG 1D if retested = healthy bullish continuation structure.
❌ Bearish Scenario
Rejection at supply → drop to FVG 1D ($97K), then potentially Weekly FVG (~$93K).
If OBV breaks downward, it confirms bearish volume divergence.
Breakdown below trendline could target deeper into demand zone (~$70K+).
📌 Summary
Bias: Neutral-bullish short term, bullish macro (above trendline).
Key Breakout Level: $112K.
Critical Support: $91K–$97K (FVG cluster).
Confirmation: OBV breakout + clean structure break.
Invalidation: Weekly close below long-term trendline and FVG zones.
Longterm

Pending Gap On Weekly Timefram, Buy Or Sell ? #defense #bdlIn this chart bdl is is going to fill the gap it made on weekly timeframe to collect more liquidity to bounce back up side. what should you do, buy or sell ? #bdl #defensestock #cochinship

Htf Levels for gold In this video I look at the Higher term timeframe and mark what I consider to be 2 relevant levels looking forward for the month of June .
At the present we are sitting in the middle of the range but at some point we will break out or down from that range and the levels I have highlighted may be of guidance for gold traders.
In this video I use the Trend based Fib Extension, Tr pocket , vwap and standard fibs.

sand buy spot "🌟 Welcome to Golden Candle! 🌟
We're a team of 📈 passionate traders 📉 who love sharing our 🔍 technical analysis insights 🔎 with the TradingView community. 🌎
Our goal is to provide 💡 valuable perspectives 💡 on market trends and patterns, but 🚫 please note that our analyses are not intended as buy or sell recommendations. 🚫
Instead, they reflect our own 💭 personal attitudes and thoughts. 💭
Follow along and 📚 learn 📚 from our analyses! 📊💡"

Delta Airlines - Long Term FlyerHey, all. Pretty intense idea here, but I am a buyer of NYSE:DAL at these levels. Obviously, the chart looks awful from a recent performance perspective. However, if you take a long term view, we could actually be rebalancing after an initial range expansion to the upside. Just like NASDAQ:RIVN , airlines are/have been a pretty brutal investment. I guess I have a thing for pain. Ha.
I am certainly a believer that airlines are undervalued here and can reverse back to the upside. Of course, it goes against the current narrative that the economy is showing signs of weakness. But I am just willing to take the risk on this one. I believe the consumer and culture shift in the US to have more experiences in life will continue to hold.
Are we going to come in for a hard landing, or take off to cruising altitude? We'll see what kind of lift the market will give us. Right now the turbulence is pretty intense.

USDCHF: weekly overviewHello Traders,
In long-term, we anticipate a bearish move to 0.76500 for this pair. but for this week, our most important zone is the 0.81911
**********************************************************
The indicated levels are determined based on the most reaction points and the assumption of approximately equal distance between the zones.
Some of these points can also be confirmed by the mathematical intervals of Murray.
You can enter with/without confirmation. IF you want to take confirmation you can use LTF analysis, Spike move confirmation, Trend Strength confirmation and ETC.
SL could be placed below the zone or regarding the LTF swings.
TP is the next zone or the nearest moving S&R, which are median and borders of the drawn channels.
*******************************************************************
Role of different zones:
GREEN: Just long trades allowed on them.
RED: Just Short trades allowed on them.
BLUE: both long and short trades allowed on them.
WHITE: No trades allowed on them! just use them as TP points

Warren Buffett's Approach to Long-Term Wealth BuildingUnderstanding Value Investing: Warren Buffett's Educational Approach to Long-Term Wealth Building
Learn the educational principles behind value investing and dollar-cost averaging strategies, based on historical market data and Warren Buffett's documented investment philosophy.
---
Introduction: The Million-Dollar Question Every Investor Asks
Warren Buffett—the Oracle of Omaha—has consistently advocated that index fund investing provides a simple, educational approach to long-term wealth building for most investors.
His famous 2007 bet against hedge funds proved this principle in dramatic fashion: Buffett wagered $1 million that a basic S&P 500 index fund would outperform a collection of hedge funds over 10 years. He crushed them. The S&P 500 returned 7.1% annually while the hedge funds averaged just 2.2%.
Today, we'll explore the educational principles behind this approach—examining historical data, mathematical concepts, and implementation strategies for learning purposes.
---
Part 1: Understanding Value Investing for Modern Markets
Value investing isn't about finding the next GameStop or Tesla. It's about buying quality assets at attractive prices and holding them for compound growth .
For beginners, this translates to:
Broad Market Exposure: Own a cross-section of businesses through low-cost index funds
Long-term Perspective: Think decades, not months
Disciplined Approach: Systematic investing regardless of market noise
"Time is the friend of the wonderful business, the enemy of the mediocre." - Warren Buffett
Real-World Application:
Instead of trying to pick between NASDAQ:AAPL , NASDAQ:MSFT , or NASDAQ:GOOGL , you simply buy AMEX:SPY (SPDR S&P 500 ETF) and own pieces of all 500 companies automatically.
---
Part 2: Dollar-Cost Averaging - Your Secret Weapon Against Market Timing
The Problem: Everyone tries to time the market. Studies show that even professional investors get this wrong 70% of the time.
The Solution: Dollar-Cost Averaging (DCA) eliminates timing risk entirely.
How DCA Works:
Decide on your total investment amount (e.g., $24,000)
Split it into equal parts (e.g., 12 months = $2,000/month)
Invest the same amount on the same day each month
Ignore market fluctuations completely
DCA in Action - Real Example:
Let's say you started DCA into AMEX:SPY in January 2022 (right before the bear market):
January 2022: AMEX:SPY at $450 → You buy $1,000 worth (2.22 shares)
June 2022: AMEX:SPY at $380 → You buy $1,000 worth (2.63 shares)
December 2022: AMEX:SPY at $385 → You buy $1,000 worth (2.60 shares)
Result: Your average cost per share was $405, significantly better than the $450 you would have paid with a lump sum in January.
---
Part 3: The Mathematics of Wealth Creation
Here's where value investing gets exciting. Let's run the actual numbers using historical S&P 500 returns:
Historical Performance:
- Average Annual Return: 10.3% (1957-2023)
- Inflation-Adjusted: ~6-7% real returns
- Conservative Estimate: 8% for planning purposes
Scenario 1: The $24K Start
Initial Investment: $24,000 | Annual Addition: $2,400 | Return: 8%
Calculation Summary:
- Initial Investment: $24,000
- Annual Contribution: $2,400 ($200/month)
- Expected Return: 8%
- Time Period: 20 years
Results:
- Year 10 Balance: $86,581
- Year 20 Balance: $221,692
- Total Contributed: $72,000
- Investment Gains: $149,692
Scenario 2: The Aggressive Investor
Initial Investment: $60,000 | Annual Addition: $6,000 | Return: 10%
Historical example after 20 years: $747,300
- Total Contributed: $180,000
- Calculated Investment Gains: $567,300
Educational Insight on Compound Returns:
This historical example illustrates how 2% higher returns (10% vs 8%) could dramatically impact long-term outcomes. This is why even small differences in return rates can create life-changing wealth over decades. The mathematics of compound growth are both simple and incredibly powerful.
---
Part 4: Investing vs. Savings - The Shocking Truth
Let's compare the same contributions invested in stocks vs. a high-yield savings account:
20-Year Comparison:
- Stock Investment (8% return): $221,692
- High-Yield Savings (5% return): $143,037
- Difference: $78,655 (55% more wealth!)
"Compound interest is the eighth wonder of the world. He who understands it, earns it... he who doesn't, pays it." - Often attributed to Einstein
Key Insight: That extra 3% annual return created an additional $78,655 over 20 years. Over 30-40 years, this difference becomes truly life-changing.
📍 Global Savings Reality - The Investment Advantage Worldwide:
The power of index fund investing becomes even more dramatic when we examine savings rates around the world. Here's how the same $24K initial + $2,400 annual investment compares globally:
🇯🇵 Japan (0.5% savings):
- Stock Investment: $221,692
- Savings Account: $76,868
- Advantage: $144,824 (188% more wealth)
🇪🇺 Western Europe Average (3% savings):
- Stock Investment: $221,692
- Savings Account: $107,834
- Advantage: $113,858 (106% more wealth)
🇬🇷 Greece/Southern Europe (2% savings):
- Stock Investment: $221,692
- Savings Account: $93,975
- Advantage: $127,717 (136% more wealth)
🇰🇷 South Korea (2.5% savings):
- Stock Investment: $221,692
- Savings Account: $100,634
- Advantage: $121,058 (120% more wealth)
💡 The Global Lesson:
The lower your country's savings rates, the MORE dramatic the advantage of global index fund investing becomes. For investors in countries with minimal savings returns, staying in cash is essentially guaranteed wealth destruction when compared to broad market investing.
This is exactly why Warren Buffett's advice transcends borders - mathematical principles of compound growth work the same whether you're in New York, London, or Athens.
Note: Savings rates shown are approximate regional averages and may vary by institution and current market conditions. Always check current rates in your specific market for precise calculations.
---
Part 5: Building Your Value Investing Portfolio
Core Holdings (80% of portfolio):
AMEX:SPY - S&P 500 ETF (Large-cap US stocks)
AMEX:VTI - Total Stock Market ETF (Broader US exposure)
LSE:VUAA - S&P 500 UCITS Accumulating (Tax-efficient for international investors)
Satellite Holdings (20% of portfolio):
NASDAQ:QQQ - Technology-focused (Higher growth potential)
AMEX:VYM - Dividend-focused (Income generation)
NYSE:BRK.B - Berkshire Hathaway (Value investing & diversification)
---
Part 6: Implementation Strategy - Your Action Plan
Month 1: Foundation
Open a brokerage account (research low-cost brokers available in your region)
Set up automatic transfers from your bank
Buy your first AMEX:SPY shares
💡 Broker Selection Considerations:
Traditional Brokers: Interactive Brokers, Fidelity, Vanguard, Schwab
Digital Platforms: Revolut, Trading 212, eToro (check availability in your country)
Key Factors: Low fees, ETF access, automatic investing features, regulatory protection
Research: Compare costs and features for your specific location/needs
Month 2-12: Execution
Invest the same amount on the same day each month
Ignore market news and volatility
Track your progress in a simple spreadsheet
Year 2+: Optimization
Increase contributions with salary increases
Consider additional core holdings like LSE:VUAA for tax efficiency
Consider tax-loss harvesting opportunities
Visualizing Your DCA Strategy
Understanding DCA concepts is easier when you can visualize the results. TradingView offers various tools to help you understand investment strategies, including DCA tracking indicators like the DCA Investment Tracker Pro which help visualize long-term investment concepts.
🎯 Key Visualization Features:
These types of tools typically help visualize:
Historical Analysis: How your strategy would have performed using real market data
Growth Projections: Educational scenarios showing potential long-term outcomes
Performance Comparison: Comparing actual vs theoretical DCA performance
Volatility Understanding: How different stocks behave with DCA over time
📊 Real-World Examples from Live Users:
Stable Index Investing Success:
AMEX:SPY (S&P 500) Example: $60K initial + $500/month starting 2020. The indicator shows SPY's historical 10%+ returns, demonstrating how consistent broad market investing builds wealth over time. Notice the smooth theoretical growth line vs actual performance tracking.
Value Investing Approach:
NYSE:BRK.B (Berkshire Hathaway): Warren Buffett's legendary performance through DCA lens. The indicator demonstrates how quality value companies compound wealth over decades. Lower volatility = standard CAGR calculations used.
High-Volatility Stock Management:
NASDAQ:NVDA (NVIDIA): Shows smart volatility detection in action. NVIDIA's explosive AI boom creates extreme years that trigger automatic switch to "Median (High Vol): 50%" calculations for conservative projections, protecting against unrealistic future estimates.
Tech Stock Long-Term Analysis:
NASDAQ:META (Meta Platforms): Despite being a tech stock and experiencing the 2022 crash, META's 10-year history shows consistent enough performance (23.98% CAGR) that volatility detection doesn't trigger. Standard CAGR calculations demonstrate stable long-term growth.
⚡ Educational Application:
When using visualization tools on TradingView:
Select Your Asset: Choose the stock/ETF you want to analyze (like AMEX:SPY )
Input Parameters: Enter your investment amounts and time periods
Study Historical Data: See how your strategy would have performed in real markets
Understand Projections: Learn from educational growth scenarios
🎓 Educational Benefits:
This tool helps you understand:
- How compound growth actually works in real markets
- The difference between volatile and stable investment returns
- Why consistent DCA often outperforms timing strategies
- How your current performance compares to historical market patterns
- The visual power of long-term wealth building
As Warren Buffett said: "Someone's sitting in the shade today because someone planted a tree a long time ago." This tool helps you visualize your financial tree growing over time through actual market data and educational projections.
---
Part 7: Common Mistakes to Avoid
The "Perfect Timing" Trap
Waiting for the "perfect" entry point often means missing years of compound growth. Time in the market beats timing the market.
The "Hot Stock" Temptation
Chasing individual stocks like NASDAQ:NVDA or NASDAQ:TSLA might seem exciting, but it introduces unnecessary risk for beginners.
The "Market Crash" Panic
Every bear market feels like "this time is different." Historical data shows that patient investors who continued their DCA through 2008, 2020, and other crashes were handsomely rewarded.
---
Conclusion: Your Path to Financial Freedom
Value investing through broad index funds and dollar-cost averaging isn't glamorous. You won't get rich overnight, and you won't have exciting stories about your latest trade.
But here's what you will have:
Proven strategy backed by decades of data
Peace of mind during market volatility
Compound growth working in your favor 24/7
A realistic path to serious wealth creation
The Bottom Line: Warren Buffett's approach works because it's simple, sustainable, and based on fundamental economic principles. Start today, stay consistent, and let compound growth do the heavy lifting.
"Someone's sitting in the shade today because someone planted a tree a long time ago." - Warren Buffett
Educational Summary:
Understanding these principles provides a foundation for informed decision-making. As Warren Buffett noted: "The best time to plant a tree was 20 years ago. The second-best time is now" - emphasizing the educational value of understanding long-term investment principles early.
---
🙏 Personal Note & Acknowledgment
This article was not entirely my own work, but the result of artificial intelligence in-depth research and information gathering. I fine-tuned and brought it to my own vision and ideas. While working with AI, I found this research so valuable for myself that I could not avoid sharing it with all of you.
I hope this perspective gives you a different approach to long-term investing. It completely changed my style of thinking and my approach to the markets. As a father of 3 kids, I'm always seeking the best investment strategies for our future. While I was aware of the power of compound interest, I could never truly visualize its actual power.
That's exactly why I also created the open-source DCA Investment Tracker Pro indicator - so everyone can see and visualize the benefits of choosing a long, steady investment approach. Being able to see compound growth in action makes all the difference in staying committed to a strategy.
As someone truly said: compound interest is the 8th wonder of the world.
---
Disclaimer: This article is for educational purposes only and does not constitute financial advice. Past performance does not guarantee future results. Always consult with a qualified financial advisor before making investment decisions.

Jindal stainless ltdJindal Stainless Ltd has been forming higher lows and has now broken through the key resistance level at 660. With this congestion breakout, the stock signals a continued bullish move, potentially heading towards the target of 740.
Please conduct your own technical analysis and apply proper risk management before taking any trade. This is solely my personal view.
#jsl #bestbreakout #uptrend #longteam

Good Stock for Medium to Long TermClosed at 181.52 (05-06-2025)
Printed HH on Daily tf.
Should retrace towards 177 - 178
& then may be around 165 -166 to print
HL.
188 - 195 is the resistance for now that
needs to be sustained.
Crossing this may move the price towards
235 - 236.
Medium to Long term target can be around
290 - 300 if 260 is crossed with Good Volumes.

JNJ - Macro View 🌐Hello TradingView Family / Fellow Traders. This is Richard, also known as theSignalyst.
📈 JNJ has exhibited an overall bullish trend, trading within the ascending wedge pattern outlined in blue. It is presently nearing the lower boundary/blue trendline.
At present, JNJ is undergoing a correction phase and is trading within the descending red channel. It is currently approaching the lower limit and a highlighted demand zone in green.
🏹 Thus, the highlighted purple circle is a strong area to look for buy setups as it is the intersection of the green demand and lower blue and red trendlines acting as a non-horizontal support.
📚 As per my trading style:
As JNJ approaches the lower purple circle zone, I will be looking for bullish reversal setups (like a double bottom pattern, trendline break , and so on...)
📚 Always follow your trading plan regarding entry, risk management, and trade management.
Good luck!
All Strategies Are Good; If Managed Properly!
~Rich

ebay is on sale 🛒Hello TradingView Family / Fellow Traders. This is Richard, also known as theSignalyst.
📈 EBAY has exhibited an overall bullish trend , trading above the orange and blue trendlines.
At present, EBAY is undergoing a correction phase and it is currently approaching a strong support zone 30 - 34
🏹 Thus, the highlighted red circle is a strong area to look for buy setups as it is the intersection of the green support and lower blue and orange trendlines acting as a non-horizontal support.
📚 As per my trading style:
As #EBAY approaches the lower red circle zone, I will be looking for bullish reversal setups (like a double bottom pattern, trendline break , and so on...)
📚 Always follow your trading plan regarding entry, risk management, and trade management.
Good luck!
All Strategies Are Good; If Managed Properly!
~Rich

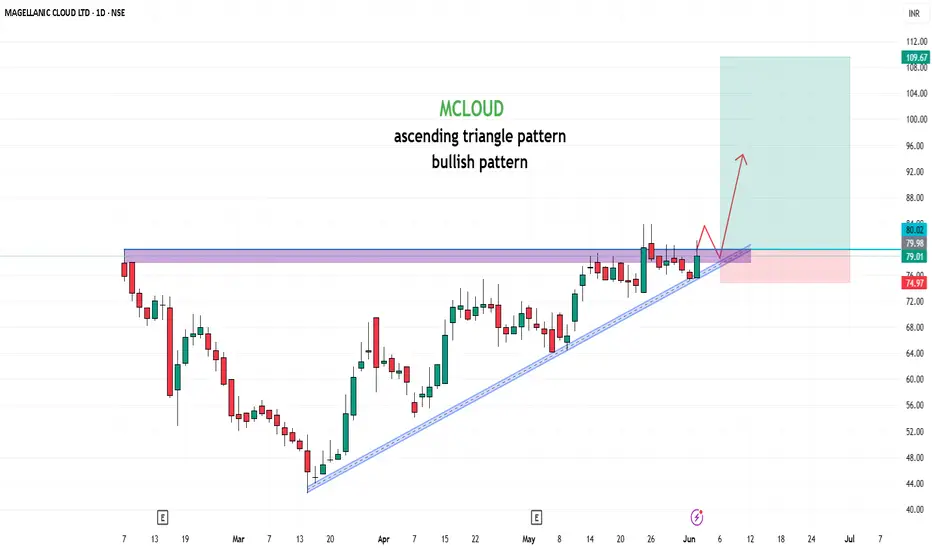
MCLOUD📊 Stock Analysis: MCLOUD
The stock has been consolidating within a ascending triangle pattern and is nearing a critical Buy Above level at ₹80 , signaling a potential breakout. The target is set at ₹179, offering a potential gain of 123.75%. Key insights:
Trend: A breakout above the wedge could indicate renewed bullish momentum.
Support Levels: Strong support around ₹75 , making this a low-risk entry point.
Volume Buzz: The recent increase in volume shows rising investor interest.
🔔 Keep an eye on this setup! Always analyze your risk tolerance before making any decisions.
📢 Disclaimer: This post is for educational purposes and not financial advice. Conduct your research or consult a financial advisor before investing.
What are your thoughts? Share them below! 📝
#StockTrading #TechnicalAnalysis #BreakoutTrading #MCLOUD
MSTR - The Saylor in the Storm!Hello TradingView Family / Fellow Traders. This is Richard, also known as theSignalyst.
📈MSTR has been overall bullish trading within the rising channel marked in blue. (log chart)
Currently, it is in a correction phase within the falling red channel.
Moreover, the red zone is a strong demand.
🏹 Thus, the highlighted blue circle is a strong area to look for buy setups as it is the intersection of demand and lower trendlines acting as non-horizontal support.
📚 As per my trading style:
As #MSTR approaches the blue circle, I will be looking for bullish reversal setups (like a double bottom pattern, trendline break , and so on...)
📚 Always follow your trading plan regarding entry, risk management, and trade management.
Good luck!
All Strategies Are Good; If Managed Properly!
~Rich

$GALA Holding Support – Breakout Coming?INDEX:GALA is holding strong above the trendline support and showing signs of a bounce.
The price is now approaching a key descending trendline a breakout here could lead to a solid move toward $0.021–$0.026 📈
As long as it stays above the trendline, bulls are in control.
#GALA #ALTSEASON

Bulls pressure, gold price grows 3409⭐️GOLDEN INFORMATION:
Gold prices rallied sharply on Monday, reaching their highest level in over four weeks, as geopolitical risks escalated over the Russia-Ukraine conflict. Renewed tensions on trade between the United States (US) and China prompted investors to buy the yellow metal throughout the day. At the time of writing, XAU/USD trades at $3,377, up by 2.70%.
Market sentiment shifted sour as news broke that Ukraine staged an aerial attack on Russia, which destroyed long-range bombers and other aircraft. Meanwhile, US President Donald Trump doubled down on tariffs over steel and aluminum imports to 50%, effective June 4, and rhetoric against China sent US global equities lower.
CNBC reported that Trump and China’s President Xi Jinping could speak this week, but not on Monday.
⭐️Personal comments NOVA:
Gold prices maintained their upward momentum at the beginning of the week, tariff tensions and the war with Russia remain unpredictable. Gold prices supported to return to the 3400 zone.
⭐️SET UP GOLD PRICE:
🔥SELL GOLD zone : 3409- 3411 SL 3416
TP1: $3400
TP2: $3388
TP3: $3372
🔥BUY GOLD zone: $3313- $3315 SL $3308
TP1: $3327
TP2: $3340
TP3: $3355
⭐️Technical analysis:
Based on technical indicators EMA 34, EMA89 and support resistance areas to set up a reasonable BUY order.
⭐️NOTE:
Note: Nova wishes traders to manage their capital well
- take the number of lots that match your capital
- Takeprofit equal to 4-6% of capital account
- Stoplose equal to 2-3% of capital account

AMARAJARAJA#AMARAJARAJA, #EnergyStocks, #Bullish, #BreakoutRetest, #TechnicalAnalysis, #NSE
ARE&M
Amara Raja Energy & Mobility Ltd (AMARAJARAJA) is currently retesting a key Support zone around ₹950,
After a solid upward move, the price is pulling back in a healthy manner, forming a textbook bullish retest pattern. This setup often precedes a continuation of the prevailing trend.
Why I'm Bullish:
🔹 Price retesting former resistance turned support at ₹950
🔹 Bullish market structure remains intact
🔹 Monthly bullish pin bar candle
🔹 Volume tapering on pullback – a bullish sign of consolidation
Key Levels:
🔹 Support (Retest Zone): ₹950
🔹 Major Resistance / Target: ₹1775.95
⚠️ Disclaimer:
This idea is for educational purposes only and does not constitute financial advice. Please do your own research and consult a qualified advisor before making any trading or investment decisions.
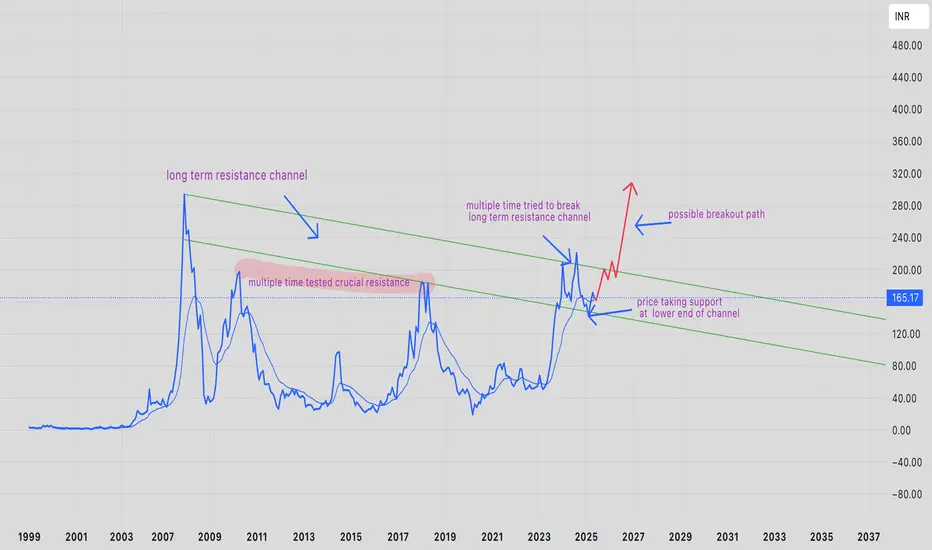
High chance of PRAKASH-EQ to break ATH and make new highPRAKASH-EQ has traded in range for about 14 years ( from 2010 high to recent 2024 high ). This time the breakout is different because price has managed to break and trade above its crucial resistance zone.
currently price of PRAKASH-EQ has taken support at the lower end of its long term resistance channel and there is high chance of price breaking its all time high.
as and when price reaches near the upper band of its long term resistance band, it is expected to have a sudden and fast momemtum which will be volume supported.
right now price is in value zone (for people planning for momentum breakout) but it is advised to carry this for the next 1-3 years to reap the benefits of compounding
as always people are advised to trade as per their risk capacity.
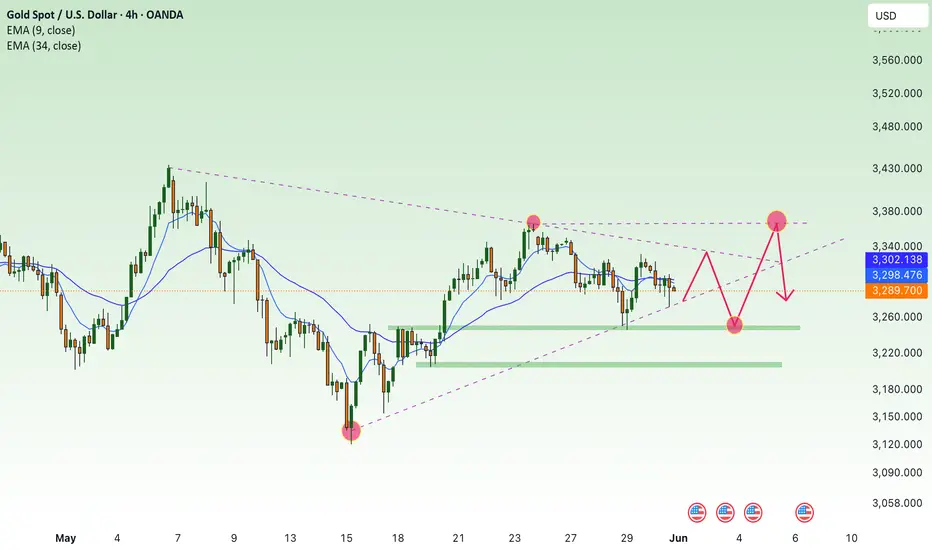
Continue to maintain stability above 3300, next week✍️ NOVA hello everyone, Let's comment on gold price next week from 06/02/2025 - 06/06/2025
🔥 World situation:
Gold prices declined on Friday, pressured by a rebound in the US Dollar, even as US Treasury yields dipped in response to a robust inflation report. Despite the yield pullback, expectations remain firm that the Federal Reserve could begin easing policy in 2025. At the time of writing, XAU/USD is down 0.83%, trading around $3,289.
Market sentiment turned more risk-averse after US President Donald Trump sharply criticized China, accusing Beijing of breaching the trade agreement reached during talks in Switzerland. In a post, Trump wrote, “China, perhaps not surprisingly to some, HAS TOTALLY VIOLATED ITS AGREEMENT WITH US. So much for being Mr. NICE GUY!”—a statement that reignited geopolitical tensions and added to market uncertainty.
🔥 Identify:
Gold price is in great competition between buyers and sellers around the price range of 3200 - 3300. Tariff policies are coming back, the trump administration is putting pressure to get favorable tariffs.
🔥 Technically:
Based on the resistance and support areas of the gold price according to the H4 frame, NOVA identifies the important key areas as follows:
Resistance: $3332, $3365
Support: $3244, $3204
🔥 NOTE:
Note: Nova wishes traders to manage their capital well
- take the number of lots that match your capital
- Takeprofit equal to 4-6% of capital account
- Stoplose equal to 2-3% of capital account
- The winner is the one who sticks with the market the longest
MOSCHIP📊 Stock Analysis: MOSCHIP
The stock has been consolidating within a ascending triangle pattern and is nearing a critical Buy Above level at ₹187 , signaling a potential breakout. The target is set at ₹359, offering a potential gain of 25.90%. Key insights:
Trend: A breakout above the wedge could indicate renewed bullish momentum.
Support Levels: Strong support around ₹170/197, making this a low-risk entry point.
Volume Buzz: The recent increase in volume shows rising investor interest.
🔔 Keep an eye on this setup! Always analyze your risk tolerance before making any decisions.
📢 Disclaimer: This post is for educational purposes and not financial advice. Conduct your research or consult a financial advisor before investing.
What are your thoughts? Share them below! 📝
#StockTrading #TechnicalAnalysis #BreakoutTrading #MOSCHIP

$BUSDT Ready to Explode? Breakout Could Send It Flying#BUSDT is demonstrating strong potential for a pennant breakout.
A successful breakout could trigger a +60% bullish rally in the coming days. 🚀
#Altseason2025

BTC breakout soon and return to ATH💎 Update Plan BTC (May 29)
Notable news about BTC:
The overall cryptocurrency market capitalization has remained relatively stable over the past 24 hours, hovering near the $3.42 trillion level. Digital assets appear largely indifferent to the recent rally in equities, as gains in traditional markets are driven by corporate earnings and tariff-related developments rather than shifts in monetary policy or liquidity conditions. Meanwhile, the US Dollar is strengthening for a third consecutive session, adding further pressure.
Bitcoin (BTC) has pulled back from the upper end of its recent trading range near $110,000, settling closer to the $107,000 mark. This pause near previous highs has helped ease short-term market overheating. As institutional participation in Bitcoin deepens, its price behavior is increasingly mirroring that of traditional financial instruments like equities and commodities—marked by more tempered momentum and fewer fear-driven surges.
Technical analysis angle
It is still a 107k bumper area that brings profits to Buyer. But the worrying thing here is that the vertices of BTC are lower.
We will have two scenarios for BTC:
) First within the next 1 week, the organizers still go in this flag model and gradually narrow towards the top. If the price line follows this model, it will be negative for BTC and investors
) Secondly: BTC price will breakout area 109k, the target will go straight to 113k-115k and lower boundary if Breakout area 107k will return to 102k-100k
🔥BTC 4H is currently in the adjustment phase, this time will cause a lot of traders, Future - Margin to lose money, this rhythm will last long
At this time, whether new or old, should spend more time to practice, load more knowledge about the PTKT, as well as find knowledge posts at the channel ..., to strengthen the solid foundation, as well as avoid losing money at this time offline
==> Comments for trend reference. Wishing investors successfully trading

BTCUSDT LONG - TRADING PLANBTC Making a ABCD Pattern and follow the Trend Line it mate break the trend line but we have to focus on High High and High Low. My Entry is on pervious HH and my TP is D Point. I hope you Get this Trade. Thank you

IBM: Bullish AttemptsIBM has made progress in our scenario: Currently, the price is rising above the crucial resistance at $265.72; clearly surpassing this mark is important in the ongoing wave (3) in magenta. While we cannot entirely remove our alternative scenario with a new low for wave alt. in green, it still holds a 33% probability. We primarily expect that the regular wave in green was already completed at $211.52 and are therefore preparing for a direct continuation of the increases in the broader wave in green.
📈 Over 190 precise analyses, clear entry points, and defined Target Zones - that's what we do.
