WIF dogwifhat might want to waitWIF dogwifhat might want to wait on this one, it had a nice 70ish percent already.
This is a very popular meme coin on the Solana Network.
This is for ENTERTAINMENT purpose Only.
Not Financial Advise
Always DYOR ( do your own research )
Longterm

LDO - Following The Wedge 🌙Hello TradingView Family / Fellow Traders. This is Richard, also known as theSignalyst.
📈 LDO has been overall bullish, trading within the rising broadening wedge in blue.
At present, LDO is undergoing a correction phase and it is currently approaching the lower blue trendline acting as a non-horizontal support.
Moreover, it is retesting a strong support zone marked in green.
🏹 Thus, the highlighted purple circle is a strong area to look for buy setups as it is the intersection of the green support and lower blue trendline acting as a non-horizontal support.
📚 As per my trading style:
As #LDO approaches the lower purple circle zone, I will be looking for bullish reversal setups (like a double bottom pattern, trendline break , and so on...)
📚 Always follow your trading plan regarding entry, risk management, and trade management.
Good luck!
All Strategies Are Good; If Managed Properly!
~Rich

ADS with increased volume recentlyHere is my thought process on XETR:ADS alkimi , I see price with a higher probability of going lower before it goes up. Market Cap is only 9.4 M with increased volume recently.
The Alkimi Exchange is a decentralized advertising exchange built on the Constellation Network’s Hypergraph. Using the OpenRTB standards for programmatic advertising, Alkimi Exchange will host a media exchange auction in real-time on the Hypergraph by developing a hosted state channel, AlEx.
Not Financial Advice - This is for Entertainment Purposes Only
Always DYOR ( do your own research )

ETH - TRIO RETEST 3️⃣Dear TradingView community and fellow traders,
I find the daily chart for ETH to be interesting as it appears to be forming one of my favorite patterns. What I call TRIO RETEST
Here is why the purple circle is a strong zone to keep an eye on:
1 => Overall Trend
ETH is bullish medium-term trading inside the rising broadening wedge in blue and now approaching the lower blue bound / trendline acting as a non-horizontal support.
2 => Demand Zone
The green zone at 2250.0 is a strong demand.
3 => Oversold Zone
ETH is bearish short-term trading inside the falling channel in red and now approaching the lower red trendline which I consider an oversold zone.
As per my trading style:
As ETH approaches the purple circle zone, I will be looking for bullish reversal setups (like a double bottom pattern, trendline break, and so on...)
📚 Hope you find this post useful. It's important to always adhere to your trading plan, including entry points, risk management strategies, and trade management techniques.
All Strategies Are Good; If Managed Properly!
~Richard
Disclaimer: The information provided is for educational and informational purposes only and should not be considered as financial advice. It is important to do your own research and make informed decisions before entering any trades. Past performance is not indicative of future results. Always be aware of the potential for losses, and never risk more than you can afford to lose.

AUDCHF - Wait For The Bears 🐻Hello TradingView Family / Fellow Traders,
On Daily: Left Chart
AUDCHF is retesting a strong resistance zone so we will be looking for sell setups on lower timeframes.
On H1: Right Chart
📈 For the bears to take over, we need a momentum candle close below the last major lower in gray.
📉 Meanwhile , AUDCHF would be bullish, and can still trade higher inside the resistance or even break it higher.
📚 Always follow your trading plan regarding entry, risk management, and trade management.
Good luck!
All Strategies Are Good; If Managed Properly!
~Richard Nasr


CRV/USDT Long Retest 0.54$✅🔥I bought CRV/USDT from $0.54 in the spot wallet. It certainly won't hurt if you buy it long-term. 2024 is expected to have many innovations in Crypto industries. The selling plan is basically no worse than $0.82 or $1.00

Is this the start of bull run in IRFC?Irfc was consolidating right from its listing in 2021. However, few months back, it gave a huge breakout from its supply zone of 25 to go upto 37 levels.
It has recently given a retest of same level and going up to test the levels of 37 again.
If 37.1 is broken, a higher high, higher low trend can be confirmed on weekly basis and it will indicate that a bull run might finally start in IRFC.
Definitely, a safe bet for long term considering the huge developments taking place in railway field.

SasanSeifi 💁♂️ Potential Upward Trend in the Long TermHello there! 😊
In this analysis, we will look at the Dogecoin chart in the 3-day timeframe. As you can see, the price has been on an upward trend from the 0.057 range and then after a growth of almost 85% from the 0.10 liquidity range, it has faced a correction and is currently trading in a range of 0.079.
I expect that the price, after ranging or correcting, will continue to grow if it maintains the important support levels of 0.072/0.065. In the long term, the price could reach the 0.10/0.12 range.
🔵Remember, always conduct your analysis and consider other factors before making any trading decisions. Good luck!"✌️
❎ (DYOR)...⚠️⚜️
Sure, if you have any more questions or need further clarification, feel free to ask. I'm here to help!
if you found my analysis helpful, I would appreciate it if you could show your support by liking and commenting. Thank you!🙌

$Bitcoin for Q1,Q2 and Q3 | Fractal |Hi fam,
Following our previous analysis about CRYPTOCAP:BTC and my clear thought on seeing Q1 a Red one i want to add a fresh view about previous fractals that has the possibility of recurring in coming months.
So here it goes,
a premature top or local top creates at 0.618 fib level of correction wave. Dec 2017 correction wave started from 20k to 3k and bounced. the best guess about how much did it bounce? fib. 0.618 is the answer.
So fib. 0.618 created out premature top before halving event around 13.8 k. the price printed the next low at fib. 0.618 and then my personal fib. level at 0.869 of the last impulse wave as an ABC correction. this was the max pain right before the main move starts from 3k to 69k.
the correction wave duration was 260 days.
-----------
This cycle we saw market top at 69k and correction wave ended at 15.5k (i shared this bottom many weeks before it happen in my ideas).
if we expect to see the last fractal happen again then price must bounce from 15.5k about fib. 0.618. it is what exactly happened. price bounced to 48.5k which matches fib. 0.618 of the last correction wave.
So far it repeated the last fractal by notable accuracy.
-----------
what to expect next?
if we consider 48.5k our new premature top before halving then the correction to levels of 0.618 and my level at 0.869 will give us these numbers:
26.6k and 19.3.k.
-----------
I expect to see price at these levels in coming weeks and months.
Q1 as i said before will most likely to be Red.
Q2 will most likely to be Green with a "B" wave from 26k to 40k.
Q3 will be Res again to show the max pain down to 19k.
Q4 will be mind blowing Green again.
-----------
These are my personal thoughts and might be wrong. Always DYOR.
Cheers!

XRP - Wait For It 🏹Hello TradingView Family / Fellow Traders,
XRP has been overall bearish trading inside the falling channel in red.
However it is currently approaching the lower bound of the channel and a strong support at 0.54.
📈 As long as the support holds, we will be looking for short-term buy setups on lower timeframes.
🏹 For the bulls to take over from a medium-term perspective, we need a break above the last major high at 0.625.
📉 If the 0.54 support is broken downward, we will expect further bearish movement till the 0.5 support where we will be looking for new short-term buy setups.
📚 Always follow your trading plan regarding entry, risk management, and trade management.
Good luck!
All Strategies Are Good; If Managed Properly!
~Richard Nasr

NKE - Just Do It ✔️Hello TradingView Family / Fellow Traders,
On Weekly: Left Chart
NKE has been hovering inside a range in the shape of a symmetrical triangle.
Moreover, it is currently sitting around a strong round number 100.0
🏹 Hence , as long as the 100.0 support holds, we will be looking for buy setups on lower timeframes.
On Daily: Right Chart
📈 For the bulls to take over, we need a momentum candle close above the last major high in green at 107.0
📉 Meanwhile , NKE would be bearish, and if the 100.0 support is broken downward, we can expect a bearish continuation towards the lower weekly trendline where we will be looking for new buy setups.
📚 Always follow your trading plan regarding entry, risk management, and trade management.
Good luck!
All Strategies Are Good; If Managed Properly!
~Richard Nasr

EURJPY Longer term shorting opportunityAs per the video entries around now or next week looking to hold on to the short for a while stops where you're comfortable but great risk reward.

BTC - Top-Down Analysis 📹 from Weekly to H4Hello TradingView Family / Fellow Traders. This is Richard, also known as theSignalyst.
📈 Here is a detailed update top-down analysis for #BTC.
Which scenario do you think is more likely to happen? and Why?
📚Always follow your trading plan regarding entry, risk management, and trade management.
Good Luck!.
All Strategies Are Good; If Managed Properly!
~Rich

Bitcoin Retest Long more and Short 39000$🔥We can see the price of Bitcoin going up now. $44,200 is the highest resistance at Fibo 0.50, and the main action is Bitcoin price decline. On the big time unit, Fibo 0.382 is the first resistance at $39,000.

Rising Star in Insurance: Kingstone Companies, Inc.Kingstone Companies, Inc. (NASDAQ: KINS), an insurance company offering policies to small and mid-sized businesses and individuals, has experienced a notable increase in its stock price over the past year. The company's stock has soared by 27% in the last three months and climbed 55% in the last year. Despite this surge, it's important to consider various aspects of the company's performance and market position before making investment decisions.
Kingstone Companies operates in a competitive insurance industry and faces competition from several companies. However, it has managed to maintain a competitive position in the market. The company's profitability rank is moderate, with ROE, ROA, and ROIC figures suggesting profitability lower than the industry average. Nonetheless, the company has remained profitable for 7 out of the past 10 years.
The company's growth rank also indicates a moderate growth rate, with a mixed record in terms of revenue and earnings per share growth over the past few years. This suggests that while the company has potential, its growth has been inconsistent.
Kingstone Companies recently transitioned from making a loss to reporting a profit, which is a positive sign. However, the modest dividend yield might not be a significant factor in supporting the stock price. When evaluating the company's potential for investment, it is crucial to look beyond just the recent surge in stock price and consider the overall financial health and future prospects of the company.
In conclusion, while Kingstone Companies Inc. has shown promising stock price performance recently, investors should carefully assess the company's financials, market position, and growth prospects before adding it to their portfolio. The recent increase in stock price could be an indicator of potential, but a thorough analysis of the company's overall performance and market dynamics is essential for making informed investment decisions.

$COIN COMPLETE ELLIOT WAVE ANALYSIS Observations indicate that NASDAQ:COIN is currently within the fifth wave of a broader wave C. Notably, yesterday saw a reversal from the 0.5 retracement level, signaling the completion of wave 4 and readiness for the forthcoming wave 5. It is customary for wave 1 and wave 5 to exhibit equality in length, a consequence of the extended wave 3. Anticipating this pattern, I project that wave 5 will reach the 3.618 extension, approximately at $315, thereby concluding both wave 5 and wave C in their entirety.

The Reversal is NEAR 🏹Hello TradingView Family / Fellow Traders. This is Richard, also known as theSignalyst.
📈 NEAR has exhibited an overall bullish trend , trading above the red trendlines zone.
At present, NEAR is undergoing a correction phase and it is currently approaching the red trendline acting as a non-horizontal support.
Moreover, it is retesting a strong demand zone marked in green.
🏹 Thus, the highlighted blue circle is a strong area to look for buy setups as it is the intersection of the green demand and lower red trendline acting as a non-horizontal support.
📚 As per my trading style:
As #NEAR approaches the lower blue circle zone, I will be looking for bullish reversal setups (like a double bottom pattern, trendline break , and so on...)
📚 Always follow your trading plan regarding entry, risk management, and trade management.
Good luck!
All Strategies Are Good; If Managed Properly!
~Rich

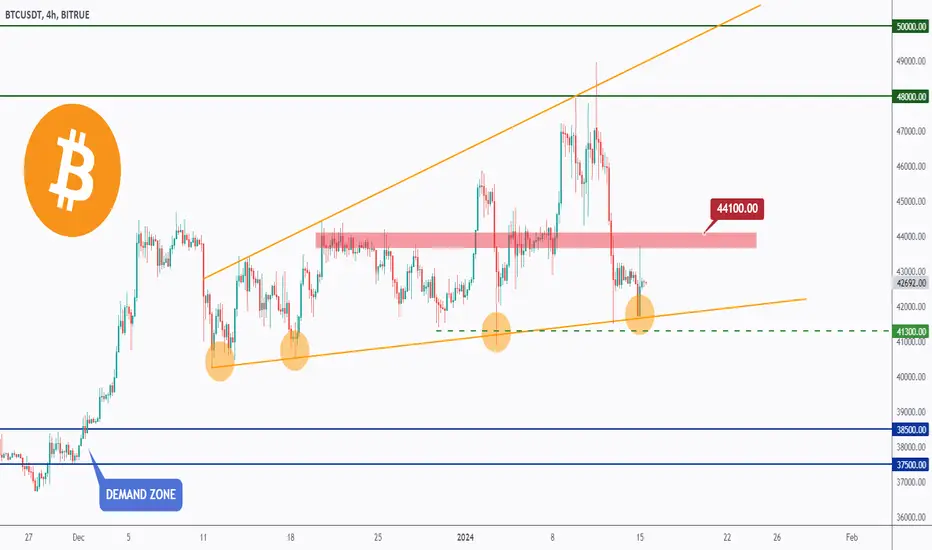
BTC - Short-Term Decision Zone 📈📉Hello TradingView Family / Fellow Traders,
After breaking below the 45,000 local support, BTC traded lower, and it is currently sitting around the lower bound of the orange flat wedge pattern.
Now, what's next?
As long as 41,300 holds, we will be looking for trend-following buy setups.
📈 For the bulls to take over, we need a momentum candle close above the 44,100 local resistance. In this case, a movement towards the 48,000 - 50,000 resistance zone would be expected.
📉 Alternatively, if 41,300 is broken downward , we expect further bearish movement towards the 38,500 demand zone.
Which scenario do you think is more likely to happen first, and why?
📚 Always follow your trading plan regarding entry, risk management, and trade management.
Good luck!
All Strategies Are Good; If Managed Properly!
~Richard Nasr
1INCH Retest Long Trade 🔥✅Once again we see ALT coins dominating the market right now. 1INCH 3D has started an upward movement in price with time. the first value of the total price is $0.618 and the second value is $0.70.

Bitcoin ETF Long vs Short🔥🔥🔥ETF got approved and price did... Nothing...
Just as I've said for months now, its the BAKKT futures hype all over again. Now crash it back down until halving April this year.
ETF news, but not even the slightest pump. Still up 55.000$ trading last few weeks. Dropping a huge short here again:

SasanSeifi 💁♂ ETC / 3DAY⏩ 28$Hey everyone,
As you can see in the 3-day timeframe, the price has been rising from the demand zone and bullish order block. It broke the downtrend line and retraced back to the 22-dollar price range. It is currently trading at 22.30 dollars.
In the medium term, the price may continue to rise to the BEARISH BB zone.
Here are two scenarios we can consider:
1 The price could rise from the 22-dollar range.
2 The price could range between 21 and 20 dollars for a while, and then rise to the target ranges of 27 and 28 dollars.
If the price rises, it will be important to see how it reacts to the BEARISH BB zone. This will help us to understand the continuation of the trend.
⭕On the other hand, if the price breaks below the 20-dollar range and consolidates, it may be facing a correction.
I hope this helps!
🔵Remember, always conduct your analysis and consider other factors before making any trading decisions. Good luck!"✌️
❎ (DYOR)...⚠️⚜️
Sure, if you have any more questions or need further clarification, feel free to ask. I'm here to help!
if you found my analysis helpful, I would appreciate it if you could show your support by liking and commenting. Thank you!🙌✌

2024 Crypto SUMMER is here! PRICE, TRENDS & FORECASTSIn this video we lay out our short and long-term forecast for the entirety of 2024 Crypto Summer and beyond. Also, we do a little review and take a look at how our forecast stacked up against the eventful 2023 Crypto Spring. As always please feel free to leave your thoughts and ideas in the comments and thanks for watching!
