Gold is still Strong; Long-Term!Hello TradingView Family / Fellow Traders. This is Richard, also known as theSignalyst.
📈GOLD has been overall bullish from a macro perspective trading within the rising wedge pattern in orange.
After rejecting the $3,500 round number and upper bound of the wedge, XAUUSD signaled the start of the correction phase.
Moreover, the $3,100 - $3,150 zone is a strong support.
🏹 Thus, the highlighted blue circle is a strong area to look for buy setups as it is the intersection of support and lower orange trendline acting non-horizontal support.
📚 As per my trading style:
As #XAUUSD approaches the blue circle zone, I will be looking for bullish reversal setups (like a double bottom pattern, trendline break , and so on...)
📚 Always follow your trading plan regarding entry, risk management, and trade management.
Good luck!
All Strategies Are Good; If Managed Properly!
~Rich
Disclosure: I am part of Trade Nation's Influencer program and receive a monthly fee for using their TradingView charts in my analysis.
Longterm

Novo Nordisk's The recent drop in Novo Nordisk's stock price is attributed to several factors. A key issue is the company’s struggle to meet the surging demand for its weight-loss drugs, such as Wegovy. Although demand remains strong, investors are concerned about Novo Nordisk's ability to scale up production and deliveries, which is creating downward pressure on the stock.
Additionally, some recent financial results failed to meet Wall Street expectations. Despite revenue growth in key product categories, overall revenues in some reports came in below forecasts. This underperformance has contributed to a negative investor sentiment.
However, analysts emphasize that Novo Nordisk's core products remain in high demand, and the company has significant long-term growth potential if it addresses its supply chain and production challenges

USDCHF Daily, H4,H1 Forecasts, Technical Analysis & Trading IdeaMidterm forecast:
0.84000 is a major resistance, while this level is not broken, the Midterm wave will be downtrend.
OANDA:USDCHF
Technical analysis:
A trough is formed in daily chart at 0.80385 on 04/21/2025, so more gains to resistance(s) 0.83314 and maximum to Major Resistance (0.84000) is expected.
Take Profits:
0.83314
0.84000
0.85430
0.86286
0.87550
0.89147
0.90367
0.92218
0.94400
__________________________________________________________________
❤️ If you find this helpful and want more FREE forecasts in TradingView,
. . . . . . . . Hit the 'BOOST' button 👍
. . . . . . . . . . . Drop some feedback in the comments below! (e.g., What did you find most useful? How can we improve?)
🙏 Your support is appreciated!
Now, it's your turn!
Be sure to leave a comment; let us know how you see this opportunity and forecast.
Have a successful week,
ForecastCity Support Team

sand long longterm spot "🌟 Welcome to Golden Candle! 🌟
We're a team of 📈 passionate traders 📉 who love sharing our 🔍 technical analysis insights 🔎 with the TradingView community. 🌎
Our goal is to provide 💡 valuable perspectives 💡 on market trends and patterns, but 🚫 please note that our analyses are not intended as buy or sell recommendations. 🚫
Instead, they reflect our own 💭 personal attitudes and thoughts. 💭
Follow along and 📚 learn 📚 from our analyses! 📊💡"

new peak 3520, waiting for gold price to touch⭐️GOLDEN INFORMATION:
Gold prices extended their record-breaking surge on Tuesday, soaring past the $3,450 mark during the Asian session as investors sought refuge in the traditional safe-haven asset amid mounting fears of a US recession and broader financial market volatility.
Persistent concerns over the economic outlook and waning confidence in the US Dollar (USD) have continued to drive demand for the USD-denominated precious metal. The greenback remains under pressure, further amplifying gold's appeal.
Adding to the uncertainty, US President Donald Trump once again criticized Federal Reserve Chairman Jerome Powell, stoking fears about the central bank’s independence. Reports suggesting the administration explored legal avenues to potentially remove Powell have only deepened market unease, boosting the allure of gold as a hedge against policy and economic instability.
⭐️Personal comments NOVA:
Fomo price increase, trade tension, gold price benefits
⭐️SET UP GOLD PRICE:
🔥SELL GOLD zone : 3519- 3521 SL 3526
TP1: $3505
TP2: $3490
TP3: $3465
🔥BUY GOLD zone: $3403 - $3405 SL $3398
TP1: $3415
TP2: $3430
TP3: $3445
⭐️Technical analysis:
Based on technical indicators EMA 34, EMA89 and support resistance areas to set up a reasonable BUY order.
⭐️NOTE:
Note: Nova wishes traders to manage their capital well
- take the number of lots that match your capital
- Takeprofit equal to 4-6% of capital account
- Stoplose equal to 2-3% of capital account

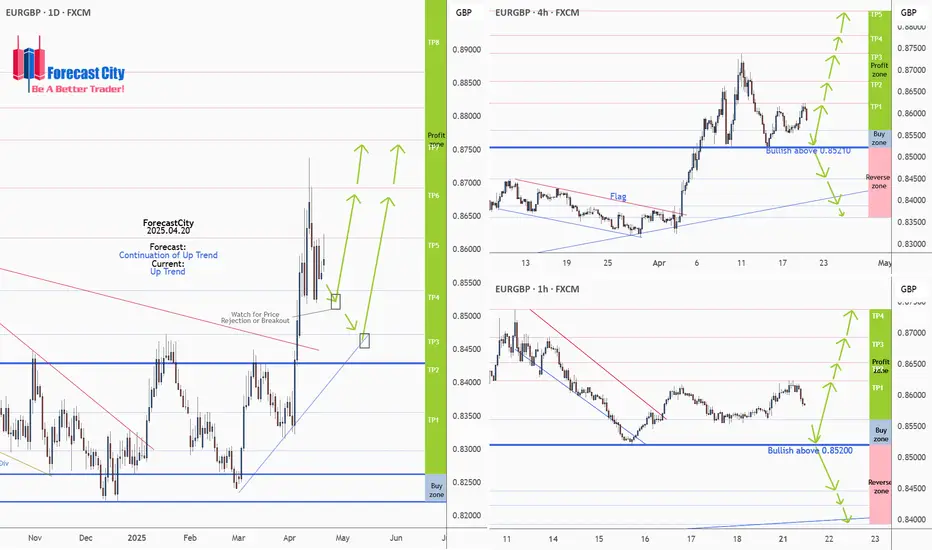
EURGBP Daily, H4,H1 Forecasts, Technical Analysis & Trading IdeaMidterm forecast:
0.84290 is a major support, while this level is not broken, the Midterm wave will be uptrend.
We will close our open trades, if the Midterm level 0.84290 is broken.
OANDA:EURGBP
Technical analysis:
A trough is formed in daily chart at 0.83220 on 04/03/2025, so more gains to resistance(s) 0.86175, 0.86923, 0.87647 and more heights is expected.
__________________________________________________________________
❤️ If you find this helpful and want more FREE forecasts in TradingView,
. . . . . . . . Hit the 'BOOST' button 👍
. . . . . . . . . . . Drop some feedback in the comments below! (e.g., What did you find most useful? How can we improve?)
🙏 Your support is appreciated!
Now, it's your turn!
Be sure to leave a comment; let us know how you see this opportunity and forecast.
Have a successful week,
ForecastCity Support Team
surpassing the old peak, gold price will reach above 3400 soon⭐️GOLDEN INFORMATION:
Gold price (XAU/USD) resumes its upward momentum, climbing to a fresh all-time high around $3,375 during Monday’s early Asian session, as markets reopen following the extended holiday weekend. The surge comes amid renewed investor appetite for safe-haven assets, fueled by ongoing geopolitical tensions and lingering uncertainty surrounding US President Donald Trump’s aggressive tariff agenda.
With fears mounting over the broader economic fallout from escalating trade conflicts, gold has soared over 25% year-to-date. “In today’s environment of intensifying tariff ambiguity, slowing global growth, sticky inflation, and rising geopolitical risks, the strategic case for increasing gold exposure has never been stronger,” noted analysts at UBS, emphasizing a shift toward diversification away from US assets and the US Dollar.
⭐️Personal comments NOVA:
Big increase, gold price continues to rise thanks to tariff momentum
⭐️SET UP GOLD PRICE:
🔥SELL GOLD zone : 3404- 3406 SL 3409 scalping
TP1: $3395
TP2: $3380
TP3: $3370
🔥SELL GOLD zone : 3415- 3417 SL 3422
TP1: $3405
TP2: $3390
TP3: $3370
🔥BUY GOLD zone: $3357 - $3355 SL $3350
TP1: $3365
TP2: $3380
TP3: $3405
⭐️Technical analysis:
Based on technical indicators EMA 34, EMA89 and support resistance areas to set up a reasonable BUY order.
⭐️NOTE:
Note: Nova wishes traders to manage their capital well
- take the number of lots that match your capital
- Takeprofit equal to 4-6% of capital account
- Stoplose equal to 2-3% of capital account

SOYBEAN, Weekly Supply/Demand+fundamentals we are kicking of the year with a clear technical rejection from $1050 to $1112 weekly supply zone. Price pushed agressively into this area and has now printed multiple rejection candles on the daily, confirming the zones strength.
fundamentals are showing bearish positioning aligned with the technical setup.
entry wil be at market open. first target is at break of recent support and if fundamentals stil support the bias by then we wil also aim for target two.
simple structure, clean confirmation. lets see if price delivers.

Why this strategy works so well (Ticker Pulse Meter + Fear EKG) Disclaimer: This is for educational purposes only. I am not a financial advisor, and this is not financial advice. Consult a professional before investing real money. I strongly encourage paper trading to test any strategy.
The Ticker Pulse + Fear EKG Strategy is a long-term, dip-buying investment approach that balances market momentum with emotional sentiment. It integrates two key components:
Ticker Pulse: Tracks momentum using dual-range metrics to pinpoint precise entry and exit points.
Fear EKG: Identifies spikes in market fear to highlight potential reversal opportunities.
Optimized for the daily timeframe, this strategy also performs well on weekly or monthly charts, making it ideal for dollar-cost averaging or trend-following with confidence. Visual cues—such as green and orange dots, heatmap backgrounds, and SMA/Bollinger Bands—provide clear signals and context. The strategy’s default settings are user-friendly, requiring minimal adjustments.
Green dots indicate high-confidence entry signals and do not repaint.
Orange dots (Fear EKG entries), paired with a red “fear” heatmap background, signal opportunities to accumulate shares during peak fear and market sell-offs.
Now on the the educational part that is most fascinating.
Load XLK on your chart and add a secondary line by plotting the following on a secondary axis:
INDEX:SKFI + INDEX:SKTH / 2
Now, you should see something like this:
Focus on the INDEX:SKFI + INDEX:SKTH / 2 line, noting its dips and spikes. Compare these movements to XLK’s price action and the corresponding dot signals:
Green and Orange Dots: Opportunities to scale into long positions.
Red Dots: Opportunities to start scaling out of positions.
This concept applies not only to XLK but also to major stocks within a sector, such as AAPL, a significant component of XLK. Chart AAPL against INDEX:SKFI + INDEX:SKTH / 2 to observe how stock and sector indices influence each other.
Now, you should see something like this:
Long-Term Investing Considerations
By default, the strategy suggests exiting 50% of open positions at each red dot. However, as long-term investors, there’s no need to follow this rule strictly. Instead, consider holding positions until they are profitable, especially when dollar-cost averaging for future retirement.
In prolonged bear markets, such as 2022, stocks like META experienced significant declines. Selling 50% of positions on early red dots may have locked in losses. For disciplined long-term investors, holding all open positions through market recoveries can lead to profitable outcomes.
The Importance of Context
Successful trading hinges on context. For example, using a long-term Linear Regression Channel (LRC) and buying green or orange dots below the channel’s point-of-control (red line) significantly improves the likelihood of success. Compare this to buying dots above the point-of-control, where outcomes are less favorable.
Why This Strategy Works
The Ticker Pulse + Fear EKG Strategy excels at identifying market dips and tops by combining momentum and sentiment analysis. I hope this explanation clarifies its value and empowers you to explore its potential through paper trading.
Anyway, I thought I would make a post to help explain why the strategy is so good at identifying the dips and the tops. Hope you found this write up as educational.
The strategy:
The Companion Indicator:

3382 , next ATH number today, GOLD⭐️GOLDEN INFORMATION:
Gold price (XAU/USD) enters a phase of consolidation on Thursday, trading within a narrow range near its all-time high reached during the Asian session, as investors digest conflicting market signals. Stronger-than-expected US Retail Sales figures and hawkish remarks from Federal Reserve (Fed) Chair Jerome Powell have lent support to the US Dollar (USD), curbing some of gold’s upside momentum. Meanwhile, the upbeat sentiment across equity markets and mildly overbought technical conditions are prompting traders to remain cautious, limiting fresh buying interest in the precious metal for now.
⭐️Personal comments NOVA:
Gold price continues to increase today, the fomo still has no end, pay attention to the new ATH price zone 3382
⭐️SET UP GOLD PRICE:
🔥SELL GOLD zone : 3381- 3383 SL 3388
TP1: $3370
TP2: $3355
TP3: $3333
🔥BUY GOLD zone: $3302 - $3300 SL $3295
TP1: $3310
TP2: $3320
TP3: $3330
⭐️Technical analysis:
Based on technical indicators EMA 34, EMA89 and support resistance areas to set up a reasonable BUY order.
⭐️NOTE:
Note: Nova wishes traders to manage their capital well
- take the number of lots that match your capital
- Takeprofit equal to 4-6% of capital account
- Stoplose equal to 2-3% of capital account

Apple – More Pain to come? Apple’s NASDAQ:AAPL chart right now? Honestly, it’s a mess. It’s one of those setups where you can’t confidently say much with conviction , but one thing feels clear to me: it should go lower before it gets better.
Zooming out to the 3-day timeframe , you can spot something interesting: the downtrend from 2022 to 2023 looks almost identical to the one we’ve seen from July 2023 to April 2024 — same structure, same slow bleed, and almost the exact same duration. That kind of symmetry doesn’t happen by accident.
After that, we had a massive rally from April/May 2024 , but now we’re already seeing a sharp retracement — down over 35%. My take? We probably need one more leg lower to really shake things out before Apple makes a meaningful move higher, maybe toward $250–$260 .
To get there, I think we still need to retest the $160–$150 zone. If we break below that and head toward $120, then we’re in real trouble structurally — that would shift the whole outlook.
Yes, the recent bounce from the VWAP level was clean , and it looked strong — but I wouldn’t rule out one more flush before we get the real recovery. Apple is in no-man’s-land right now, and until we hit key levels or reclaim broken structure, it’s caution over confidence.

Nvidia : Should I be worried?Looking closely at Nvidia NASDAQ:NVDA , we can see that since March, the price has gravitated back to the Point of Control (POC) on the volume profile. From there, we’ve seen a solid reaction — up around 33%, after Nvidia had previously taken a sharp hit from its recent top.
In my view, it’s very possible that Wave 4 is now complete. It’s been a very complex, sideways consolidation, but that’s typical behavior for a fourth wave. Zoom out, and the bigger picture looks a lot cleaner — this whole range doesn’t seem nearly as messy on the higher timeframes.
That said, I’m not fully bullish yet. For me, $122 is the key level. Only once we break and hold above $122, I’ll shift into a more confidently bullish stance. Until then, it’s still possible we revisit the $80–$85 range, maybe even sweep the previous low. It doesn’t have to happen, but structurally, it’s still on the table.
Given the broader uncertainty — macroeconomic pressure, U.S.–China tensions, regulatory noise — I’m staying cautious. For now, I’m mainly focused on this from an 8-hour chart perspective. Until we get that confirmation above $122, I’m not rushing into any aggressive positions.

SOL - Longs on the Horizon!Hello TradingView Family / Fellow Traders. This is Richard, also known as theSignalyst.
📈 Medium-Term : SOL has been overall bearish and it is currently trading within the flat wedge pattern marked in red.
📍 As it retests the lower bound of the wedge — which perfectly intersects with the $100 round number — I’ll be looking for short-term longs.
🚀 In parallel, for the bulls to take over in the long term and kick off the next bullish phase, a breakout above the $147 previous daily high is needed.
Which scenario do you think will happen first — and why?
📚 Always follow your trading plan regarding entry, risk management, and trade management.
Good luck!
All Strategies Are Good; If Managed Properly!
~Rich

EURUSD Daily, H4,H1 Forecasts, Technical Analysis & Trading Idea💡 Daily Timeframe:
As forecasted by 4CastMachine AI last week, EURUSD was rejected from the channel line.
💡 H4 Timeframe:
FX:EURUSD started a corrective wave,
This decline may continue, but the support area of 1.1200 ~ 1.0890 could trigger a rebound.
This area, which was previously a major resistance, will become a major support, creating a good buying opportunity.
💡 H1 Timeframe:
The Triangle pattern formed in the price has broken downwards.
The bearish wave is expected to continue as long as the price is below the strong resistance at 1.1334
1.1334 Support is broken now. It will act as a Resistance now!
💡 H1 Forecast:
Correction wave toward the Sell Zone
Another Downward Impulse wave toward Lower TPs
H1 Trading Idea:
Sell now or wait for pullback and Sell on price rejection from 1.1334.
SL: Above 1.1334
__________________________________________________________________
❤️ If you find this helpful and want more FREE forecasts in TradingView,
. . . . . . . . Hit the 'BOOST' button 👍
. . . . . . . . . . . Drop some feedback in the comments below! (e.g., What did you find most useful? How can we improve?)
🙏 Your support is appreciated!
Now, it's your turn!
Be sure to leave a comment; let us know how you see this opportunity and forecast.
Have a successful week,
ForecastCity Support Team

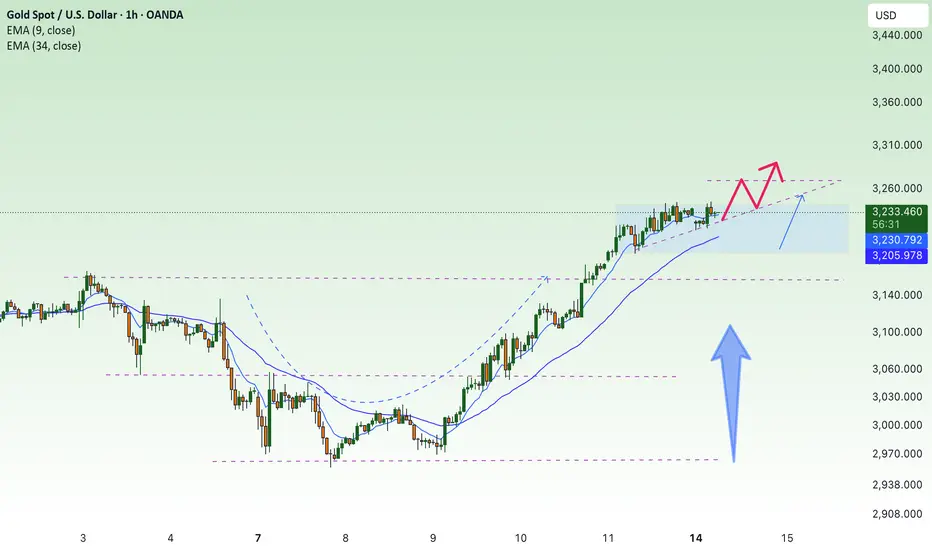
What Goes Up Must Come Down – Gold on the Edge?After a parabolic run to new highs, gold is flashing signs of exhaustion.
📌 Price is hugging the upper Bollinger Band on the daily chart.
📌 RSI is in overbought territory (currently around 68.2) — similar to previous local tops.
📌 We're forming a steep, almost unsustainable channel — historically, these tend to break hard when they do.
If we see a break below $3,086 and lose that trendline, eyes shift to:
🔻 $2,932 — key support
🔻 $2,787 — prior breakout retest
🔻 $2,532 — long-term trendline support
Still bullish long-term, but short-term? A pullback might be healthy.
🛑 Risk Disclaimer
This is not financial advice. Trade responsibly and use proper risk management.

ETH is fighting in the support zoneHello everyone, I invite you to review the current situation on ETH. When we enter the one-day interval, we can see how the ETH price moved in a strong downtrend channel. What's more, we can see that the price fell below the main uptrend line.
As we can see, the price is currently fighting to break out on top in the support zone from $ 1690 to $ 1350, in a situation if this zone was broken, we could see another strong drop to the support area at $ 884 at the previous low after the bull run.
On the other hand, if ETH gets wind in its sails again, it must first pass through the resistance zone from $ 1952 to $ 2100, while further on there is a very strong zone from $ 2500 to $ 2740.
However, here, taking into account the one-day interval, the RSI indicator shows a breakout above the top of the border, which may affect the potential end of the current uptrend.

UNI — Time to Accumulate? A Clean Long-Term SetupUNI is the native token of the Uniswap DEX — and it's finally back in our interest zone.
After a brutal 70% correction from previous highs, price has retraced into a key accumulation range between $3.60 – $6.76.
This isn’t just another alt — UNI is a fundamental token that arguably deserves a place in every long-term portfolio.
Spot entry around $5.50 looks reasonable, with higher timeframe targets at $10.35, $17.03, and $19.47.
No overtrading here — just a clean long-term thesis. Accumulate, sit back, and let the narrative unfold.
More thoughts in my profile @93balaclava
Personally I trade on a platform that offers low fees and strong execution. DM me if you're interested.

3270, waiting for new ATH gold price⭐️GOLDEN INFORMATION:
Gold prices eased during Monday's Asian session as risk sentiment improved, prompting a shift away from safe-haven assets. The upbeat market tone followed Wall Street’s strong rebound on Friday and encouraging developments in the ongoing US–China tariff dispute, temporarily reducing upward pressure on the yellow metal.
Last week, China retaliated against the US’s 145% tariff hike by imposing 125% duties on American goods but later signaled it would not respond to any additional escalations. Over the weekend, President Donald Trump floated the idea of targeting Chinese semiconductors and electronics with a separate 20% tariff—indicating a possible shift in strategy from across-the-board tariffs to more focused trade measures.
⭐️Personal comments NOVA:
Gold price, buying volume maintained, continuing the upward trend: 3260, 3270
⭐️SET UP GOLD PRICE:
🔥SELL GOLD zone : 3270- 3272 SL 3277
TP1: $3260
TP2: $3250
TP3: $3240
🔥BUY GOLD zone: $3168 - $3166 SL $3161
TP1: $3175
TP2: $3190
TP3: $3200
⭐️Technical analysis:
Based on technical indicators EMA 34, EMA89 and support resistance areas to set up a reasonable BUY order.
⭐️NOTE:
Note: Nova wishes traders to manage their capital well
- take the number of lots that match your capital
- Takeprofit equal to 4-6% of capital account
- Stoplose equal to 2-3% of capital account
OYAKC - Monthly // Decision Month - LONG TERM LEVELSI believe that this month is decision month for OYAKC.Either 600 days accumulation or 600 days ATHs. Any TURP problem could occur in Turkey so check the levels.
Monthly Close below 25.6 - SL
I'll be buying it till 2030.
DYOR.

GOLD(XAUUSD) -Weekly Forecast,Technical Analysis & Trading IdeasMidterm forecast:
2772.38 is a major support, while this level is not broken, the Midterm wave will be uptrend.
We will close our open trades, if the Midterm level 2772.38 is broken.
OANDA:XAUUSD TVC:GOLD
Technical analysis:
A peak is formed in daily chart at 3167.60 on 04/03/2025, so more losses to support(s) 3000.00, 2955.00, 2879.11 and minimum to Major Support (2772.38) is expected.
Take Profits:
2833.00
2879.11
2955.00
3000.00
3057.40
3100.00
3167.60
3200.00
__________________________________________________________________
❤️ If you find this helpful and want more FREE forecasts in TradingView,
. . . . . . . . Hit the 'BOOST' button 👍
. . . . . . . . . . . Drop some feedback in the comments below! (e.g., What did you find most useful? How can we improve?)
🙏 Your support is appreciated!
Now, it's your turn!
Be sure to leave a comment; let us know how you see this opportunity and forecast.
Have a successful week,
ForecastCity Support Team

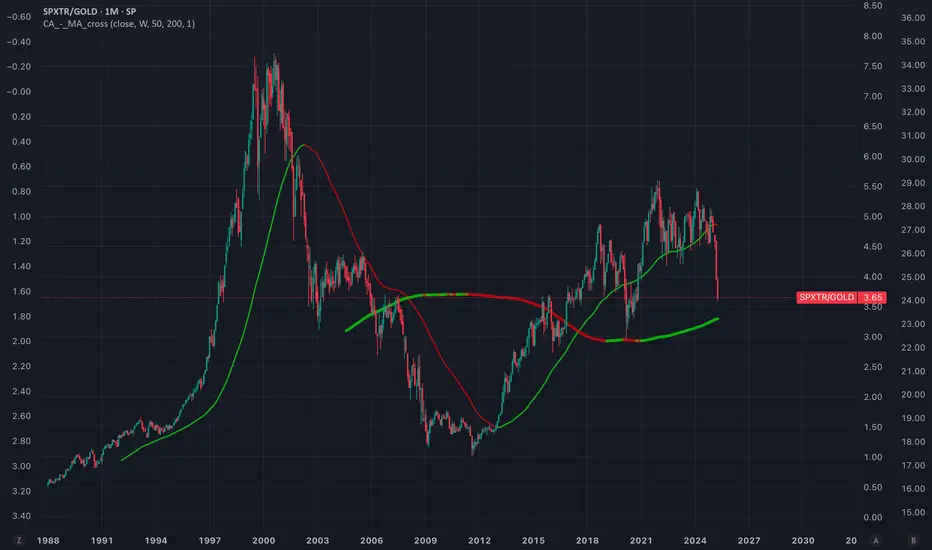
SPX/GOLD ratio near to key supportcrossing below moving average of 200 months could trigger a secular movement in favour of gold.
Potential global debt colapse and lack of confidence in USD + high valuation, mag-7 concentration and high growths expectations on AI are macro/fundamental facts that supports this idea.
XRP - Two Longs on the Horizon!Hello TradingView Family / Fellow Traders. This is Richard, also known as theSignalyst.
📈 Medium-Term: XRP broke below the $2 support zone last week, shifting the momentum from bullish to bearish.
📍 As it retests the lower bound of the channel — which perfectly intersects with the orange demand zone and the $1.5 round number — I’ll be looking for short-term longs.
🚀 For the bulls to take over in the long term and kick off the next bullish phase, a breakout above the red structure at $2.15 is needed.
Which scenario do you think will happen first — and why?
📚 Always follow your trading plan regarding entry, risk management, and trade management.
Good luck!
All Strategies Are Good; If Managed Properly!
~Rich

Bitcoin -Weekly, Daily, H4, H1 Forecasts, Trading IdeasMidterm forecast, Weekly Timeframe:
While the price is above the support 70550.04, resumption of uptrend is expected.
We make sure when the resistance at 91037.20 breaks.
If the support at 70550.04 is broken, the short-term forecast -resumption of uptrend- will be invalid.
BITSTAMP:BTCUSD MARKETSCOM:BITCOIN
Daily Timeframe:
A trough is formed in daily chart at 74545.70 on 04/09/2025, so more gains to resistance(s) 86499.57 and maximum to Major Resistance (91037.20) is expected.
Take Profits:
86499.57
91037.20
94505.46
98675.19
101430.12
105431.17
109932.89
115000.00
120000.00
125000.00
130000.00
140000.00
H4 Timeframe:
H1 Timeframe:
________________________________________________________________
❤️ If you find this helpful and want more FREE forecasts in TradingView,
. . . . . . . . Hit the 'BOOST' button 👍
. . . . . . . . . . . Drop some feedback in the comments below! (e.g., What did you find most useful? How can we improve?)
🙏 Your support is appreciated!
Now, it's your turn!
Be sure to leave a comment; let us know how you see this opportunity and forecast.
Have a successful week,
ForecastCity Support Team
