PayPal - Multiple Signals Pointing to a Potential Bottom!I’ve just entered a position in PayPal, and the reason is that several overlapping factors are lining up in a way that suggests a potential bottom may be in.
First, it looks very likely that Wave (2) is complete. The stock tapped the 61.8% Fibonacci retracement level with precision and has held that level over the past few days – all while the RSI has been climbing, which is a strong bullish divergence signal in my book.
Second, PayPal just touched last year’s VWAP level perfectly, which I view as another strong technical indicator for a potential reversal.
How far this move could go is still unclear, but the open gap above is definitely something I’m watching closely. For that to be in play, $71 needs to be reclaimed. And from here on, $66 should not be touched again.
That’s my plan – and that’s how I’m trading it. Let’s see if the market plays along.
Longterm

WTI - Weekly Forecast - Technical Analysis & Trading IdeasMidterm forecast:
While the price is above the support 64.000, resumption of uptrend is expected.
We make sure when the resistance at 79.361 breaks.
If the support at 64.000 is broken, the short-term forecast -resumption of uptrend- will be invalid.
TVC:USOIL BLACKBULL:WTI
Technical analysis:
A peak is formed in daily chart at 79.355 on 01/15/2025, so more losses to support(s) 64.900 and minimum to Major Support (64.000) is expected.
Take Profits:
68.354
70.182
72.434
74.449
77.410
79.361
83.961
87.000
93.882
100.802
109.192
126.350
__________________________________________________________________
❤️ If you find this helpful and want more FREE forecasts in TradingView,
. . . . . . . . Hit the 'BOOST' button 👍
. . . . . . . . . . . Drop some feedback in the comments below! (e.g., What did you find most useful? How can we improve?)
🙏 Your support is appreciated!
Now, it's your turn!
Be sure to leave a comment; let us know how you see this opportunity and forecast.
Have a successful week,
ForecastCity Support Team

MSTR - MicroStrategy : Long Strategy
This stock Microstrategy Inc is showing some good recovery price action here on the 1Hr chart. It is a triple bottom and this is strong market structure, typical of a reversal sequence
The neckline is about 314 which will soon be taken. The chart has a very popular indicator FBB, Fibonacci Bollinger Bands. The middle line is derived from volume moving averages.
It is also bullish on the daily and weekly.
Fundamentals are good, I did hear they burnt through stacks of cash but this was for inventories. Future is bright for this techy and its these companies, Nvidia, Apple, Google etc that lead the markets bullish out of corrections.

GOLD(XAUUSD) -Weekly forecast,Technical Analysis & Trading IdeasMidterm forecast:
2772.38 is a major support, while this level is not broken, the Midterm wave will be uptrend.
OANDA:XAUUSD TVC:GOLD
Technical analysis:
A trough is formed in daily chart at 2832.55 on 02/28/2025, so more gains to resistance(s) 3000.00, 3050.00, 3080.00 and more heights is expected.
Take Profits:
2833.00
2879.11
2955.00
3000.00
3050.00
__________________________________________________________________
❤️ If you find this helpful and want more FREE forecasts in TradingView,
. . . . . . . . Hit the 'BOOST' button 👍
. . . . . . . . . . . Drop some feedback in the comments below! (e.g., What did you find most useful? How can we improve?)
🙏 Your support is appreciated!
Now, it's your turn!
Be sure to leave a comment; let us know how you see this opportunity and forecast.
Have a successful week,
ForecastCity Support Team

NZDCHF - Weekly Forecast - Technical Analysis & Trading IdeasMidterm forecast:
While the price is above the support 0.49439, beginning of uptrend is expected.
We make sure when the resistance at 0.52680 breaks.
If the support at 0.49439 is broken, the short-term forecast -beginning of uptrend- will be invalid.
OANDA:NZDCHF
Technical analysis:
A peak is formed in daily chart at 0.51845 on 02/20/2025, so more losses to support(s) 0.49950 and minimum to Major Support (0.49439) is expected.
Take Profits:
0.51043
0.51780
0.52680
0.53798
0.55094
0.56221
0.56728
0.57630
0.58900
0.60187
0.65051
__________________________________________________________________
❤️ If you find this helpful and want more FREE forecasts in TradingView,
. . . . . . . . Hit the 'BOOST' button 👍
. . . . . . . . . . . Drop some feedback in the comments below! (e.g., What did you find most useful? How can we improve?)
🙏 Your support is appreciated!
Now, it's your turn!
Be sure to leave a comment; let us know how you see this opportunity and forecast.
Have a successful week,
ForecastCity Support Team

RUNE/USDTHere i can see the best spot opportunity in RUNEUSDT as it is now on it's most important support level as it respect it's Support level it may show some good rally.

PPI, gold price opportunity to create new ATH above 2956⭐️Smart investment, Strong finance
⭐️GOLDEN INFORMATION:
Core CPI, excluding volatile food and energy prices, eased from 3.3% in January to 3.1% year-over-year, signaling ongoing disinflation in the U.S. economy.
Meanwhile, the Atlanta Fed’s GDPNow model projects a -2.4% contraction for Q1 2025, marking the first negative reading since the COVID-19 pandemic.
Money market traders have adjusted their expectations for Federal Reserve easing in 2025, pricing in 71 basis points of rate cuts—down from 77 bps the previous day, according to Prime Market Terminal data.
⭐️Personal comments NOVA:
Gold has accumulated, continues to grow and heads towards a new ATH: 2976
⭐️SET UP GOLD PRICE:
🔥SELL GOLD zone: $2954 - $2956 SL $2959 scalping
TP1: $2950
TP2: $2945
TP3: $2940
🔥SELL GOLD zone: $2975 - $2977 SL $2982
TP1: $2968
TP2: $2960
TP3: $2950
🔥BUY GOLD zone: $2920 - $2918 SL $2913
TP1: $2930
TP2: $2940
TP3: $2950
⭐️Technical analysis:
Based on technical indicators EMA 34, EMA89 and support resistance areas to set up a reasonable BUY order.
⭐️NOTE:
Note: Nova wishes traders to manage their capital well
- take the number of lots that match your capital
- Takeprofit equal to 4-6% of capital account
- Stoplose equal to 2-3% of capital account

EURCAD - Weekly Forecast - Technical Analysis & Trading IdeasOANDA:EURCAD
💡 Daily Timeframe:
As forecasted by 4CastMachine AI, The Euro also reached our TP7 at 1.5777 by breaking the resistance at 1.5156.
The broken resistance area will serve as our new support area and Buy Zone.
As long as this area is not broken down, there is a possibility of a resumption of the uptrend.
If the price enters our new buy zone with a corrective wave and is rejected from it, we will enter with buy trades.
💡 H4 Timeframe:
The bearish wave is expected to continue as long as the price is below the strong resistance at 1.5857
💡 H1 Timeframe:
The uptrend is broken, and price is in an impulse wave.
1.5729 support is broken now. It will act as a Resistance now!
Forecast:
Correction wave toward the Sell Zone
Another Downward Impulse wave toward Lower TPs
__________________________________________________________________
❤️ If you find this helpful and want more FREE forecasts in TradingView,
. . . . . . . . Hit the 'BOOST' button 👍
. . . . . . . . . . . Drop some feedback in the comments below! (e.g., What did you find most useful? How can we improve?)
🙏 Your support is appreciated!
Now, it's your turn!
Be sure to leave a comment; let us know how you see this opportunity and forecast.
Have a successful week,
ForecastCity Support Team

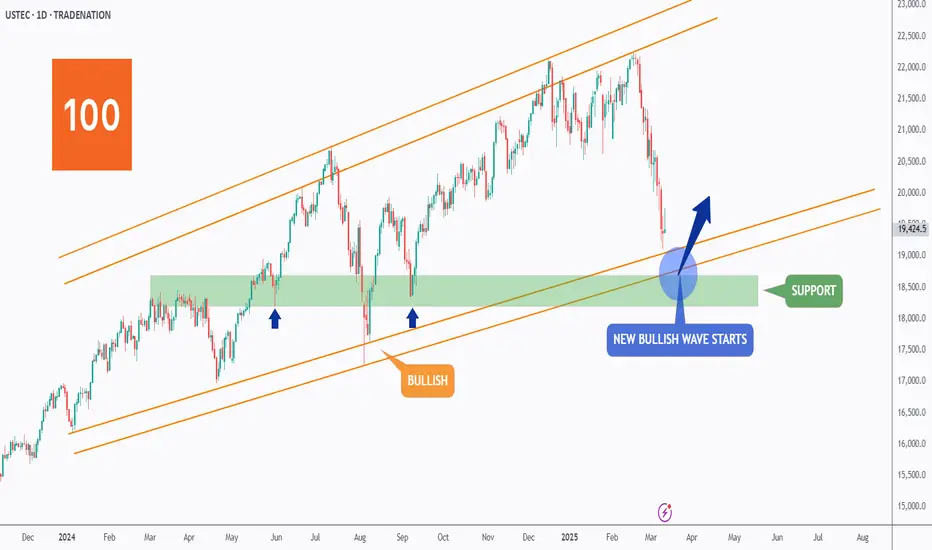
USTEC - Short-Term Pain, but...Hello TradingView Family / Fellow Traders. This is Richard, also known as theSignalyst.
📈Long-term, USTEC has been overall bullish trading within the rising channel marked in orange.
This month, USTEC has been in a correction phase, retesting the lower bound of the channel.
Moreover, the green zone is a strong support zone.
🏹 Thus, the highlighted blue circle is a strong area to look for buy setups as it is the intersection of support and lower orange trendlines acting as non-horizontal support.
📚 As per my trading style:
As #USTEC is hovering around the blue circle zone, I will be looking for bullish reversal setups (like a double bottom pattern, trendline break , and so on...)
📚 Always follow your trading plan regarding entry, risk management, and trade management.
Good luck!
All Strategies Are Good; If Managed Properly!
~Rich
Disclosure: I am part of Trade Nation's Influencer program and receive a monthly fee for using their TradingView charts in my analysis.
NAZDAQ - Weekly Forecast - Technical Analysis & Trading IdeasNASDAQ:NDX IG:NASDAQ
Midterm forecast:
20796.85 is a major resistance, while this level is not broken, the Midterm wave will be downtrend.
Technical analysis:
A peak is formed in daily chart at 22254.20 on 02/18/2025, so more losses to support(s) 19337.48, 18815.60, 18313.47 and more depths is expected.
Trading suggestion:
There is possibility of temporary retracement to suggested Trend Hunter Sell Zone (20554.38 to 20796.85).
We wait during the retracement, until the price tests the zone, whether approaching, touching or entering the zone.
We would set sell orders based on Daily-Trading-Opportunities and expect to reach short-term targets.
Beginning of entry zone (20554.38)
Ending of entry zone (20796.85)
Take Profits:
19901.88
19337.48
18815.60
18313.47
17841.19
16988.69
16247.08
__________________________________________________________________
❤️ If you find this helpful and want more FREE forecasts in TradingView,
. . . . . . . . Hit the 'BOOST' button 👍
. . . . . . . . . . . Drop some feedback in the comments below! (e.g., What did you find most useful? How can we improve?)
🙏 Your support is appreciated!
Now, it's your turn!
Be sure to leave a comment; let us know how you see this opportunity and forecast.
Have a successful week,
ForecastCity Support Team

LTC Litecoin: Is the bottom in? Bottom in on LITECOIN? Are you bullish?
Long term im bullish on this coin as a side gig. Look how the ws are forming.. juicy?
Question is, have we bottomed or is more room to drop down to under 60EUR? It could drop even more, with the lunar eclipse coming on friday.. but we have hit the 78.6 already... RSI 44...
What do you think?

USDCAD SHORTLongterm oportunity to short USDCAD. We are in bigger consolidation that we can see on Monthly chart. On weekly we touch upper area of consolidation and now we brake UP trend and currently we are in retracement.
Try to look for enteries for short.
SL: above highest point
TP: above lower band of consolidation (dont be too greedy)

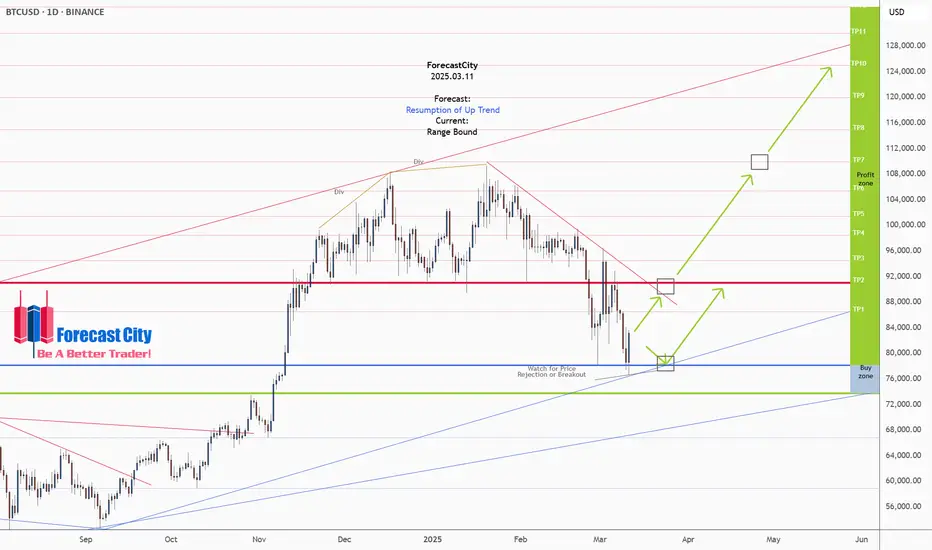
Bitcoin - Weekly Forecast - Technical Analysis & Trading IdeasMidterm forecast:
While the price is above the support 73777.00, resumption of uptrend is expected.
We make sure when the resistance at 91037.20 breaks.
If the support at 73777.00 is broken, the short-term forecast -resumption of uptrend- will be invalid.
BITSTAMP:BTCUSD
Technical analysis:
A peak is formed in daily chart at 109588.00 on 01/20/2025, so more losses to support(s) 78180.00 and minimum to Major Support (73777.00) is expected.
Take Profits:
86499.57
91037.20
94505.46
98489.63
101430.12
105431.17
109932.89
115000.00
120000.00
125000.00
__________________________________________________________________
❤️ If you find this helpful and want more FREE forecasts in TradingView,
. . . . . . . . Hit the 'BOOST' button 👍
. . . . . . . . . . . Drop some feedback in the comments below! (e.g., What did you find most useful? How can we improve?)
🙏 Your support is appreciated!
Now, it's your turn!
Be sure to leave a comment; let us know how you see this opportunity and forecast.
Have a successful week,
ForecastCity Support Team
130000.00
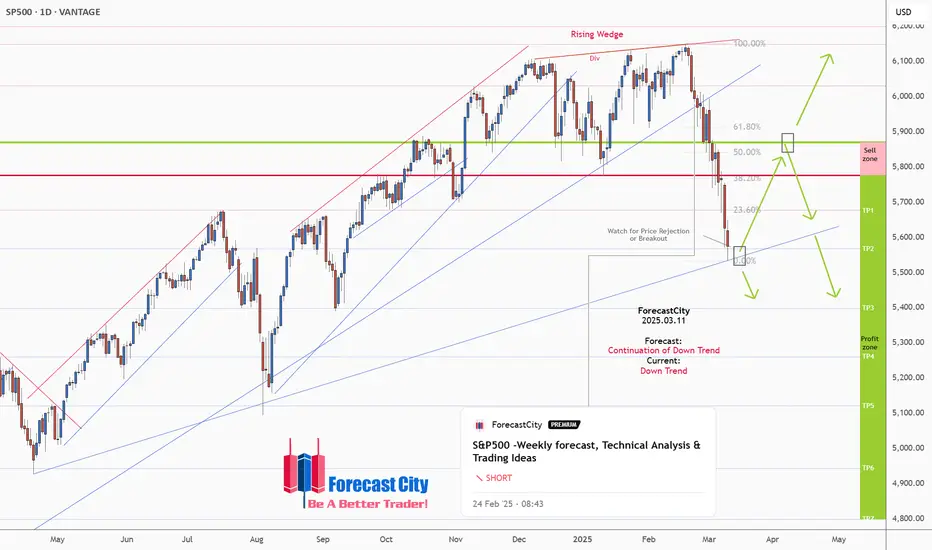
S&P500 -Weekly forecast, Technical Analysis & Trading IdeasMidterm forecast:
5870.56 is a major resistance, while this level is not broken, the Midterm wave will be downtrend.
$S&P500
Technical analysis:
A peak is formed in daily chart at 6150.05 on 02/19/2025, so more losses to support(s) 5568.78, 5398.95, 5261.00 and more depths is expected.
Take Profits:
5677.80
5568.78
5398.95
5261.00
5122.47
4944.41
4800.00
__________________________________________________________________
❤️ If you find this helpful and want more FREE forecasts in TradingView,
. . . . . . . . Hit the 'BOOST' button 👍
. . . . . . . . . . . Drop some feedback in the comments below! (e.g., What did you find most useful? How can we improve?)
🙏 Your support is appreciated!
Now, it's your turn!
Be sure to leave a comment; let us know how you see this opportunity and forecast.
Have a successful week,
ForecastCity Support Team
doge longterm buy spot"🌟 Welcome to Golden Candle! 🌟
We're a team of 📈 passionate traders 📉 who love sharing our 🔍 technical analysis insights 🔎 with the TradingView community. 🌎
Our goal is to provide 💡 valuable perspectives 💡 on market trends and patterns, but 🚫 please note that our analyses are not intended as buy or sell recommendations. 🚫
Instead, they reflect our own 💭 personal attitudes and thoughts. 💭
Follow along and 📚 learn 📚 from our analyses! 📊💡"

The Big ReloadI anticipate a significant pullback on the daily timeframe, targeting the $15,000 level before resuming the upward trend.
Following a substantial break in the bullish trend, a robust retracement is expected. This correction should trigger considerable buying momentum around the $15,000 to $16,000 range, presenting opportunities for long-term positions to the upside.

EURNZD - Weekly forecast, Technical Analysis & Trading IdeasMidterm forecast:
1.84895 is a major support, while this level is not broken, the Midterm wave will be uptrend.
Technical analysis:
A trough is formed in daily chart at 1.81705 on 02/21/2025, so more gains to resistance(s) 1.89340, 1.90550, 1.91400 and more heights is expected.
Supports and Resistances:
1.95650
1.90550
1.87650
1.85400
1.81700
1.78251
1.76500
__________________________________________________________________
❤️ If you find this helpful and want more FREE forecasts in TradingView,
. . . . . . . . Hit the 'BOOST' button 👍
. . . . . . . . . . . Drop some feedback in the comments below! (e.g., What did you find most useful? How can we improve?)
🙏 Your support is appreciated!
Now, it's your turn!
Be sure to leave a comment; let us know how you see this opportunity and forecast.
Have a successful week,
ForecastCity Support Team

BTC Time to FLY.As of now according to weekly chart i can see that the Market is on that resistance level of its channel, so what i think here is that the Market will goes according to its history, probability is market will retest 50 MA and will show the new high, after that it will move towards channel's support level.
So According to me, its the best time to be Bullish, or have some spot in portfolio.

BTC Warning Time .As of now according to weekly chart i can see that the Market is on that resistance level of its channel, so what i think here is that the Market will goes according to its history, probability is market will retest 50 MA and will show the new high, after that it will move towards channel's support level.
So According to me, its the best time to be Bullish, or have some spot in portfolio.

BTC - Get Ready!🚨 CRYPTOCAP:BTC is dipping hard! 🚨
📉 Get ready for a massive entry at $72,000—here’s why:
It aligns with:
1️⃣ Lower bound of the blue wedge pattern
2️⃣ Previous resistance turned support
3️⃣ Key demand zone
4️⃣ -34% correction phase
📊 This level could be a game-changer! Are you buying?

US500 Signaling Optimism!Hello TradingView Family / Fellow Traders. This is Richard, also known as theSignalyst.
📈Long-term, US500 has been overall bullish trading within the rising wedge pattern marked in blue.
This month, US500 has been in a correction phase, retesting the lower bound of the wedge.
Moreover, the green zone is a strong structure and previous ATH.
🏹 Thus, the highlighted blue circle is a strong area to look for buy setups as it is the intersection of structure and lower blue trendline acting as a non-horizontal support.
📚 As per my trading style:
As #US500 is hovering around the blue circle zone, I will be looking for bullish reversal setups (like a double bottom pattern, trendline break , and so on...)
📚 Always follow your trading plan regarding entry, risk management, and trade management.
Good luck!
All Strategies Are Good; If Managed Properly!
~Rich
Disclosure: I am part of Trade Nation's Influencer program and receive a monthly fee for using their TradingView charts in my analysis.

NF news - Opportunity for gold price to return to old ATH 2955⭐️Smart investment, Strong finance
⭐️GOLDEN INFORMATION:
Gold’s three-day rally came to a pause as investors locked in profits ahead of the highly anticipated US Nonfarm Payrolls report. A rise in US Treasury yields further dampened the appeal of the non-yielding metal. At the time of writing, XAU/USD remains steady at $2,918.
Despite consolidating above the $2,900 mark, gold faced resistance following an earlier surge in the US 10-year Treasury yield to a one-week high before retreating to 4.286%..
⭐️Personal comments NOVA:
Tariff Situation Remains Long Term Driver for Gold Growth, NF News Key Data to Determine Today's Trend
⭐️SET UP GOLD PRICE:
🔥SELL GOLD zone: $2954 - $2956 SL $2961
TP1: $2945
TP2: $2930
TP3: $2920
🔥BUY GOLD zone: $2832 - $2834 SL $2827
TP1: $2840
TP2: $2850
TP3: $2860
⭐️Technical analysis:
Based on technical indicators EMA 34, EMA89 and support resistance areas to set up a reasonable BUY order.
⭐️NOTE:
Note: Nova wishes traders to manage their capital well
- take the number of lots that match your capital
- Takeprofit equal to 4-6% of capital account
- Stoplose equal to 2-3% of capital account

UK100 (FTSE)-Weekly forecast, Technical Analysis & Trading IdeasMidterm forecast:
8380.25 is a major support, while this level is not broken, the Midterm wave will be uptrend.
Technical analysis:
A trough is formed in daily chart at 8611.20 on 02/21/2025, so more gains to resistance(s) 8854.99, 9000.00, 9100.00 and more heights is expected.
Take Profits:
8664.21
8765.00
8854.99
9000.00
9100.00
__________________________________________________________________
❤️ If you find this helpful and want more FREE forecasts in TradingView,
. . . . . . . . Hit the 'BOOST' button 👍
. . . . . . . . . . . Drop some feedback in the comments below! (e.g., What did you find most useful? How can we improve?)
🙏 Your support is appreciated!
Now, it's your turn!
Be sure to leave a comment; let us know how you see this opportunity and forecast.
Have a successful week,
ForecastCity Support Team
