Ethereum is deciding where it wants to live.This is not a trade idea, this is a long term concept, most of my portfolio is swing when bull market comes (monthly/yearly) not trade (daily/weekly).
This is a solid question that will have to be played out in the upcoming years, Ethereum keeps changing its monetary policy and right now has less supply increase than BTC (due to burning mechanisms), will that stay forever? What will happen in the future to the policy? What it will mean for price?
Right now we can clearly see this is a bull case for future months.
Longterminvesting

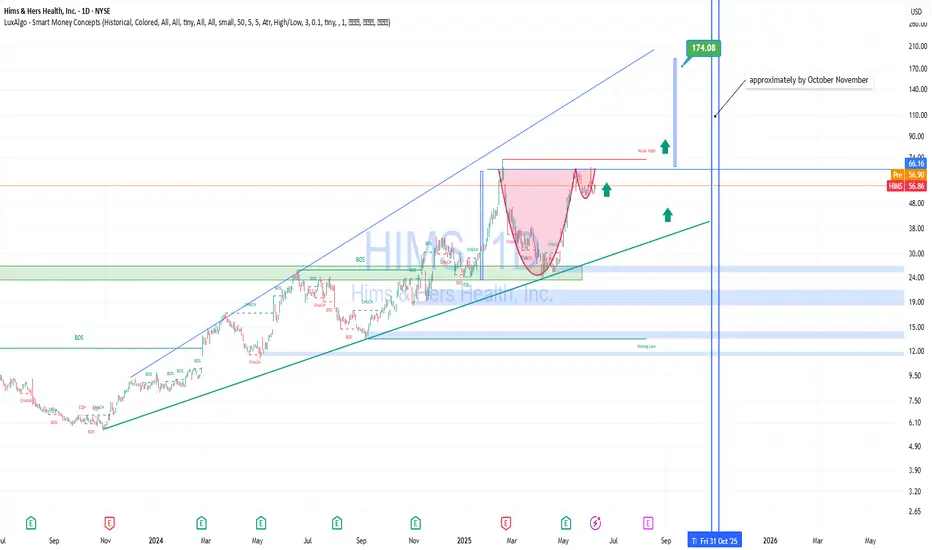
HIMS – Technically and Fundamentally Strong for Mid-to-Long TermTechnical Analysis
HIMS is trading in a clear ascending channel since 2023.
On the daily chart, a “cup and handle” formation has completed, with a confirmed breakout above the neckline ($55–$57 area).
The price is consolidating near the breakout point – classic behavior before a continuation move.
Target projection from the cup pattern is $170+, implying a 200%+ upside potential.
The stock also respects the upper trendline of the long-term channel, reinforcing bullish structure.
Fundamental Strength:
Telemedicine megatrend: Digital health is booming. HIMS is one of the few well-established D2C players in the U.S. market.
Revenue growth: Annual revenue growth exceeds 40% YoY, a sign of operational efficiency and demand.
Sticky subscription model: Over 1.5 million active subscribers — solid base for recurring revenue and LTV.
Valuation upside: Still undervalued relative to sector peers despite recent rally.
Scalable tech stack: Strong backend, customer acquisition systems, and vertically integrated infrastructure support further expansion.
Conclusion: HIMS offers an attractive risk–reward setup for swing traders and long-term investors alike
SHREE DIGVIJAY CEMENET AT LONG TERM SUPPORT ZONEThis is the Weekly chart of SHREDIGCEM.
SHREDIGCEM is trading near it's long term support zone at 60-70 range.
stock has been moving within a long-term parallel channel, with a well-established support zone in the range of ₹65–₹70.
Currently, the stock is forming a broadening pattern near its support zone, with the pattern support range between ₹70–₹75.
If this level is sustain then,we may see higher prices in SHREDIGCEM.

Technical & Historical Key TakeawaysThis chart analyzes the historical price cycles of Gold (XAU/USD) over the past decades, focusing on the alternation between long bull runs and prolonged bear markets.
You highlighted clear phases:
1970 - 1980: 10-year Bull Run
Massive price rally, followed by a sharp correction.
1980 - 2001: 20-year Bear Market
Prolonged sideways and downward movement.
2001 - 2011: 10-year Bull Run
Strong upward trend, reaching new all-time highs.
2011 - 2016: 5-year Bear Market
Significant correction but shorter in duration.
2016 - 2025: 10-year Bull Run
Another strong bullish phase, possibly ending in May 2025.
🔮 Scenarios projected:
Scenario 1 (Blue path):
A shorter bear market (5 years) similar to 2011-2016 correction, then continuation of the long-term uptrend.
Scenario 2 (Yellow path):
Gold enters a long-term 20-year bear market, similar to what happened post-1980.
You are asking if Gold is now entering a short bear phase (Scenario 1) or will fall into a multi-decade bear market (Scenario 2).
Cyclicality of Gold:
Gold has shown repetitive cycles of 10-year bull runs followed by either short (5-year) or long (20-year) bear markets.
These cycles seem to reflect macroeconomic shifts (inflation, interest rates, global crises).
Current Cycle (2016 - 2025):
If we respect the pattern, May 2025 might mark the end of the current bull cycle, opening the door to a corrective phase.
Scenario 1 favors a soft correction:
Based on the last cycle (2011-2016), a 5-year bear market might occur.
This would keep the long-term bullish trend alive, especially if macroeconomic conditions stay inflationary or geopolitical risks remain high.
Scenario 2 warns of a harsh bear market:
If history repeats the 1980-2001 phase, gold could enter a multi-decade bear market, driven by reduced inflation fears, strong dollar cycles, or financial system stability.
Key Indicators to watch:
Real interest rates.
USD strength vs global currencies.
Demand from central banks and emerging markets.
Geopolitical tensions and inflation expectations.

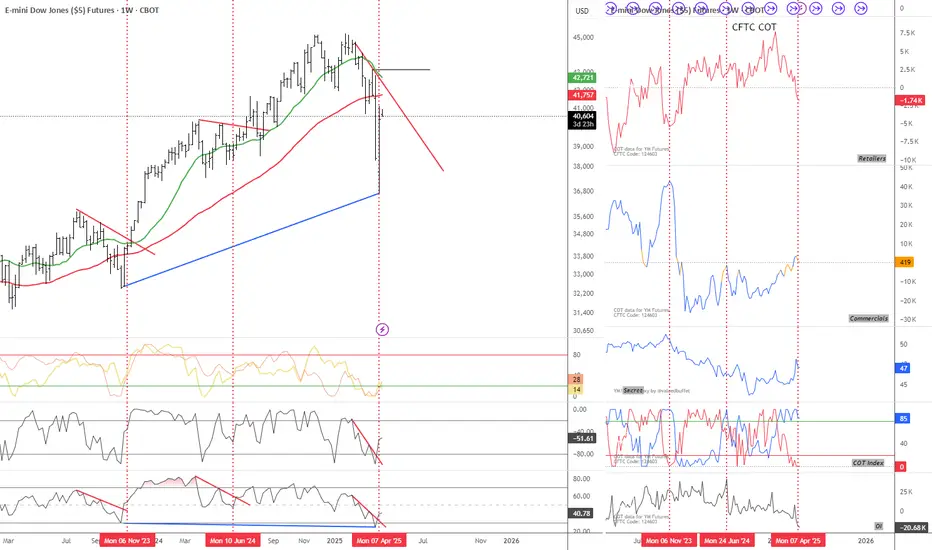
Is it going to happen again? My view to the markets right now...CBOT_MINI:YM1!
Is the Dow Jones breaking the downtrend again?
I believe there's a strong chance the markets are setting up for another move higher. From a fundamental standpoint, the recent pause in tariffs is a big deal. It removes an immediate layer of uncertainty that’s been hanging over the global economy, especially for exporters and multinational companies. On top of that, the fact that key tech products have been left out of the latest tariff actions is boosting confidence in the sector that has been leading market strength for years.
Economically, we’re still seeing resilience in key indicators. Unemployment remains low, consumer spending is steady, and central banks are staying cautious with tightening. The environment still leans more towards slow growth than recession, which supports equities over the medium term.
More importantly, my own criteria for a favorable market setup are lining up. Whether it’s sentiment, intermarket signals, or trend conditions—this looks like a solid spot for a bullish stance.
You can see my chart to check out my current viewpoint on the Dow Jones and how I’m positioning based on all this.
Not Financial Advice
Bill Ackman: The Activist Investor Who Challenges the Status QuoHello Traders!
Today, we’re going to explore the trading and investment philosophy of one of the most successful activist investors in the world – Bill Ackman . Known for his bold moves and unapologetic approach, Ackman has built a reputation for making large, influential investments and actively working to restructure companies in order to create value. With his hedge fund, Pershing Square Capital Management , Ackman has turned millions into billions by taking concentrated positions in underperforming companies, often pushing for changes that he believes will improve shareholder value.
Bill Ackman’s Investment Strategy
Ackman’s investing philosophy is rooted in a few key principles that have guided his success:
Activist Investing: Ackman is known for buying large stakes in companies and pushing for significant changes. This often involves changes in management, strategy, or financial structure to unlock value. He doesn’t just buy stocks, he buys control to influence the direction of companies.
Concentrated Bets: Unlike most fund managers who diversify, Ackman makes concentrated investments, believing in a small number of high-conviction ideas. He typically goes big on the companies he believes will give the highest returns.
Long-Term Vision: While Ackman is an activist, he is also a long-term investor. He’s known to hold onto stocks for years as he works through his plans to improve the companies he invests in.
Thorough Research and Analysis: Before making any moves, Ackman ensures he has done comprehensive research. He’s known for his deep dives into a company’s fundamentals, industry trends, and potential catalysts for growth.
Notable Investments and Activist Moves
Ackman’s career has been built on several high-profile, successful investments. Here are some of his best-known plays:
Herbalife: One of his most controversial investments, Ackman shorted Herbalife, claiming the company was a pyramid scheme. Despite facing heavy opposition and pressure, Ackman stuck to his position, although ultimately the trade didn’t work out as he anticipated. It became a case study in risk and persistence.
Target: Ackman took a large position in Target, pushing for changes in the company’s real estate strategy and retail business. His work with Target helped to bring greater shareholder value.
Valeant Pharmaceuticals: Ackman’s investment in Valeant Pharmaceuticals initially gained massive attention. Despite the stock’s later troubles, his involvement in the company drew attention to the power of activism and led to changes in leadership at Valeant.
Chipotle Mexican Grill: Ackman has also invested in Chipotle, pushing for operational improvements and better management. His efforts have been instrumental in driving changes in the company’s strategy, helping the stock recover from earlier setbacks.
Risk Management and Position Sizing
When it comes to risk management, Ackman follows a few key strategies to minimize losses and maximize returns:
Concentration of Capital: Ackman often places large amounts of capital in a few high-conviction investments. This allows him to have a significant impact on the companies he invests in but also requires disciplined risk management and careful positioning.
Leverage and Shorting: Ackman has used leverage in some of his more aggressive plays, such as shorting positions in Herbalife, to maximize returns. This adds a level of risk, but when used correctly, it can significantly amplify his gains.
Focus on Catalyst-Driven Events: He places his investments based on company-specific catalysts like management changes, mergers, or restructurings. This allows him to predict when a stock will outperform or underperform.
What This Means for Investors
Bill Ackman’s approach to investing is not for the faint of heart. It involves big risks and big rewards. His activist investing style is about taking concentrated positions, being willing to fight for change, and holding onto those investments for the long haul.
For investors, there are valuable lessons to be learned from Ackman’s strategies:
Don’t be afraid to make big bets. If you believe in a company’s long-term potential, be prepared to back it with significant capital.
Know the companies you invest in. Ackman is famous for his in-depth research before making any move. This is a lesson for every investor – do your homework before making investment decisions.
Take a long-term view. While Ackman is an activist, he is also a patient investor. He understands that meaningful change takes time, and he’s willing to wait for the payoff.
Conclusion
Bill Ackman’s approach to investing has made him one of the most influential investors of his time. By focusing on concentrated bets, thoroughly researching companies, and taking an activist role, Ackman has proven that bold moves and long-term vision can lead to great success.
Have you followed any of Bill Ackman’s investments or strategies? Share your thoughts and experiences in the comments below! Let’s learn and grow together!

XRP FINAL STEEP DISCOUNT OPPORTUNITY IS IMMINENTMy time-wave cycles analysis (among other components) indicating we will have a final sell wave to 1.45-1.7 zone over coming days (before FOMC meeting in March imo).
Granted I was a little off on exact timing to reach the buy-side targets back in December but nonetheless accurate on projected price levels..See prior analysis at attached link for the projected high coming in at 3.1-3.3, exactly as it happened...
I have no doubt this final sell wave will also occur. Depending on your goals & trading style, you may treat this next sell wave as an opportunity to simply add more at discounted levels via DCA'ing....or choose to sell at these relative highs to maximize position size once again from sub-1.70 levels.. I DO NOT EXPECT US TO SEE sub-3$ ANYTIMEagain after this next sell wave completes & then buyers take us to 4+ in q2 & beyond.
Expecting this to be the FINAL steep discount buying opportunity for those interested in maximizing their capital purchasing power for long term speculative hodling
Follow for additional actionable alerts & analysis. Appreciate the boosts & looking forward to your comments as well!

Gold Cup and Handle?Gold doesn't seem to move even with high Inflation data in the past months, possibly because the Crypto market is eating slowly it's market.
However it seems like there is potential Cup and Handle which might lead to Gold prices around 2500$ Ounce in the next few years.
A possible catalyst might be invasion of Ukraine, since Gold performs quite well during wars - however I truly Hope this never happens.
Just posting this here so I can keep track of it in the future, will update it if there is any news ahead.

NVIDIA The Next long Too Take I cover NVIDIA Range and where I perceive us to gravitate too from the current level . Watch This Before You Buy Nvidia

Let's speak about savings...Hey guys,
As I've lately taken great interest in publishing my trading ideas here on TradingView,
I want to speak about something that rarely if ever gets spoken about in the trading community, by trading community I mean us goobers on charts who do intra-day, swing, day trading etc... who get sad for not making 10% a month on forex etc...
That is your savings, specifically investing your savings on a long term basis and compound the interest earned by the dividend yields.
Useless to say that I'll be speaking about the S&P 500 and how you can approach it too.
First of all, you can't directly buy the S&P500 that you see here on trading view, as this is an index and in order for you to invest in the performance of the index you need to buy into ETFs, mutual funds, or derivatives like options and futures that are designed to track it.
There are many big funds around, like iShares, Fidelity, Vanguard, Amundi etc...
To be honest the one I personally invest into is the Core S&P 500 USD Acc from iShares that auto compounds the dividends but you really can choose between tens of funds.
The key factors that you must keep into consideration when choosing a fund are these:
- Currency of the fund (what currency is the fund based on)= if it is another country's currency, you'll have to exchange it every time you want to make an entry, amounting to extra commissions and fees that aren't sexy.
- Dividends= if the fund pays out dividends, if it pays it in cash or shares or if it self reinvests them or it doesn't...
- Tax residency of the fund (on which exchange is the Fund/ETF listed on)= important as when it will come to pay your taxes, some funds may have extra taxes due to the residency/exchange.
Now... let's get to the sauce, you have probably heard about DCA (Dollar Cost Average) as it's been rubbed on your face by everyone who never looked at a chart, and that's a valid approach if you are 50, but we spend half of our days on the charts so we want to work based on charts and price, not on time.
My philosophy behind this is that, if our goal is maximizing profit while spreading entries evenly, we should aim to get the best entries, and how could time, which has nothing to do with price, dictate our entries?
It is quite literally putting your finger down randomly on the chart and choosing to enter there.
There is a way easier and more effective approach, and that's basing yourself on price by simply buying the dip.
Yes, I quite literally wrote all of this article just to tell you to buy the dips, but here's a little practical example on why buying the dip performs better than DCA and what values you could look for yourself to try to optimize your entries.
The most basic approach to DCA is to buy a set amount each month, for the sake of the example let's say you would have bought $1000 worth of shares every 30 days starting from Feb/2022, your entries would have been spread out randomly and you would end up with roughly $42.000 today, which would be more if you reinvested all the dividends and profits.
A better approach would be buying each time there is a dip of X percentage in price.
If during the same time we would have bought about 200$ every time price dipped 1.25% we would have made 192 entries and made around $51.000 without compounding interest and dividends, then that would be closer to 55.000 - 60.000.
All of this just by basing ourself on price and not time.
You wouldn't evaluate taste with sounds, or sounds with numbers... so why evaluate numbers with time? Rather stick to what the chart itself does and get the best spread out entries possible, like this not only you would make more money, but have way more entries spread out through the chart for about the same initial capital, which is not bad when you are planning to long term invest.
To wrap it up, my practical example is buying the S&P500 (or another index you like), every time price drops of 1.25% - 1.75% in a single day, and compound interest every time you get a entry. Like this you'll set yourself an long term investment fund that will grow exponentially through the years and help you more than save your money through the years.
As as we all know but not admit that spending comes easy when money is laying around, so stash the unnecessary and see it grow ;)
the numbers in the example are rough estimates but give the actual idea of performance, and excuse me for the simplicity of the argument but it always comes handy

AMAZON -- Results of Buying before the SplitSharing some insights of when I bought Amazon before the split, It was a great decision as it has given my portfolio a great boost. It has been very bullish trending higher, and February started off on a good note so far. Ideally I would love to see it take the Previous months highs and keep pumping.
I would not be surprised if it reached MIL:1K per stock again. BUT NOT FINANCIAL ADVICE, and I also have no real data to support this theory yet. It is just my biased beliefs.
Stocks, Forex, Crypto and Futures Trading Risk Disclosure:
The National Futures Association (NFA) and Commodity Futures Trading Commission (CFTC), the regulatory agencies for the forex and futures markets in the United States, require that customers be informed about potential risks in trading these markets. If you do not fully understand the risks, please seek advice from an independent financial advisor before engaging in trading.
Trading forex and futures on margin carries a high level of risk and may not be suitable for all investors. The high degree of leverage can work against you as well as for you. Before deciding to trade, you should carefully consider your investment objectives, level of experience, and risk appetite.
There is a possibility of losing some or all of your initial investment, and therefore, you should not invest money that you cannot afford to lose. Be aware of the risks associated with leveraged trading and seek professional advice if necessary.
BDRipTrades Market Opinions (also applies to BDelCiel and Aligned & Wealthy LLC):
Any opinions, news, research, analysis, prices, or other information contained in my content (including live streams, videos, and posts) are provided as general market commentary only and do not constitute investment advice. BDRipTrades, BDelCiel, and Aligned & Wealthy LLC will not accept liability for any loss or damage, including but not limited to, any loss of profit, which may arise directly or indirectly from the use of or reliance on such information.
Accuracy of Information: The content I provide is subject to change at any time without notice and is intended solely for educational and informational purposes. While I strive for accuracy, I do not guarantee the completeness or reliability of any information. I am not responsible for any losses incurred due to reliance on any information shared through my platforms.
Government-Required Risk Disclaimer and Disclosure Statement:
CFTC RULE 4.41 - HYPOTHETICAL OR SIMULATED PERFORMANCE RESULTS HAVE CERTAIN LIMITATIONS. UNLIKE AN ACTUAL PERFORMANCE RECORD, SIMULATED RESULTS DO NOT REPRESENT ACTUAL TRADING. ALSO, SINCE THE TRADES HAVE NOT BEEN EXECUTED, THE RESULTS MAY HAVE UNDER-OR-OVER COMPENSATED FOR THE IMPACT, IF ANY, OF CERTAIN MARKET FACTORS, SUCH AS LACK OF LIQUIDITY. SIMULATED TRADING PROGRAMS IN GENERAL ARE ALSO SUBJECT TO THE FACT THAT THEY ARE DESIGNED WITH THE BENEFIT OF HINDSIGHT. NO REPRESENTATION IS BEING MADE THAT ANY ACCOUNT WILL OR IS LIKELY TO ACHIEVE PROFIT OR LOSSES SIMILAR TO THOSE SHOWN.
Performance results discussed in my content are hypothetical and subject to limitations. There are frequently sharp differences between hypothetical performance results and the actual results subsequently achieved by any particular trading strategy. One of the limitations of hypothetical trading results is that they do not account for real-world financial risk.
Furthermore, past performance of any trading system or strategy does not guarantee future results.
General Trading Disclaimer:
Trading in futures, forex, and other leveraged products involves substantial risk and is not appropriate for all investors.
Do not trade with money you cannot afford to lose.
I do not provide buy/sell signals, financial advice, or investment recommendations.
Any decisions you make based on my content are solely your responsibility.
By engaging with my content, including live streams, videos, educational materials, and any communication through my platforms, you acknowledge and accept that all trading decisions you make are at your own risk. BDRipTrades, BDelCiel, and Aligned & Wealthy LLC cannot and will not be held responsible for any trading losses you may incur.

SPX Nears All-Time Highs – Is a Breakout Imminent?The S&P 500 Index (SPX) has been following a strong upward trajectory, consistently forming higher highs (HH) and higher lows (HL), indicating a bullish trend.
However, the price is now approaching a rising trendline that has acted as a key resistance multiple times in the past.

#PEPE is About to Breakout!#PEPE is About to Breakout ✅
Get ready for the upcoming move!
Stay tuned for more
DYOR, NFA
#Crypto #Altseason2025

Prakash Ind Long Weekly BOIt has been consolidating for the last 16 years and is now giving a breakout on both weekly and monthly timeframes. Whenever a breakout occurs, it's often accompanied by changes in revenue, profits, and other fundamental ratios, indicating that the company is performing well.
Remember to do your own research before investing.

XAGUSD: 28/10/24After touching new levels, not seen in years. History shows theirs a high probability we're due to see something big.
Silver sits at around 33/o after climbing and tickling 35/o...
A retest of 32/o and climb to new highs is a high probability.

LONG HANGSENG"Don't fear the noise from analysts.
Trump's win and Hang Seng's current valuation are likely already priced in. Many analysts won't clarify this because narratives can drive market behavior.
Stay informed, but think critically. 🧠📉"
Risk Reward is clearly visible in CHART.
Just follow charts rather than Narratives and Analysts.

GNA Axles Limited Going Towards Its All TIME HIGH's NSE:GNA
GNA Axles is engaged in the Business of manufactures auto components for the four-wheeler industry, primary product being Rear Axles, Shafts, Spindles & other Automobiles Components for sale in domestic and foreign market.
..................................................................................................................
..................................................................................................................
..................................................................................................................
Key strengths
Extensive experience of promoters/management and long track record of operations
GNA was promoted by Late Rachhpall Singh and his brother Gursaran Singh, the latter being the company’s current managing
director with around five decades of industry experience. His son, Ranbir Singh, and other family members are also involved in
the company’s day-to-day business activities. The company directors are assisted by a team of professionals who are highly
experienced in their respective domains. Being established in 1946, the GNA group, which also includes GNA Gears Limited, has
a long track record of operations.
...............................................................................
Diversified revenue stream across product segments and geographies
The company supplies its products to varied segments of the automotive industry, including commercial vehicles (CV or the onhighway segment), tractors, farm equipment, and earth moving equipment (all three being part of the off-road segment). The
company derives significant income from export of its products to the US, Europe, Asia Pacific (Japan and China among others),
Mexico, Brazil, and so forth, with exports constituting around 53% of its total operating income (TOI) in FY23 (refers to April 1
to March 31) . The company is a Tier-1 vendor for its supplies in domestic off-road segment, while in the
exports markets, it supplies axles and spindles to larger and more established Tier-1 vendors.
................................................................................
Long and established relationship with customers
The GNA group has been operating in the auto component industry since 1946, thus having built time-tested relationship with
customers – with some ever since the commencement of its operations. Besides, it has been supplying to some of its export
customers since 2000. GNA markets its products through the common group marketing network catering a whole range of
products, including axles, gears, and shafts under one roof. The long and established relationship with customers provides revenue
stability to the company, subject to overall industry demand scenario.
....................................................................................
Reputed, though concentrated customer base
While GNA faces customer concentration with its top-5 and top-10 customers accounting for around 64% and around 80% of its
total gross sales in FY23, the risk is largely mitigated as the top revenue contributors are well-established players and enjoy strong
position in the industry. GNA is the main supplier of axle shafts to most of the original equipment manufacturers (OEMs) that it
supplies to, and by virtue of its long-standing relationships with the customers, the company has a strong market position. For
some of its export customers, the supplies are made by GNA for their plants in various countries, thereby mitigating the risk
arising from slowdown in one geographical location.
.........................................................................
Comfortable scale of operations with largely steady margins
In FY24, the company achieved TOI of ₹1,508.67 crore compared to a TOI of ₹1,582.93 crore in FY23 driven by moderation in
price realisations owing to weak tractor sales in the domestic market. The profit before interest, lease rentals, depreciation and
taxation (PBILDT) margin marginally declined to 13.24% in FY24 (PY: 14.70%). The profit after tax (PAT) margins declined to
6.63% in FY24 from 8.22% in FY23.
.......................................................................................
Comfortable financial risk profile
The company’s capital structure remained comfortable with long-term debt-to equity and overall gearing ratios of 0.04x and
0.24x, as on March 31, 2024, respectively (PY: 0.07x and 0.28x, respectively). The same improved mainly due to reduction in
debt and accretion of profits to the net worth. The company has low reliance on working capital borrowings as it only avails the
pre-shipment credit for exports and substantial portion of its inherently high working capital requirements are funded by internal
accruals. The interest coverage ratio remained healthy at 17.3x in FY24 (PY: 21.22x) due to healthy profitability and low interest
costs on foreign currency borrowings. The company’s total debt to PBILDT stood comfortable at 0.95 as on March 21, 2024 (PY:
0.87x).

Ethereum (ETH) Bullish Pennant AlertEthereum continues to show a bullish setup with a long-term bullish pennant pattern forming on the chart. Based on Fibonacci extension levels, we can project both conservative and aggressive price targets, with the potential for a blow-off top around $20,000, aligning with the 200% Fibonacci retracement level.
Key Technical Highlights:
Pattern: Bullish Pennant (Continuation Pattern)
Current Price: ~$2.2k-$2.3k
Fibonacci Extension Levels:
1.272 Extension: $7-$7.5k
1.414 Extension: $7.5-$9.3k
1.618 Extension: $10k- GETTEX:13K
200% Retracement: $20,000 (Potential blow-off top target)
Why this setup is promising:
Bullish Pennant: Ethereum’s price consolidation within this pattern suggests a bullish continuation, with Fibonacci levels offering reliable price targets.
Strong Fundamentals: Increasing on-chain activity, network upgrades, and growing institutional interest support the potential for higher price action.
Volume Contraction: Volume has been contracting during the consolidation, a common precursor to a breakout.
Strategy:
Entry: Consider entering on a confirmed breakout above $2.7k with strong volume.
Stop Loss: Below $2k for risk management.
Disclaimer: This is not financial advice. Always conduct your own research before making investment decisions.

$DOP is down 95% since presaleI think KUCOIN:DOPUSDT (data ownership protocol) will be the best performing altcoin of 2024 & 2025
The initial investors were investing for a quick flip, they helped DOP raise $162m in April 2024
The DOP treasury is worth more than double the current FDV

ROSSARI BIOTECH Showing Change in Price StructureNSE:ROSSARI
....................................................................................................................
....................................................................................................................
....................................................................................................................
Update on the expansion projects at Dahej Facilities
....................................................................................................................
• In the Q2FY24 the Company had announced an expansion of its facility at Dahej by adding up
20,000 MTPA capacity for products related to HPPC in the specialty chemical space, as well as for producing ingredients for its subsidiary companies.
Also, to cater to the growing
demand in agro chemicals, home and personal care, oil & gas and the pharma sector, the
Company had further announced expansion of the Ethoxylation capacity by 30,000 MTPA at
the Dahej facility of Unitop Chemicals Private Limited.
• Work on both these projects are progressing as planned. Commissioning is expected to
happen, in a phased manner in the current year
....................................................................................................................
....................................................................................................................
....................................................................................................................
• Consistent growth trajectory over the past three years, driven by both organic and inorganic growth strategies
• While near-term investments and strategic initiatives have led to a moderation in ROCE and ROE, the balance sheet position
remains strong.
The Company is confident of reporting improved return metrics in the future as these investments start yielding
results

SWSOLAR Getting Ready to Break its 2019's & All Time HighNSE:SWSOLAR
.................................................................................................................
.................................................................................................................
.................................................................................................................
| KEY HIGHLIGHTS FOR 1Q FY25
...............................................................................
• Unexecuted order value at ~INR 9,396 crore as of June 2024
compared to ~INR 8,084 crore as of Mar 2024
• Company has received new orders / LOI in three domestic
projects worth ~INR 1,016 crore during the quarter
• Company received two turnkey international orders from South
Africa amounting to ~USD 140 mn
• Commenced a pilot project for Solar plus BESS for Reliance
Industries at Jamnagar, Gujarat
• P&L of the company continues to improve
• Consol revenues up ~78% YoY in 1QFY25
• Gross margins at ~11%
• Second consecutive quarter of positive EBITDA, PBT and PAT
at a consolidated level
............................................................................................................
• The company’s balance sheet continues to de-leverage
............................................................................................................
• Total net debt of ~INR 97 crore as of Jun 2024, compared
to net debt of ~INR 116 crore in Mar 2024
• No upcoming debt repayments till 3QFY25
.................................................................................................................
.................................................................................................................
.................................................................................................................
Received order of 900 MW DC in 1QFY25
• Received a turnkey solar PV order from AMEA Power in South
Africa for a ~140 MW DC project
• Through this project, SWREL has achieved a key breakthrough in
the rapidly growing South African solar market.
• We have successfully executed a 90 MW DC order in South
Africa in 2016 previously, and continue to maintain O&M
operations there
• Bagged our second international order from South Africa with a
turnkey package for a 80 MW AC project from Energy Group
.................................................................................................................
.................................................................................................................
.................................................................................................................

Stock for Short Term Investment
Buy range 193
Target 210,230,240,280,300,325
Holding Period Short Term

Can 128% be soon?Cardano (ADA) is one of my favourite coins which I choose to invest in. This is trade (investment) setup on larger timeframe. If you never bought ADA before it is still not late. I am not looking to reach targets 2,3,4 very soon, that could be year(s). I will sell most of my capital on targets 2,3. Small portion will be sold on Target 1 and hopefully on Target 4.
Entry Zone: 0.50 – 0.57
Buy Zone 1: 0.30 – 0.37
Buy Zone 2: 0.13 – 0.16
Target 1: 1.33 – 1.44 (128%)
Target 2: 2.83 – 2.93 (390%)
Target 3: 4.35 – 4.89 (651%)
Target 4: 5.73 – 5.84 (891%)
